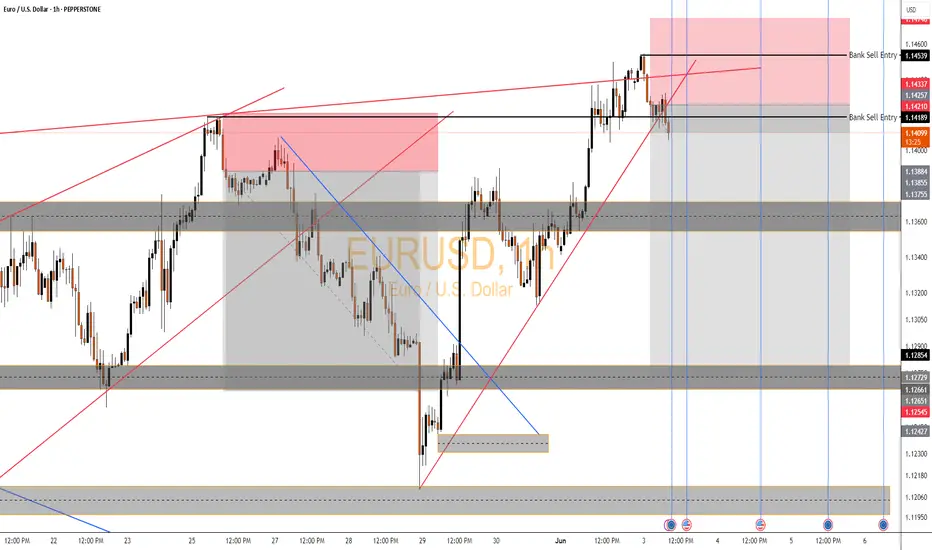
EURUSD Sell SetupEURUSD – Institutional Short Setup 🔻
Timeframe: 1H
Date: June 3, 2025
Strategy: OdinVerse HP – Bank Entry Trap + Supply Stack Breakdown
🧠 Smart Money Logic
🔍 Key Zone Details
🔴 Upper Bank Sell Entry (1.14539 – 1.14337) Final liquidity sweep into major HTF supply – fakeout push before drop.
🔴 Lower Bank Sell Entry (1.14210 – 1.14127) True institutional entry zone. Price retested this zone before rejection.
🔻 Current Reaction Zone Price is rejecting the lower zone with bearish follow-through and structure shift.
🔑 Key Confluences
Fakeout Above Trendline → Trap breakouts at the top of rising wedge.
Double Bank Sell Zones → Clear signs of institutional order stacking.
Market Structure Shift → Clean BOS (break of structure) after retest of lower zone.
Mitigation Complete → Last bullish OB fully mitigated, turning supply active.
Daily EQM Sweep → Targeting imbalance & unfilled FVGs below (1.1285 to 1.1200).
🎯 Targets
🎯 TP Levels Zone/Logic
1.13884 Prior demand base / FVG top
1.12854 Major imbalance completion
1.12545 – 1.1200 Liquidity grab + OB tap zone
⚔️ Execution Plan
In Position? Hold – structure confirms clean sell trap.
Missed Entry? Wait for M5–M15 OB retest or mitigation around 1.1415.
Reversal Risk? Only invalid if 1.1454 breaks with close above.
🔥 OdinVerse Grade: A+ Setup
✔ HTF Supply Confluence
✔ Dual Bank Entry Zones
✔ Structure Shift
✔ Clean Downside Liquidity Targets
RFI
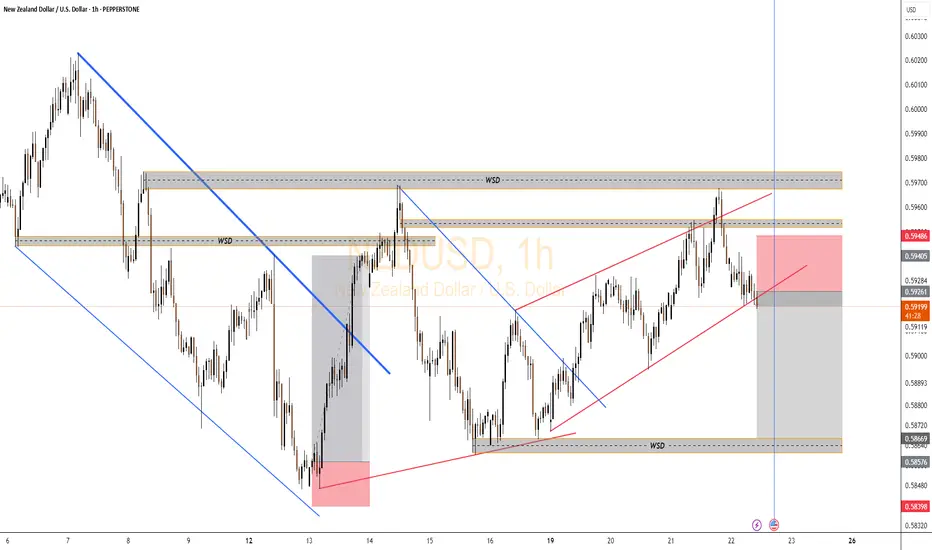
NZDUSD Bearish Setup🔍 Market Structure Analysis
WSD Zone Rejection (Top):
Price tapped a wick-based supply & demand (WSD) zone at the top around 0.59486.
That zone also aligns with the previous liquidity grab + mitigation of the OB.
Price is now rejecting that area — forming a lower high (LH) inside the zone → classic sign of distribution.
Rising Channel Break:
Price was rising inside the red ascending channel.
Currently showing bearish intent, with multiple internal BOS (breaks of structure).
If price closes below the channel, that confirms bearish expansion.
Downtrend from Premium Zone:
We're clearly in premium pricing, where institutions prefer to offload longs.
This area also completes a liquidity sweep of prior highs inside the WSD zone.
🧠 Trade Logic (Sell Setup)
🔺 Entry Zone: Inside or after rejection of WSD at 0.59486.
🛑 Stop Loss: Just above the WSD zone and local high.
🎯 Take Profits:
TP1: 0.58669 → Local support + lower WSD zone (reaction zone).
TP2: 0.58398 → Previous liquidity pool and external low.
🧾 R:R = Clean 1:4.5+, textbook SMC setup.
📌 Confluences for Bearish Bias
✅ Multiple WSD zones tested with bearish rejection.
✅ Rising channel inside premium is breaking.
✅ Mitigation + BOS on smaller TF.
✅ News candle marked by blue vertical line may act as final volatility spike before continuation.
✅ Price is near VWAP/50% equilibrium → Ideal for smart money to expand to downside.
🧯 Invalidation Conditions
❌ If price closes above 0.59486, we reassess the bias.
❌ A re-entry into the upper WSD with strong bullish volume invalidates the current bearish flow.
🔮 Forecast Summary
This is a classic distribution setup with liquidity engineered into a WSD zone, now showing early mitigation and markdown signs. Unless major manipulation occurs, expect price to expand toward the 0.58398 low in the next 24–48 hours.
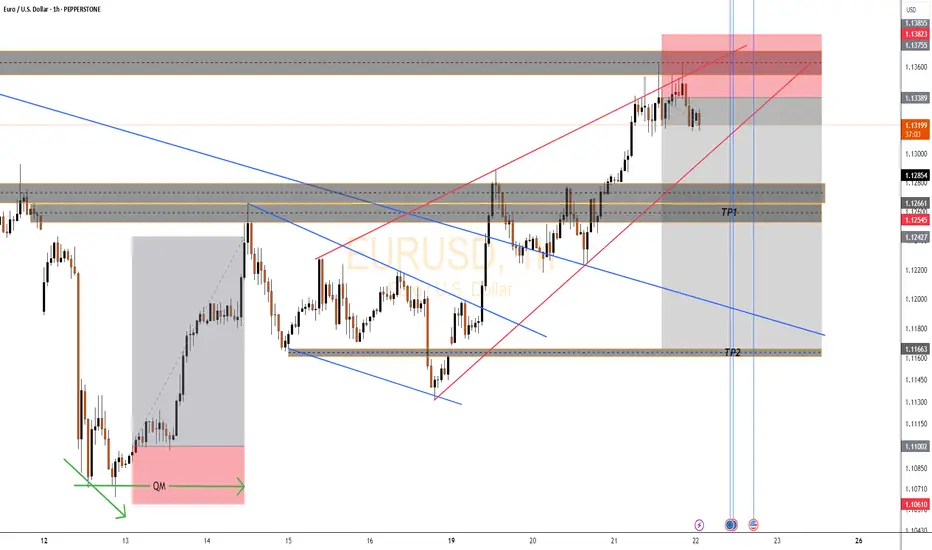
EURUSD Bearish Setup📌 Market Structure & Setup Summary
Major Supply Zone Rejection (Red Zone at Top):
Price tapped into higher timeframe supply zone at 1.13755 (red box).
This was a buy-side liquidity grab just above the previous high → textbook distribution zone.
Now price is respecting that zone and rejecting it with bearish momentum.
Bearish Rising Channel Broken:
Red trendlines show a rising wedge → often leads to a bearish breakout.
Price is currently breaking out of that wedge to the downside.
Premium Pricing Confirmed:
Price was pushed into the premium zone (above equilibrium), inducing buy orders → now being reversed.
🔄 Trade Plan (Short Bias)
✅ Entry: Activated inside the red supply zone after confirming wick rejections and structure shift.
🛑 Stop Loss: Above the red supply zone (above 1.13755).
🎯 Targets:
TP1 → 1.12545: Structure support and breaker block.
TP2 → 1.11663: Previous demand zone and trendline intersection.
TP3 (Optional) → 1.11002 – 1.10610: External liquidity + trendline + FVG zone.
📉 RR Ratio: Estimated 1:4 to 1:5+ if TP2/TP3 hits.
⚠️ Key Confluences
🔹 Bearish break of rising wedge = structural shift.
🔹 Rejection wick inside red supply + BOS.
🔹 TP zones aligned with previous OB, breaker blocks, and liquidity pools.
🔹 News/volatility likely during the double blue vertical lines, so expect reaction spikes.
🚫 Invalidation Criteria
If price closes above 1.13755, the idea is invalid.
Watch for manipulation or false breakouts during high-impact news.
🔮 Market Forecast
If current rejection holds, expecting price to seek sell-side liquidity from 1.12545, then 1.11663, and possibly lower. This is a classic distribution > BOS > retrace > expansion sequence.
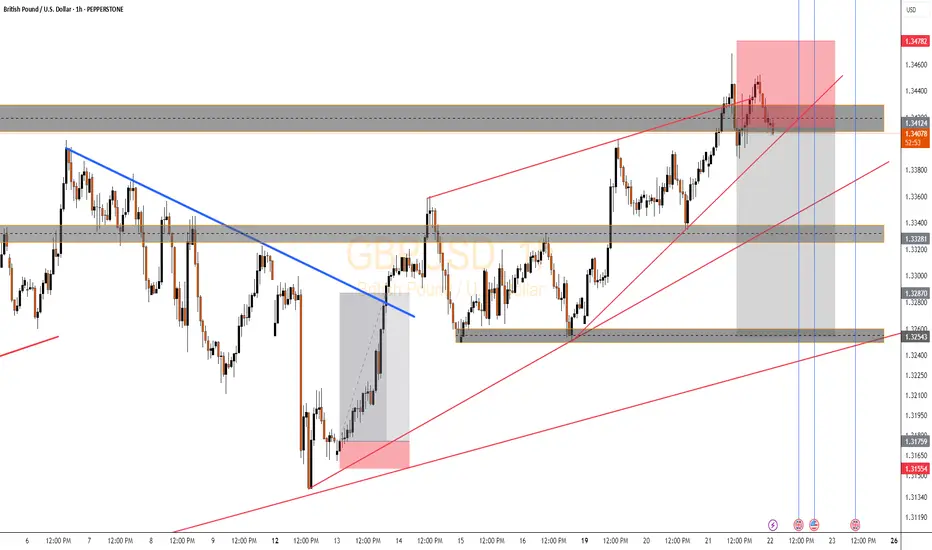
GBPUSD Bearish Setup📌 Current Market Structure
Liquidity Sweep + Rejection in Premium Zone:
Price tapped into the major supply zone (red box) sitting above the last high.
Liquidity above previous highs was swept, and now price is rejecting → a classic buy-side liquidity grab setup.
Bearish Rising Wedge Structure Broken:
Price broke the inner rising wedge (red trendlines) to the downside and is now retesting the supply zone.
Breakdown aligns with a potential reversal entry or at least a bearish pullback.
Higher Timeframe Supply Zone:
The red zone coincides with the 1.34782 resistance, which price failed to break cleanly above.
This zone holds institutional footprints → possible smart money distribution.
🧠 Trade Idea (Bearish Bias Confirmed)
✅ Entry: Already activated inside the red supply zone.
📍 Stop Loss: Just above the red box (around 1.3480).
🎯 Target Zones:
TP1: 1.33281 → minor demand zone and previous consolidation.
TP2: 1.32870 → previous BOS retest zone.
TP3: 1.32543 → deep demand zone and trendline intersection.
TP4: 1.31759–1.31554 → external liquidity resting below structure (long-term target).
🔻 Risk-to-Reward: Excellent potential up to 1:5+ RR if TP4 hits.
🔄 Reversal Signals Confirmation
Watch for:
Bearish engulfing candles with rising volume inside the red zone (VSA style).
Displacement candle or M5–M15 BOS confirming internal structure shift.
⚠️ Invalidation Zone
If price closes a 1H candle above 1.3480, setup is invalidated.
Watch out for possible manipulation during the vertical blue lines (likely high-impact news).
🔮 Forecast:
Expecting a mid- to long-term retracement or reversal back to the 1.31700s – 1.32800s region, based on the current rejection from premium supply and completion of a liquidity sweep.
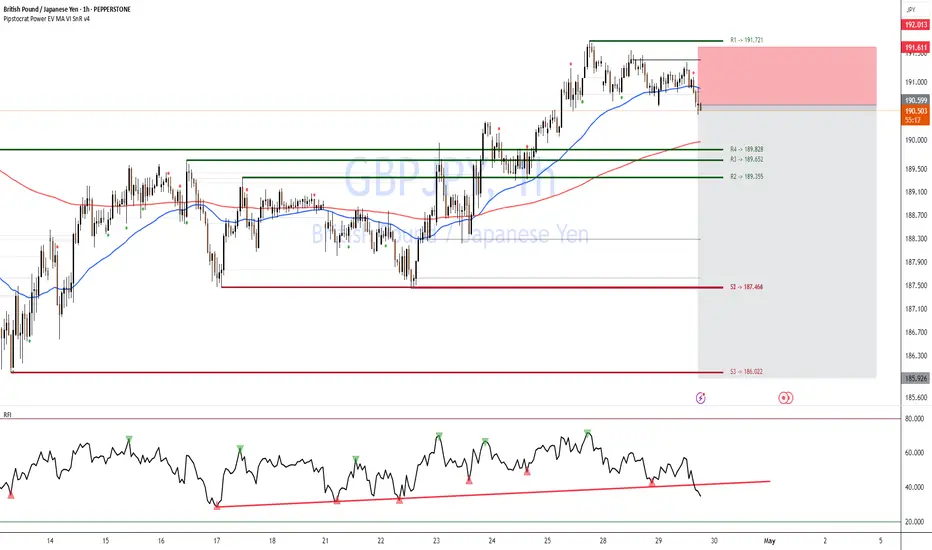
GBPJPY bearish move🔹 Pair / TF | GBP/JPY, 1 h → 15 m |
| 🔹 Bias | Bearish (selling the break of support) |
1. 📊 Key Levels
Level Price Role
R1 191.721 Major resistance (green)
Broken Support 190.65 (black line) Minor support → now resistance
R4 189.828 Next minor support
R2 189.355 Next major support
2. 🚨 Trigger
Price closes below the 190.65 support (black line) on 1 h, AND
200-hour MA (red) has just been rejected—sellers stepping in.
This decisive break flips 190.65 into new resistance.
3. ✅ Confirmation
RFI oscillator on 15 m dips below its rising trendline and fails to reclaim it.
Momentum is clearly bearish—no divergence or oversold reversal signal.
4. 🎯 Entry & Stops
| 🔶 Entry Zone | 0.19060–0.19050 (just below 190.65) | | 🔴 Stop-Loss | 0.19180 (above R1 at 191.72) ≈ 120 pips |
Place a Sell-Stop at 0.19055 (mid-zone).
Risk: 1–2% of account on ~120-pip SL.
5. 🎯 Profit Targets
Target Level Pips RRR
T1 R4 189.828 ~82 pips 1 : 0.7
T2 R2 189.355 ~125 pips 1 : 1
Scale out:
Exit ½ at T1.
Let the rest run to T2.
6. ⚙️ Trade Management
Move SL to breakeven once +40 pips in profit.
Monitor RFI on 15 m:
If RFI spikes above its trendline before T1, close remaining.
Adjust if you see large wicks or volume spikes into support zones.
7. 🔑 Rationale
Support→Resistance flip at 190.65 gives a logical entry & SL.
200-hour MA rejection confirms sellers overpowering buyers.
RFI confirms sustained bearish momentum.
High RRR (>1 : 1) ensures edge even with a moderate win-rate.
⚡ Highlight:
This is a bank-order-flow style fade—selling the break of minor support after a MA confluence test, riding momentum into larger support zones.
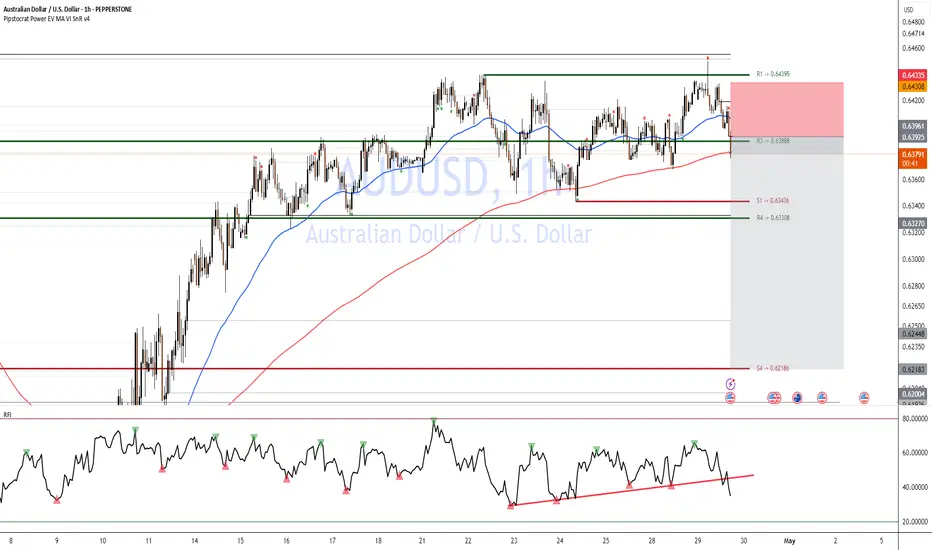
AUSSIE bearish move Short-setup: Breakdown of Support (AUD/USD)
Trigger: Price has decisively broken below R3 (0.63888) and the 200-hour MA (red) on the 1h chart.
Confirmation: RFI just dipped below its ascending trendline and failed to reclaim it—momentum is bearish.
Entry: Short at market 0.6385–0.6380 (just below R3).
Initial Stop: Above R1 (0.64395) ≈ 55 pips stop.
Targets:
T1: S1 (0.63436) (~40 pips → RRR ≈ 1 : 0.7)
T2: R4 (0.63308) (~55 pips → RRR ≈ 1 : 1)
⚡ Highlight: This is a bank-order-flow style fade—selling the break of minor support after a test of the 200-hour MA confluence.
🔑 Rationale
Support→Resistance flip at R3 gives logical entry & SL.
200-hour MA rejection confirms sellers overpowering buyers.
RFI confirms sustained bearish momentum.
High RRR (>1:1) ensures edge even with moderate win-rate.