XRPUSD - 2.87 Year Old Trend-Line Broken, What Comes Next?!_______________________________________________________________________________________________________________________________________________________________________
Hello, Hello, Hello! Traders, Investors and Community! Welcome to this tremendous significant RIPPLE / US DOLLAR analysis, I detected some important signs of where we heading the next weeks and months and important support levels which we need to hold.
The corona fears going on these days and the markets showing volatility never seen for years. For wise traders that doesn't mean crying! For wise traders that does mean searching for profitable opportunities!
_______________________________________________________________________________________________________________________________________________________________________
As you can see in my chart RIPPLE just broke down a very very very important support trend-line which was there for 1043 days that means 2.87 in years.
This trend-line held the whole structure up and now it is broken, as for now this break looks like a bear-trap BUT that does not mean we are out of the woods, as you can see in my chart we have a huge bearish zone below the trend-line.
For now, I see some steady up-trends coming the next weeks and months but these up-trends will trade into resistance right above RIPPLES head, you can see it marked with the resistance levels and the major important falling trend-line which first need to be surpassed to develop further up-trends.
The 50 and 200 EMA marked in orange and purple showing resistance also, which means we have another confluence for resistance in the area. When the price touching this area it is important to show good bullish continuation signs otherwise ripple will fall back into the bearish zone which would accomplish a slow death ride to lower levels.
Considering this scenario, trade on the SHORT side will be appropriate when a reversal confirmed but for now, the price first has to visit these areas.
When dividing the chart into bullish, neutral and bearish areas there are, as mentioned clear obstacles in the neutral zone for ripple to turn bullish:
For the next weeks and months we can expect some good up-moves coming but what hold ripple back in this structure are the few resistance levels that shouldn't be ignored. When these levels confirm as resistance a SHORT trade will be appropriate otherwise we have to watch out for a possible bullish confirmation leaving the obstacles
in the neutral zone behind and confirm the turning-point into the green bullish area as seen in my chart.
_______________________________________________________________________________________________________________________________________________________________________
Thanks for watching my analysis! Hopefully, it will be profitable for you. There are always opportunities in markets also in times of great fear or greed, good treaders keep a cool head and look for the golden apples popping up ;)
For more market insight feel free to support.
Information provided is only educational and should not be used to take action in markets.
_______________________________________________________________________________________________________________________________________________________________________
Ripple

XRP's rally today isn't the real breakout, but it's coming soon!Bitcoin bounce hard today taking out the 50K psychological barrier. Many alt-coins followed as well. Some like XRP rallied a little bit, but not too much. Why? Because, the money inflows right now are mainly focused on Bitcoin, and a few altcoins, but when the Bitcoin rally runs enough, cash will flow into cheaper alternatives.
XRP is showing a bearish divergence on the hourly chart, which most likely is indicating that the price action will fall back to, or near the lower trend line on the chart above. This same pattern played out not to long ago, and will likely repeat, as the people that missed today's rally will be looking for an entry point if/when it pulls back, and the additional money inflows will cause each following run to gain momentum until it ultimately breaks through the upper trend line, pulls back, bounces off it, then runs for a nice gain.
This is just my opinion, and in trading there are no guarantees or absolutes!
Good luck, and always use a stop. #NeverFOMO

RIPPLES BULL-MARKET COULD BE IN THE MIDDLE STAGES - HERE IS WHY_______________________________________________________________________________________________________________________________________________________
Hello my friends, today I will look at an important observation showing a repeating pattern on a larger scale.
It also shows the events which occur the next weeks and months before the final XRPUSD break-out will happen. Let's go!
_______________________________________________________________________________________________________________________________________________________
At observing ripples long-term weekly chart I first found a massive up-trend channel which is drawn from the lowest point (green)
to the ending of the first correction (also green) and the first all-time high (red), You can see this channel connecting coherently the
lows and highs from this massive and stable up-trend.
There is also this first longer correction which you see in my chart marked with the pink box divided into smaller boxes with light-blue dividing-lines
and separated into phases one, two and three forming chronically the over-all correction before the final moonshots happened.
The correction is divided into phase one: The first stage of the correction in which heavy supply enters the market and shrinking in price occurs
The next phase, phase two: It is the stage in which supply falls below the previous level and demand begins to fill the market and price rises, it is also the
phase in which many professional investors and institutionals entering the market-landscape, as price rises demand does also.
The final most important phase three: Is the last phase before the big boom break-out occurs and prices rise massively to form higher highs at significant levels.
In this phase volatility and volume diminish but the price remains trading in the same range as seen in phase two. Both retail and institutional investors buying
shares and prepare for the final break-out. Before the break-out occurs we can see a massive decrease in momentum as low momentum is associated with
a strong break-out the bull-market occurs after the touch of the lower line of channel.
As I saw at looking at the chart now I could capture the same pattern forming again, just in a broader time and price altitude. We are just entering phase two
now in which many professional people will enter the market-landscape. So as many people talking about that XRPUSD can fall to lower levels I do not really see
that scenario possibly happen in the foreseeable future as we holding up this strong support level and the pattern form looks just like the correction seen before.
Considering the bigger altitude in the current correction occurring we can say that the bull market will be enormous and of larger size as the bull market seen
before, as it always the case with a bigger altitude and price swings we can expect bigger altitude and price swings in the future. I would be extra vary with shorting
ripple in the current situation as it could backfire soon, we are entering phase two now in which consolidation is expected. Short-term trading could be considered here,
with LONG position but i personally wouldnt SHORT It right now.
_______________________________________________________________________________________________________________________________________________________
Please support, follow and like if you found this analysis useful, i will probably update on this scenario when more information is given. I wish everybody happy christmas and
a very very very nice happy new year, of course with good trading profits and a healthy and happy live! May all your goals come true!
_______________________________________________________________________________________________________________________________________________________

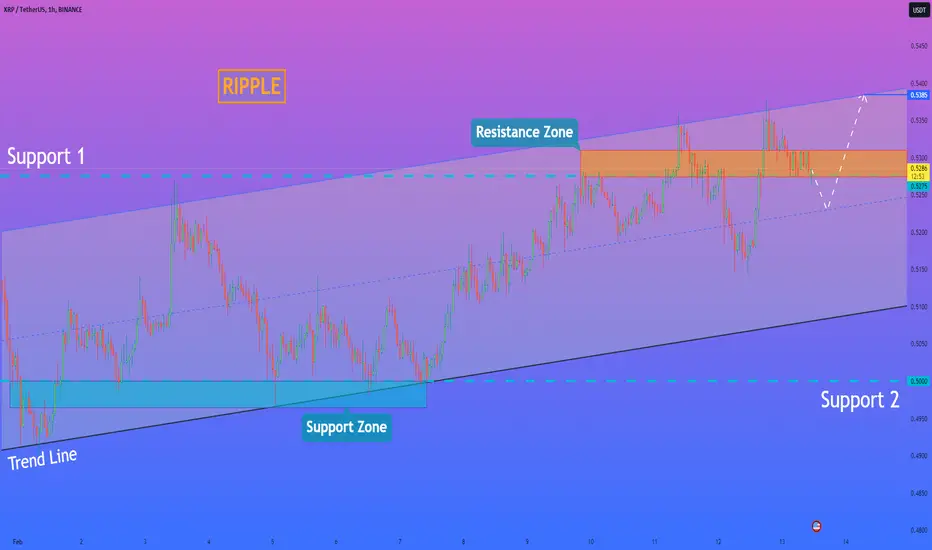
HelenP. I Ripple can correct below support level and rebound upHi folks today I'm prepared for you Ripple analytics. A not long time ago price declined to the trend line, which coincided with the support line of the upward channel, thereby breaking support 2. After this, Ripple in a short time rose higher than this level and later rose to the resistance line of the channel. Then price made a correction to support 2, which coincided with the support zone, some time traded near and then rebounded and continued to move up. Soon, Ripple reached support 1, which coincided with the resistance zone, but the price at once rebounded and little declined. Then the price turned around and broke support 1, but soon fell back, after which turned around and finally broke support 1. After this, the price rose to the resistance line of the channel, but a not long time ago it rebounded and fell to the resistance zone, where XRP continued to trades very close to the support level. For my mind, Ripple will make a correction lower than support 1, after which it turns around and starts to move up to the resistance line of the channel. That's why I set my target at the 0.5385 level, which coincided with this line. If you like my analytics you may support me with your like/comment ❤️
#XRP (Ripple) Technical Analysis and Trade IdeaXRP exhibits clear signs of bearish pressure on both weekly and daily timeframes. The formation of lower highs and lower lows signals underlying weakness. Price has now reached a key support level, raising the potential for a retracement and a short entry opportunity.
Potential Trade Setup:
- Entry: Consider a short position upon a retracement, targeting previous weekly and daily lows.
- Rationale: Price action suggests continued downward momentum in Ripple, and the current support level may prompt a temporary bounce before further declines.
Important Disclaimer: This analysis reflects my personal market interpretation and does not constitute financial advice. Always conduct your own independent research and thorough risk assessment before making any trading decisions.

#XRP is now ready to move...Accumulation phase seems over not it' s time to move up in mid term.
NOT FINANCIAL ADVICE.
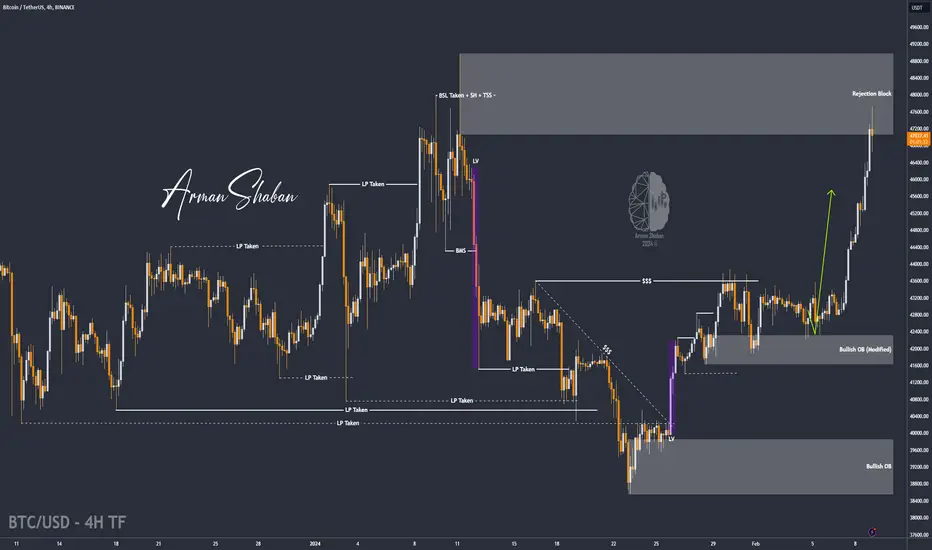
💎 BTC/USDT - Bull or Bear ? (READ THE CAPTION)As you can see, Bitcoin had an initial correction up to $46,600, but it came back with demand and is currently trading in the range of $48,300! Until this moment, we have not seen a strong negative reaction from Bitcoin, and this means that the power of the Bulls is still high! The demand ranges are $44,900 to $45,500, $42,800 to $43,300 and $38,500 to $39,800 respectively! In case of an upward trend, its mid-term targets are $50,400 and $52,400, respectively!
Please support me with your likes and comments to motivate me to share more analysis with you and share your opinion about the possible trend of this chart with me !
Best Regards , Arman Shaban

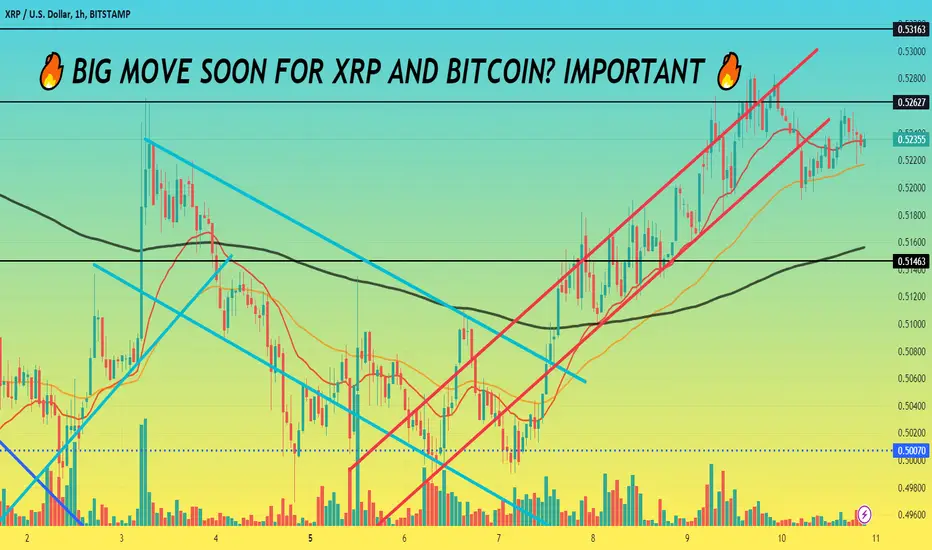
🔥 BIG MOVE SOON FOR XRP AND BITCOIN! IMPORTANT 🔥🔥 Hi hope everyone's doing well, wanted to come by and give a quick follow up and post before I have to head back to work but wishing the best as always and thanks for coming by as always!
🔥 This idea won't be too long but it'll be important so give it a quick read and check out some of the charts below! To cut to the chase, we can see XRP just about finally exiting out of this descending channel that it's been in since last year when we take a look at the 4 hour chart attached below:
🔥 Anyway we've got that as well as the combination of our 200 EMA being within arms reach so to say. If bulls can manage to regain that 200 EMA on the 4 hour chart then I can't emphasize just how much of a positive indicator that would be for us. We can clearly see how we had that flash drop at the start of the year and how losing that 200 EMA contributed so much to us falling, especially once we failed to regain it on the second attempt back in January.
🔥 With that all said and done next big picture we wanted to check on is Bitcoin. Bitcoin's at the same level at which we once stood back in January. This is undoubtedly gonna be a pretty big pivot point depending on whether or not we can break this resistance level by which we'll have a good shot at possibly forming/hitting new high's or at least hitting that $50,000 mark soon enough.
🔥 What that being said we can always have the opposite scenario and end up falling back down below our $47,000 level should that happen we could experience a similar flash sell to that in January following the ETF news though I wouldn't expect things to be as dramatic but then again, you can never be certain in this market, but past price action alone we're certain this level is going to likely make or break things for traders. Below is a bigger highlight of the big consolidation channel for Bitcoin that should be noted.
🔥 With the bigger picture here and a look at our big consolidation channel we can identify the points between $41,500-$43,000 to be this sort of horizontal consolidation channel for Bitcoin. Would definitely recommend adding to your own charts in case we come back to that point which is always a possibility. Traders are looking for a make or break indicator and hopefully we can avoid the latter.
🔥 With that all being said and I done I said this idea wouldn't be long and I keep to my word, just wanted to give a big picture view and quick analysis of both charts considering the fact that the market will likely stick close to Bitcoin and follow, the correlation grows apart sometimes but overall using Bitcoin as a lead indicator, confirmation can help us out over here too. That's it for today anyway, thanks for coming by as always and wishing the best as always till next.
~ Rock '
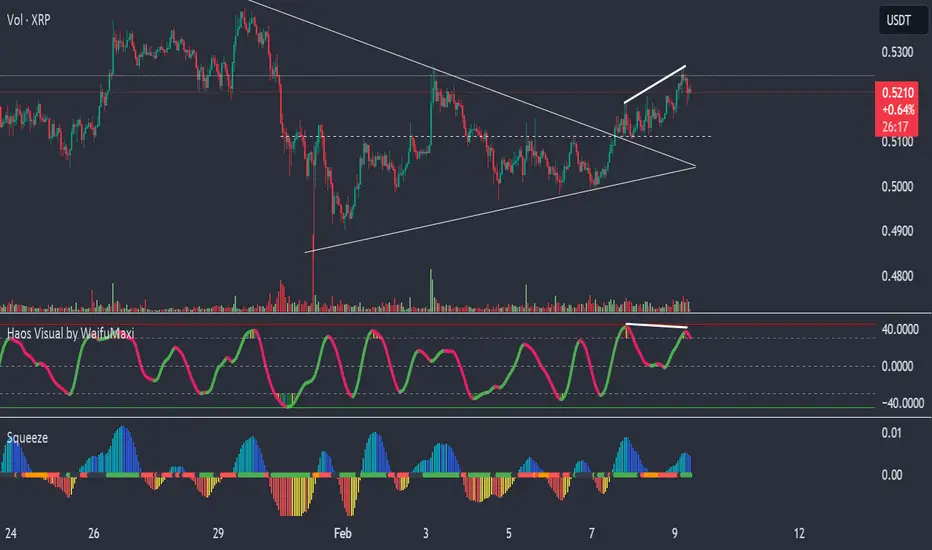
"Ripple Faces Crucial Resistance, Potential Breakout Looms"Ripple (XRP) Navigates Pennant Formation: Critical Juncture Signals Potential Breakout
Ripple's XRP, a cryptocurrency known for its unique utility in cross-border payments, is currently at a pivotal moment in its price action. On the shorter time frame, XRP is exhibiting a compression pattern resembling a pennant formation, suggesting an imminent breakout. However, the rejection off the downward resistance within this pattern is signaling caution among traders.
A pennant formation is a technical chart pattern characterized by converging trend lines, forming a triangular shape resembling a pennant. Typically, this pattern occurs after a strong price movement and indicates a period of consolidation before a potential continuation of the prior trend.
At present, XRP is witnessing a compression within this pennant formation, with price action oscillating between the converging trend lines. The rejection off the downward resistance line is a crucial development to note, as it indicates selling pressure at higher levels.
For traders and investors, this is a key point in time to closely monitor the XRP chart. The rejection off the downward resistance suggests that XRP may be poised for a breakout to the downside. If this scenario unfolds, the coin could potentially test the 31 cents support level once again.
A breakdown below the bottom trend line of the pennant could result in a significant decline, possibly leading to a 30 percent loss from current levels. Such a move would warrant careful risk management and could trigger further selling pressure among investors.
However, it's important to consider the alternative scenario. If XRP manages to hold the lower boundary of the pennant and subsequently breaks above the red expanding range resistance, it could signal a bullish breakout. In this case, traders may look to play the breakout, anticipating a continuation of the prior uptrend.
As always, trading cryptocurrencies involves inherent risks, and it's essential for traders to conduct thorough analysis and implement appropriate risk management strategies. While the pennant formation presents a potential opportunity for traders, it also carries the risk of a downside breakout. Therefore, exercising caution and closely monitoring price action is paramount in navigating these uncertain market conditions.

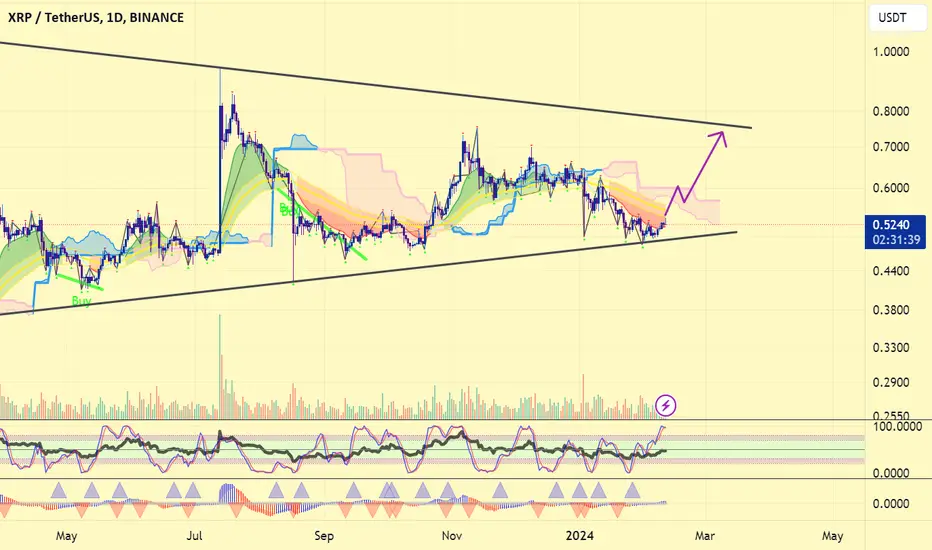
XRP - 20.000% RallyHello Traders, welcome to today's analysis of XRP.
--------
Explanation of my video analysis:
After XRP has been trading in a triangle formation for over four years, we saw an expected breakout in 2017 followed by a rally of +25.000%. Exactly five years ago XRP then started forming a similar triangle (continuation) pattern and if we see a breakout towards the upside and a break above the resistance mentioned in the analysis, we could maybe see a similar rally.
--------
I will only take a trade if all the rules of my strategy are satisfied.
Let me know in the comment section below if you have any questions.
Keep your long term vision.

The XRP hourly chart showing a bearish divergence.The crypto market as a whole has been moving up nicely recently. XRP has gained some ground, even though it hasn't moved near as much as most other cryptos. It is now showing a bearish divergence on the 1 hour chart, which could be a sign we're going to see a pullback.
I'd recommend caution here regardless of the cryptos you hold, just because we've seen seen many of them move significantly as of recent. Keep your eye on Bitcoin to be your primary indicator.
Good luck, and always use a stop loss.
💎 BTC/USDT - $47,000 Reached , What's Next ? (READ THE CAPTION) Bitcoin reached $47,700 ! As you can see, according to our expectation, Bitcoin finally managed to start growing from $42,000 and hit all the targets we had set for it! The price has already reached its highest price in a month and we have to see how the price will react to this important supply range (from $47,700 to $49,000)! The demand ranges are $44,900 to $45,500, $42,800 to $43,300 and $38,500 to $39,800 respectively! In case of an upward trend, its mid-term targets are $50,400 and $52,400, respectively!
The Main Analysis :
Please support me with your likes and comments to motivate me to share more analysis with you and share your opinion about the possible trend of this chart with me !
Best Regards , Arman Shaban
Ripple can break resistance level, make retest and continue growHello traders, I want share with you my opinion about Ripple. Observing the chart, we can see that the price a not long time ago started to trades in an upward channel, where it first declined to the support line and then continued to move up in the channel. XRP reached a resistance level, which coincided with the seller zone and soon broke it, after which the price made little correction and later rose to the resistance line of the upward channel. Next, the price turned around and made a strong downward impulse to support line of the triangle, thereby exiting from the channel and breaking two levels - 0.5265 and 0.5010. But soon, Ripple turned around again and in a short time rose back to the resistance line, breaking the 0.5010 support level, which coincided with the buyer zone. Then it made a correction to this level and some time traded near, after which the price rebounded and made impulse up to the resistance level, thereby exiting from the triangle. Now Ripple trades near the 0.5265 level and I think that price can correct a little and then rise to the resistance level, and try to break it. After breaks, Ripple will make retest and continue to move up. For this case, I set two targets, the first target at the 0.5265 resistance level, and the second - at the 0.5365 level. Please share this idea with your friends and click Boost 🚀

i thought id be happy with $20 XRP, im adding another 0fib channels, cyclic lines plus fibonacci circles - who would of thought about this powerful combo.
alot is pointing towards a massive xrp movement soon:
- corrective fib circle
- fib channel support
- cyclic timeline balance
...its positioned for 2024 to moon
like i said i thought $20 would be a nice pump, if retail jumps in with the same vengeance as 2017 then this could absolutely rocket into triple digits.
expansion from a 6 year consolidation will absolutely melt faces

Bullish divergence detected in the XRP chart.XRP is exhibiting a very nice bullish divergence on the daily chart.
HODL!

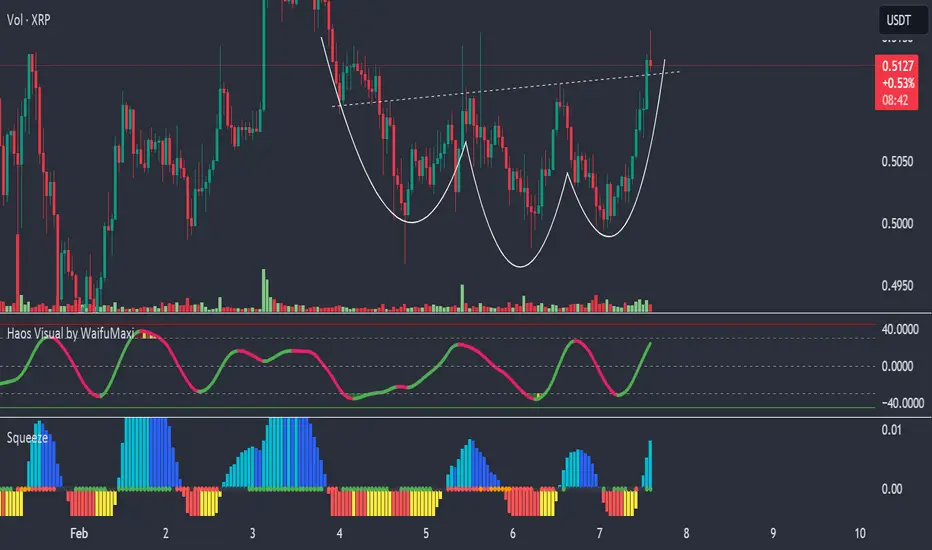
A nice inverse head & shoulders pattern has formed in XRP.XRP is arguably the most hated crypto in the space right now, but it's forming a very nice inverse head & shoulders pattern on the hourly chart, and has just crossed the neck line. We could see a really nice rally right here if it holds above that neckline, if so, it may pull back to it, then bounce off it like a trampoline.
Other cryptos have been having nice rallies today, I think XRP might get it on a little of the action today.
Good luck, and always use a stop loss.