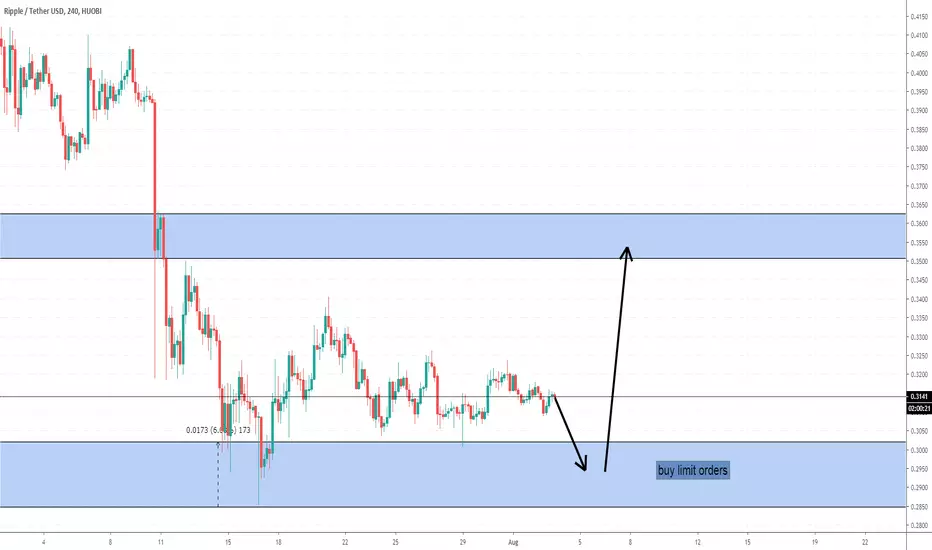
ripple forecasthere is our ripple bank level i will put my buy limit orders in the blue zone and wait to our targets hit
Rippleforecast
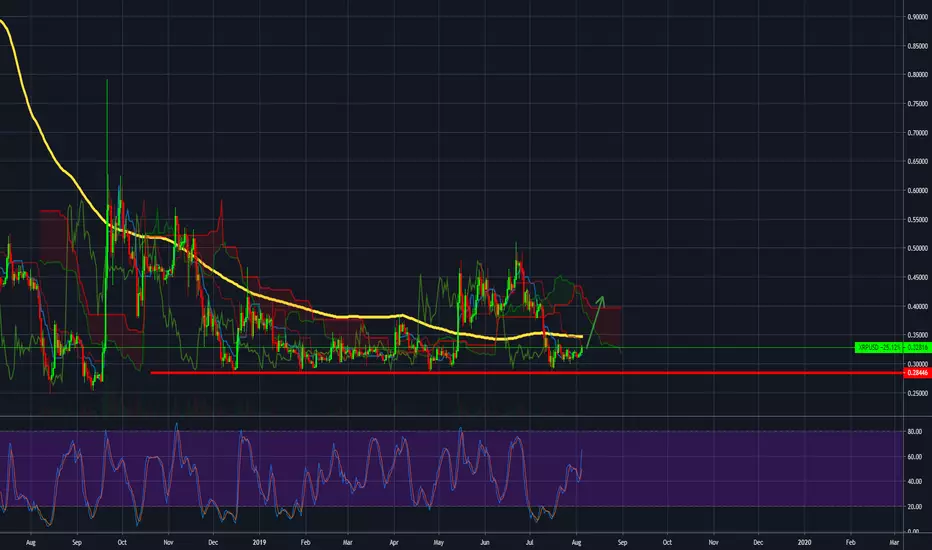
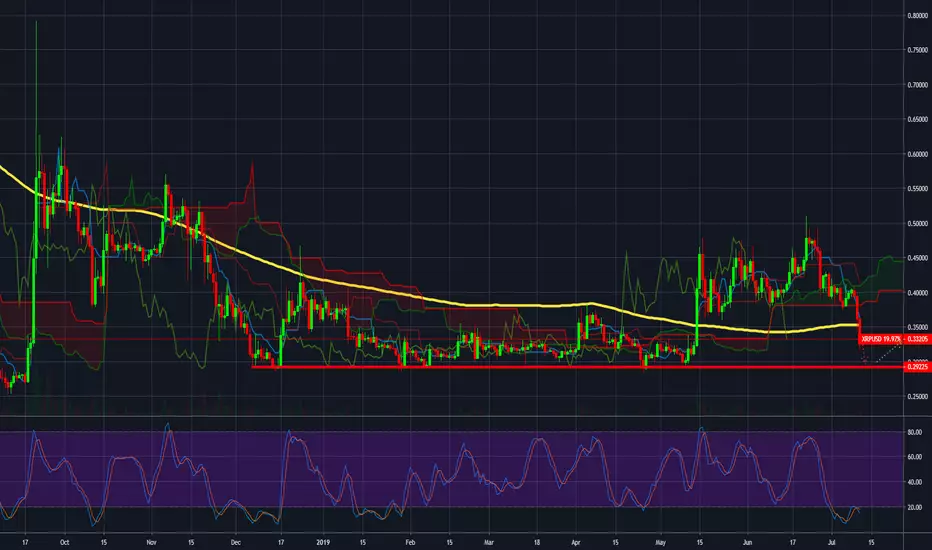
#Ripple#XRPUSD, The chances of increases are only going downThe Ripple presents a real weakness, not tracking the movements of bitcoin and all the technical data is strictly bearish.
Still, we recommend buying with Stop loss in the $ 0.28 support area
Signal Risk Level 4/5

#Ripple#XRPUSD, Strategic price...The Ripple is strongly supported at 0.28,
Right now the trend is very positive about the other currencies like Bitcoin and Ethereum which it usually influences.
The stochastic daily graph in a bullish position.
The Ichimoku is still in bear mode, and as long as there are no serious increases it will remain that way.
We recommend buying with Stop loss just below the support area.
Target: $ 0.35
XRP: This is what will happen should BTC hit new ATHs this yearI had previously drawn scenarios where BTC would take the "normal" route that we all know, where we'd see the All time high, sometime after the bitcoin halving.
But because this time BTC is half a year faster in the cycle than back in 2015/16, we would see the ATH already by late 2020, or early 2021.
However, as I posted previously, if BTC decides to do the gold fractal, and just continues pumping, this of course would mean in turn that XRP and the other altcoins would
also start pumping earlier.
BTC might reach the top BEFORE the halving in 2020, and it might become a "sell the news" event, where unexpectedly we'll see a price decline afterwards.
Should this happen, then BTC will break out at some point later this year.
According to the previous XRPBTC structure, we will see a new ATH in XRPBTC this time, which would be logical, since every new altcoin season, the alts gain more
versus BTC. BTC will see new dominance lows in the next altcoin rally.
Therefore a top of 0.0004 is likely for XRP. Now, if BTC goes to 100k ATH, it would translate to an XRP price of 40 USD.
We'll just have to wait and see how fast BTC is, to estimate the possible top. For BTC to reach 100k, it must not be faster than mid 2020 to reach the ATH, around the time of halving.
Should it be much faster, then the peak will also be lower.
We can experiment around with a few scenarios and come to the conclusion that the XRPUSD top will be anywhere from 15-20 USD for BTC ATH around 50-60k, up tp 30-40 USD for BTC ATH around 100k.
Let's see what BTC will do, and XRP will follow. The altcoins do not have a life of their own, please never forget that BTC IS KING. The alts are little sheep that only follow BTC. Therefore, we must keep a
close watch on BTCUSD and XRPBTC in order to determine the XRPUSD top.

Ripple has completed shark | Upto 77% profit possibilityThe priceline has completed the shark pattern and entered in potential reversal zone.
We already have a 2nd pivot support within PRZ area from here the price action will take bullish divergence insha Allah.
The stochastic is in oversold zone 1st time after feb 2019.
The targets are:
Buy between: $0.3049 to $0.25697
Sell between: $0.35363 to $0.45585
Regards,
Atif Akbar (moon333)

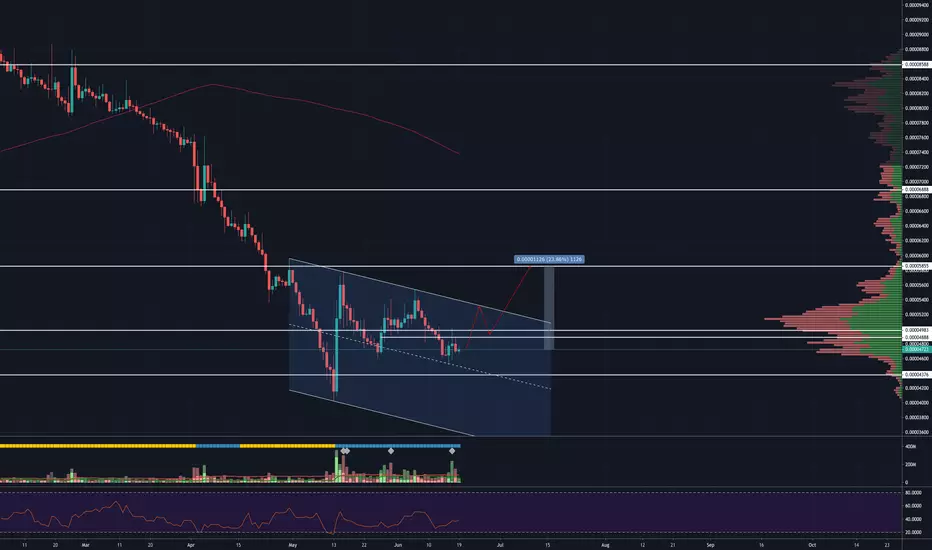
Ripple will do an intermediate move soonXRPBTC is falling as I predicted here:
Now, many are waiting for the big ripple breakout.
When will XRP finally start to follow BTC?
Well, if we look at the volume profile and the big falling (bullish) wedge,
we see that there are basically two very important support zones.
The 1st one is reight now at this very level, at 2900 sats.
If we don't get a strong bounce here, I think XRPBTC will further decline to the next very strong support are, which is historic support.
The falling wedge would thus end in early 2020 at around 1000-1300 sats, which is very strong support.
I think that then we will finally see XRP rallying. The likelihood for a strong rally now is quite low imho, but not impossible.
We might get a smaller intermediate rallly up the the resistance of the falling wedge though. But breaking through that resistance: Not too likely imho.
But longterm, 2020, XRP will be pretty awesome.

XRP Ripple Bounce Coming!Ripple is very over sold on the RSI everytime it has hit around 30 the Bulls have gained momentum and have given this Crypto a good up swing!

Negative trend, again? #XRPUSD #RippleIt is important that the daily candle finishes above the moving average 200 (the yellow line in the graph above)
The interesting and negative thing about this case is that the Ripple did not rise as Bitcoin rose but on the other hand it is falling because Bitcoin is falling.
The Ripple dropped below the Ichimoku cloud which is a bearish sign.
Target: 0.29
Ripple XRP wedge updateContrary to some uber ripple shills, I personally don't really like ripple. It's centralized, and stands for everything which I basically don't like.
However, I can't deny the brutal pumping potential behind this coin. In the past, it always was one of the best performing coins.
However, I am pretty convinved that it will NOT pump in 2019.
2019 is accumulation year, and many are disappointed the ripple didn't grow much, now that BTC went from 3k to 13k. Ripple in that same time barely moved.
Why?
Well, if we look into the past, it did EXACTLY the same in 2016-2017.
While BTC was already rising like crazy, it didn't move a lot. Instead, it was building a wedge from which it then would launch, over a full year after BTC had already started rising.
I think it will do the same again. Doing a wedge, like the one I drew, and then when most people are frustrated, and sold their XRP because it just won't rise, then BAAMMMM, it will start in
early 2020 to do a brutal rally.
Now, how high will it go?
If the 2017-18 rally was to repeat exactly like that, we'd see a 200 USD ripple. Now, before you brutally flame me as an XRP shill, let me say: I believe this to be unrealistic.
It will entirely depend on how high BTC will go.
If BTC goes to 100k, I think Ripple realistically would go to 30 USD, with luck 50.
If however BTC goes higher than we all thought, say 300k-500k, then indeed we could see 100-200 USD ripple.
But again, this is an ultra optimistic best case scenario, and we should not trade according to best cases, but more according to optimistic estimations.
I've bought quite a lot of ripple in the last months and I will add more, now that BTC might dip a little, XRP could hit 30 cents again. I will add to my longterm position when that happens and hodl XRP for 1+ year.
Because as Vespasian said: Money doesn't stink :)

$XRPUSD sees dbl bottom and parabolic upswing$XRPUSD is long overdue for a correction and we are seeing bullish divergence making an entry for a quick short position looking better with volume confirmation to follow. Trade set at neutral as it is too soon to tell for a long position could unfold. Time will tell.
Stop loss is present. Trade carefully. Will update with more info later.
Disclaimer
This is not financial advise nor should be regarded as such. Always invest carefully and make your own decisions with your own money. Have a great weekend.

XRP possible move back to channel topXRP looks poised to make a run to that channel top resistance
If it can find support after breaking above supply here, we could see a channel break and move higher
XRPUSD Forecast Price/Short data analysis $xrpusdHaven't really been looking at Crypto lately due to other obligations but a friend of mine asked my opinion on XRP and if I thought it was entering a new Bull market soon considering BTC has hit 9400.
Drew this out real quick and thought it was interesting enough to save so I can remember what I did. Explanations are on the chart.
Opinion: Currently no signal to short or buy.
Note: Short data on the 1 minute is a great indicator of whether or not price is moving due to organic buying or a short squeeze, dont short parabolic Alt-coins while it's Shorts are increasing.

XRP/USD - Will the bulls take charge? A higher time frame look.What do we have here?
Looking at XRP on the weekly. First thing that jumps out to me is location.
Location looks great. Investment grade. Throughout the later half of 2018 and in to 2019 we based right off the original market structure breakout level at $0.2999 in 2017.
Certainly not in shorting location on this weekly chart.
The 2018 lows at ~$.0.24 seem to be holding as strong support. Makes for a nice stop level if you're taking long shots.
Volume profile indicates the majority of 'business that's been done' on XRP was right around 30 cents - basically where we've been trading for the last 10 months. Nice sideways consolidation / accumulation action in price action corresponding with those levels. To me this says, "The majority of bag holders who bought and never sold the last bull market are exchanging their XRP for USD at around $0.30." Haha. Kind of cheeky, I get it.
You can see we're finding resistance at the downtrend line drawn from the 4/20/18 counter trend rally. Before I think about adding to my position here I need to see this downtrend line traded through with a market structure breakout on the opposite side. We're at least a few weeks out from seeing that.
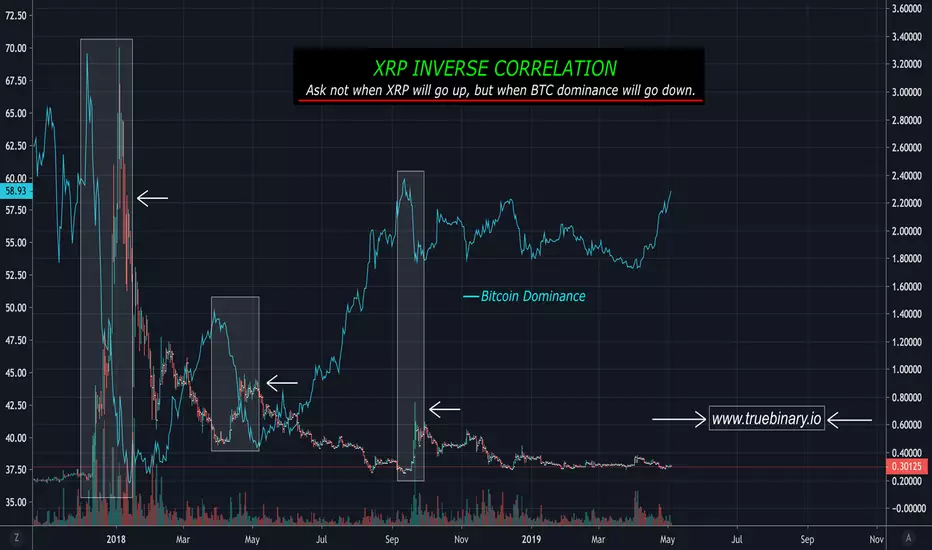
I've talked before about the inverse correlation we see between CRYPTOCAP:BTC.D and XRP. It's especially pronounced when you look at altcoins vs. BTC, however, it's still valid comparing vs. USD.
Titled "BTC Dominance as Proxy for Altcoin Sentiment," you can see that chart here:
That being said, we got a nice big M top come in within BTC Dominance. I've found this to be an extremely powerful bullish signal for the other coins like XRP.
Makes total sense, right? Money is flowing out of BTC, where's it going? Things like XRP.
I do like the similarities between the market we were seeing in the later half of 2017 to what we're seeing now. BTC lead the market, you could see its dominance rising aggressively day by day, until eventually BTC stalled out up top, traded in a range, and all the money started pouring in to the altcoins.
I'm seeing very similar action in today's market. BTC trading range bound between ~$7.5k - ~$9.1k, BTC dominance starting to break down, alts starting to perk up and put in nice market structure bottoms. Looks to me like the perfect storm brewing for an altcoin rally over the next few weeks or months.
XRP/USD Internals
Not shown on this chart because there would just be too much information and it would look like a mess. Maybe I'll make another chart if you guys are keen to see how I identify confirmed divergence.
What I'll say is that there is confirmed bullish momentum divergence within the MACD.
We've been stupidly oversold for a hell of a long time - pretty much regardless of what kind of momentum oscillator you use. RSI, Williams %R, stochastics, whatever.
I'm seeing bullish volume breakouts expressed through On Balance Volume (OBV).
Put it all together and the internals are looking rock solid for a reversal.
As far as projections / profit targets go:
What sticks out to me is the confluence of harmonic levels lining up around $1.41.
- .382 fib retracement (drawn from 2018 top @ $3.30 down to 2018 low @ $0.24653)
- 1.618 fib extension (drawn from April '18 top @ $0.966 down to 2018 low @ $0.24653)
Very rarely do you see longer time frame harmonic levels line up this closely. In my experience when you see this it ought to be respected and paid close attention to.
Also very rarely do we see markets go down and never see at least a 38.2% retracement of the old highs. Myself and many harmonic traders alike use 38.2 as a "first stop target." First stop should imply that this isn't an aggressive profit target by any means.
XRP/USD Weekly Chart Summary
Is any of this making sense? I hope so.
Overall I think the technicals look great. Location, internals, market structure, intermarket-wise. Lots of independent reasons for a trade here.
Again, this doesn't mean go and market buy XRP. Follow your trading plan. (Do I have to keep saying this?)
Doesn't take a rocket scientist to examine the downside (break of those ~$0.24 lows) and the upside ($1.41 as 38.2%) retracement. Clearly there's a lopsided risk:reward ratio here.
High potential reward. Low downside risk.
That's what this game is all about. If you're the guy who likes these types of opportunities, maybe this is an idea to chew on.
FREE TRADING EDUCATION
We talk about all of this stuff every day Monday through Friday in our 100X Challenge livestreams on Youtube. You can check those out here.
If you want to learn the basics of technical analysis, risk management, setups, and the fundamental principles of profitable trading - Check out our Level 1 course.
We're giving it away for free right now (will sell for $2497) for Tradingview users to beta test over the next few weeks. Over 20 hours worth of content, brings you from the ground up and gets you analyzing charts like smart money.
Use discount code 'Tradingview' in the checkout.
- learn more and get a free course preview here.
Cheers,
FromTheEther
DISCLAIMER:
This is not an attempt to shill BITFINEX:XRPUSD BITSTAMP:XRPUSD BINANCE:XRPBTC in any way.
It's also not a buy recommendation.
Personally I'm not a big fan of the coin itself, but that doesn't stop me from trading it.
I'm a trader, not a financial advisor. By definition I look to identify and capitalize on high probability, high reward, low risk opportunities as often as possible. That's my job. That's what I do.
I'm just telling you what I'm seeing and trying to be as objective as possible while doing so.
OK! Talk to you soon.

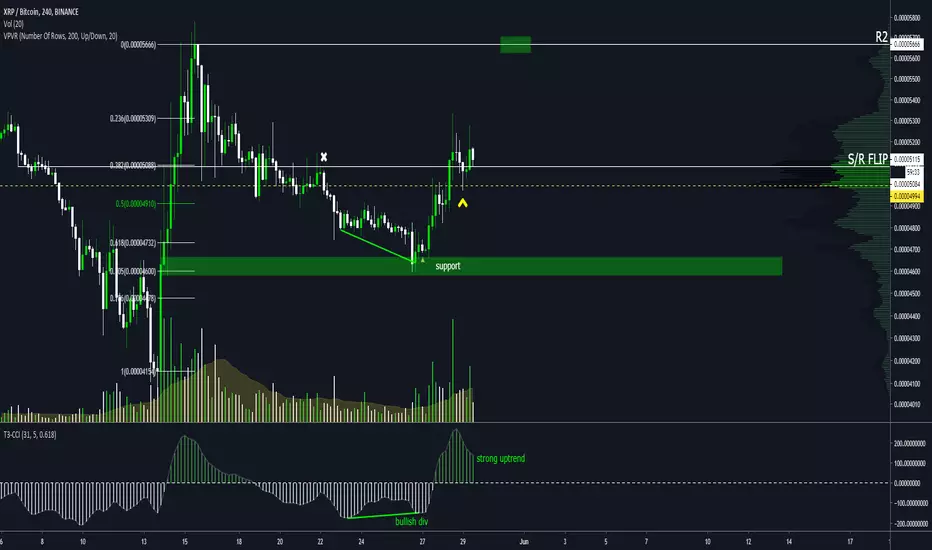
XRP LONG$XRP
I can't see a reason not to be bullish here. Broke back above the POC, flipped resistance into support. If we make another leg up, I'd look at R1/range high as resistance.
Ripple's Bollinger band squeeze marks big move incomingWe've not seen modest sized weekly candles on Ripple being squeezed this tight since 2016!! Big move incoming relatively soon. It doesn't mean buy now, it means to watch it closely, set alerts and take an interest. If crypto pulls back over the next 2-3 weeks Ripple may give up a little more giving a really nice entry point towards the bottom of the Bollinger Band.
Give uncertainty a kick in the pants!
Judd Armstrong
CryptoniteTV.com

Is that it? Is Ripple back to greatness? #XRPUSDWe should not be excited by the last rise and think that this is what we are going to return to the climax of the Ripple. Why not? Look at what happened to Ripple between the 17th and the 24th of September. The green candles were very big and it seemed that the Ripple was going to settle above the average moving 200 and then everything evaporated, the Ripple fell back, he lacked power or a real reason to go on.
I'm afraid it might happen now.
For all the speculators I suggest continuing to ride the rising wave because we are only at the beginning.
For all long term investors, I suggest waiting patiently for more positive signs.

Ripple Getting ReadyXRP has been underperforming compared to BTC for all of 2019. On April 2, a sudden sharp sell-off increased the decline to an even steeper rate than beforehand - this level of about 7540.5 sats is an excellent midpoint candidate and suggests we'll bottom soon with brief spikes possible below the 4358 sats level.
If this plays out I suspect it'll mark a turning point for many alts to outperform BTC for some time since BTC has had a good solid run lately without many alts following suit.

The Short of Ripple against Bitcoin continues...I think as bitcoin fades this week Ripple will suffer another blow. Our indicator indicates another drop in XRP - we saw a 20% drop in ripple against bitcon in the last month - while the 5% already accumulated may seem small - don't let looks deceive you.
Best regards,
Grey FX Empire
BTC Dominance as proxy for altcoin sentiment - XRP USD ExampleOne of the most useful relationships I've found is between altcoins like BITFINEX:XRPUSD and Bitcoin Dominance CRYPTOCAP:BTC.D
This is just a comparison of XRP/USD vs. BTC Dominance, but you can see this inverse correlation play out across the vast majority of heavily traded altcoins.
And if you set your alts vs. btc instead of alts vs. USD, the correlation shows up even clearer.
This can turn the question from 'When will Ripple go up?" or "When will X altcoin go up?" to "When will BTC Dominance break down?"
BTC dominance as an excellenet proxy for altcoin sentiment.
Want to learn the basics of technical analysis, risk management, and the fundamental principles of profitable trading? Check out our Level 1 course. Giving it away for free right now for Tradingview users to beta test over the next few weeks. Over 20 hours worth of content, brings you from the ground up and gets you analyzing charts like smart money.
Use discount code 'Tradingview' - learn more and get a free course preview here education.truebinary.io
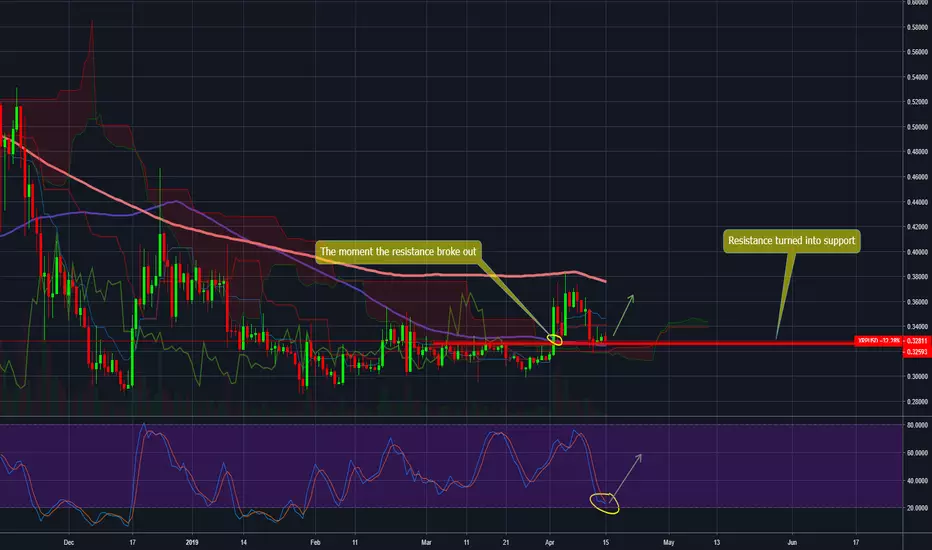
#Ripple The right moment to buy?Last week we saw a very large rise in the Rippel and a correction of this rise, what can we expect to continue? You can see that last week the Ripple broke the resistance and rose to the 200 moving average line and when it fell it stopped just in the resistance area that actually became support.
We think this is the right moment to open a long position with a relatively close stop at 0.3180
Entry Price: 0.3270
Stop loss: 0.3180
Take profit: 0.3680
RIPPLE POSSIBLE BUYAfter a logn bearish run in the higer timeframes finalyl we can see a bullish move on soem coins ,so right now i would like to try to go long as a very interesting set up is been presented here with some nice confirmations to aim for a 11% to 15% and those are :
1.Broke the major descendign weekly TL
2.Created a new high in the lower tiemframes
3.closed abvoe previous high and shadow
4. new bullish 1st structure formed and holding above the MP 61% fib

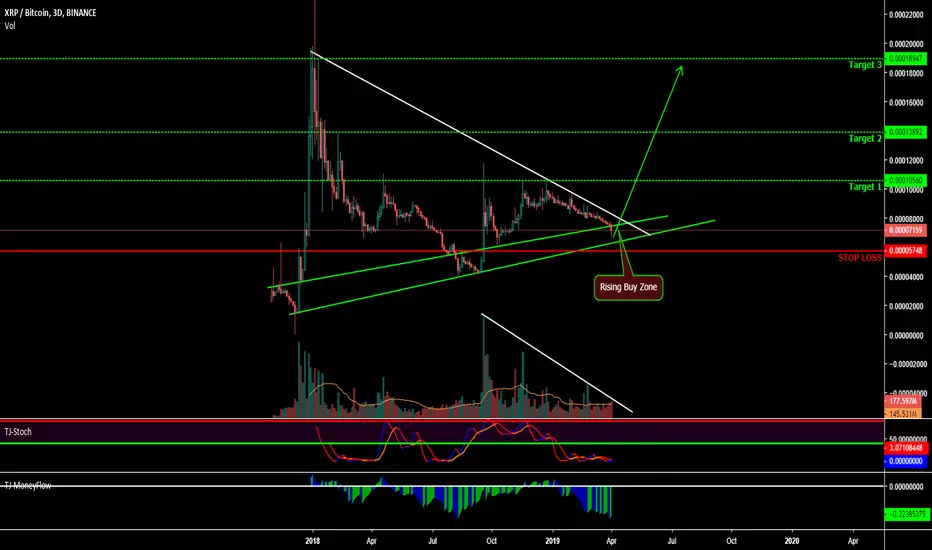
I don't like $XRP but I like free money - Day Trader ExplainsHello Lads and Ladies,
Welcome back to TJ's Trade Corner! Today, we will take a deeper look at XRP and what it might have in store for us.
Lets jump right into and look at the structure that we are seing right now. We are clerly seeing a rising support or what you would call a series of higher lows. This is indicating us already an important part of an uptrend. The specialty here is though, that we have two rising supports, which give us basically a rising buy zone in between each of them.
Next, we see a clear descending resistance for the whole chart, which in essence is a series of lower highs. These two finding combined give us triangle or wedge formation.
A wedge formation has a higher chance to break upwards than downwards.
One more really important thing that I see here is that we are trending down and basically forming a faling wedge since CHRISTMAS!! This is crazy and XRP had no extreme moves during that time. Not even right now where almost every imaginable coin started pumping. This could either mean that XRP is dead, or that we will see major action relatively soon.
So, we have a small downtrend (falling wedge) since Christmas, lets take a look at the volume!! Is the direction backed by the volume? No. Chart is descresing, volumeis descresing as well, meaning less and less people are incentivised to sell right now.
Having these bullish signs, I will open up a new trade based on that. Now, one of the most important things about that is the STOP LOSS. Where should it be?
A stop loss shoudl be at an invalidation point. Now, the invalidation point of the rising buy zone OR the possible double bottom?
Here, remember the rule, after trendlines are broken, we need to break horizontals next. Meaning by that, the STOP LOSS should be below the possible double bottom, while you still have buy orders below the rising buy zone.
This trade has been published before in my private learning group "ETG".
We are going over many observations and possible trades very frequently.
It is meant for only those who are really interested in becoming a self sufficient trader and learning about all the secrets of trading.
Should you be interested in ETG or the indicators I use, join my discord channel and say hi in chat, then I will give you a free trial for which you might be interested.
Like and Follow me and you will find the space interesting because I am a TA expert and professional day trader in crypto since 2012 that does daily updates and new posts about the hottest and most discussed coins.
Cheers TJ
Prove me wrongWhat is a descending triangle? The descending triangle is a bearish formation that usually forms during a downtrend as a continuation pattern. There are instances when descending triangles form as reversal patterns at the end of an uptrend, but they are typically continuation patterns, but just that´s not the case.
