XRP Daily Bullish DivergenceXRP has produced a daily bullish divergence, it is hard to see the lower low on the RSI, but trust me ITS THERE! This is the classic example of a oscillator , price bullish divergence.
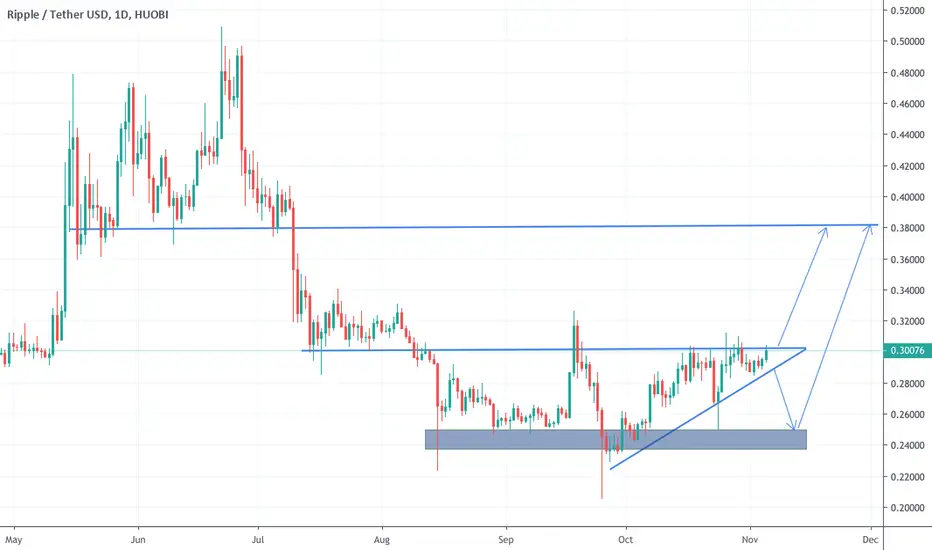
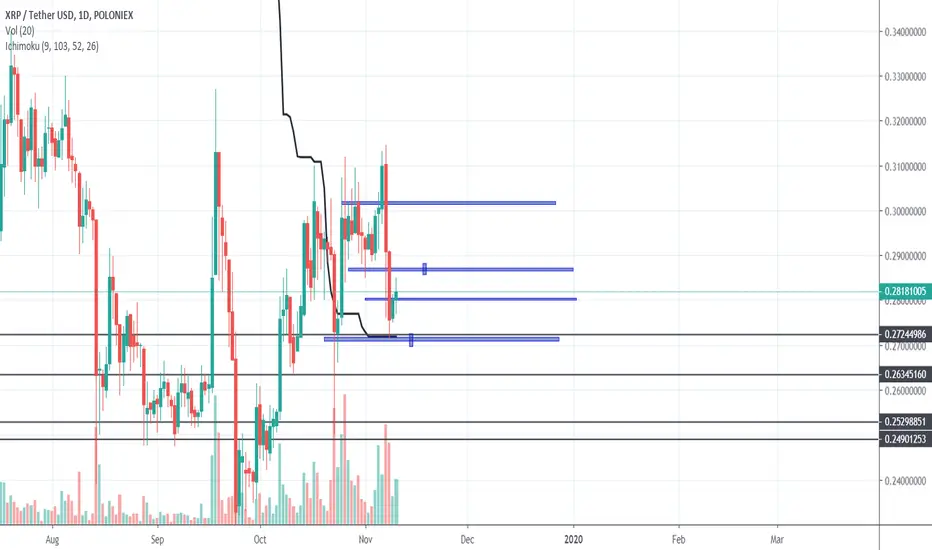
Rippleusdt

XRPUSD Is likely to breakout the key level resistanceTaking Bounce From The Support Of Wedge:
As we have seen earlier in previous post that on week chart the Ripple is moving in a falling wedge. The formation of this chart pattern was started in Aug 2018 and now after Aug 2018 the price action has hit the support of this wedge in Dec 2019 and with hitting at support of wedge the priceline had also hit the lower band of Bollinger bands and now it has taken a strong upwards bullish move and gained more than 61% value.
After placing volume profile indicator on the complete falling wedge pattern it is visible that trader’s interest was very low at the support of the wedge this was a very strong indication for this bullish move and we also had POC level of volume profile above the price action at $0.31 and this level is also a key level resistance for the Ripple as it is not broken out since Aug 2019.
Based on above signals I predicted in my previous article which I posted in Jan 2020 that the XRP will move up from this support of the wege to hit the key level resistance at $0.31.
Below is the chart from Jan 2020 when I posted my previous article:
Below is the current position of Ripple:
Simple Moving Averages | An Alligator’s Mouth Formation:
On daily chart the simple moving averages with time period of 25, 50, 100 and 200 are turning strong bullish by forming an alligator’s opened mouth the 25 SMA has crossed up all other SMAs an 50 SMA has also crossed up 100 SMA and now has come very close to 200 SMA to form a golden cross with it then only 100 SMA will be left to form a bull cross with 200 SMA once the this bull cross between 100 SMA and 200 SMA will be formed then we will have a complete alligator’s opened mouth formation by these moving averages like they formed in Jun 2019 and the price action gave more than 80% profit.
This time again the price action is expected to start a powerful bullish rally after an alligator’s opened mouth formation.
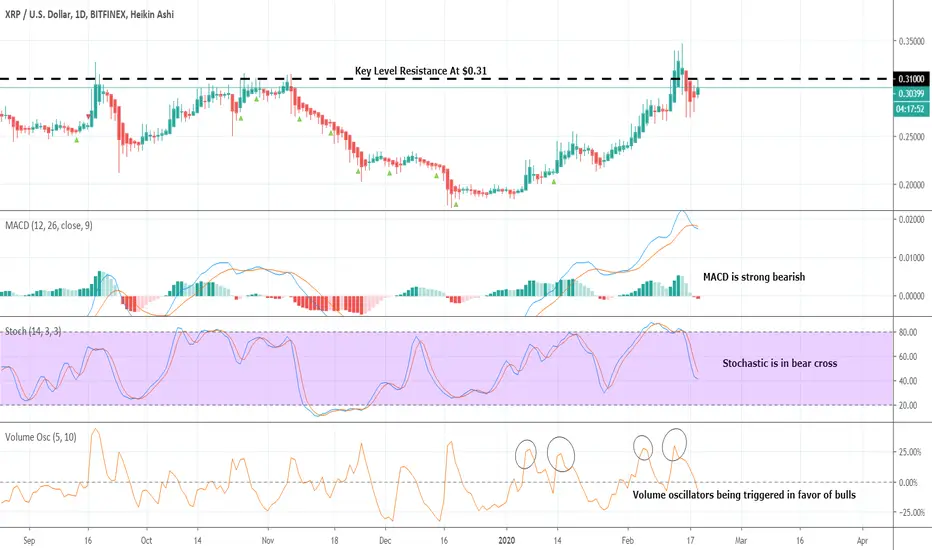
The Key Level Resistance And Indicators:
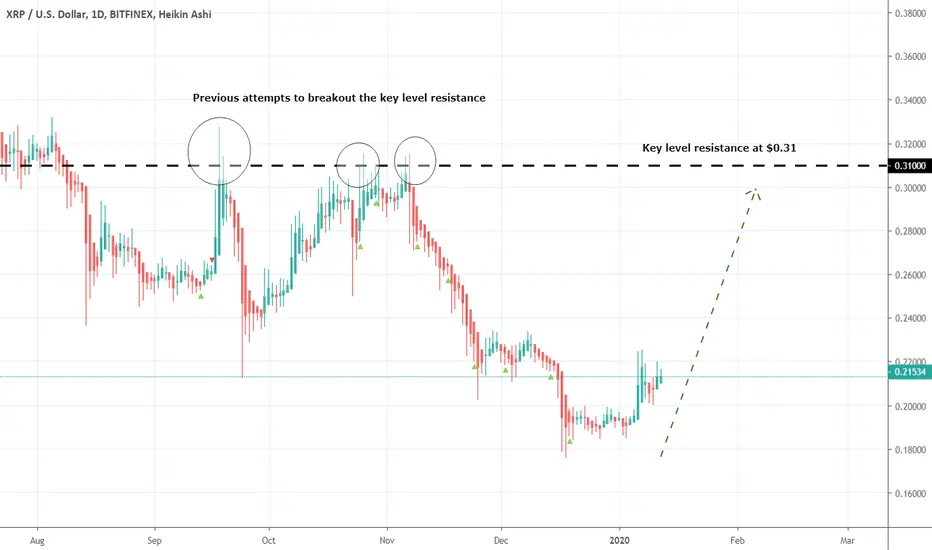
Since XRP has crossed down the price level $0.31 in Aug 2019 it could not cross up this price level again even after several attempts.
So now $0.31 became a key level resistance for Ripple which is not letting the price action of XRP move up since Aug 2019.
But this time the priceline is likely to breakout this resistance.
If we examine since Jan 2020 the volume oscillator has triggered four times in favor of bulls with strong values of 27.62% , 23.90% , 28.34 and this time the oscillation is most powerful with the value of 30.56% if this time again the volume oscillator will be triggered then price action may breakout the resistance coz we are very close to resistance this time.
The moving average convergence divergence is strong bearish and stochastic is in bear cross once the MACD turns weak bearish or stochastic gives bull cross then from here the breakout from the resistance will be confirmed.
After Price Correction A New Bullish Harmonic Pattern Formed:
From 13 to 16 Feb 2020 we have witnessed higher spikes than the resistance but no candle stick closed above this level and now the price action has a pullback for price correction rally and during this price correction on short term 4 hour chart the Ripple has formed bullish Shark pattern with all required dimensions as below:
After initial leg (X to A) the A to B leg is retraced between 0.382 to 0.618 Fibonacci and then B to C leg is projected between 1.13 to 1.618 of A to B leg's Fibonacci projection and final (C to D) leg is retraced between 0.886 to 1.13 Fibonacci.
And after completion of pattern the price line has a strong push from potential reversal zone and now it has entered in Fibonacci projection area of C to D leg between 0.382 to 0.786 Fibonacci.
But in my opinion this push will trigger more power full bullish divergence which will lead to breakout from the resistance.
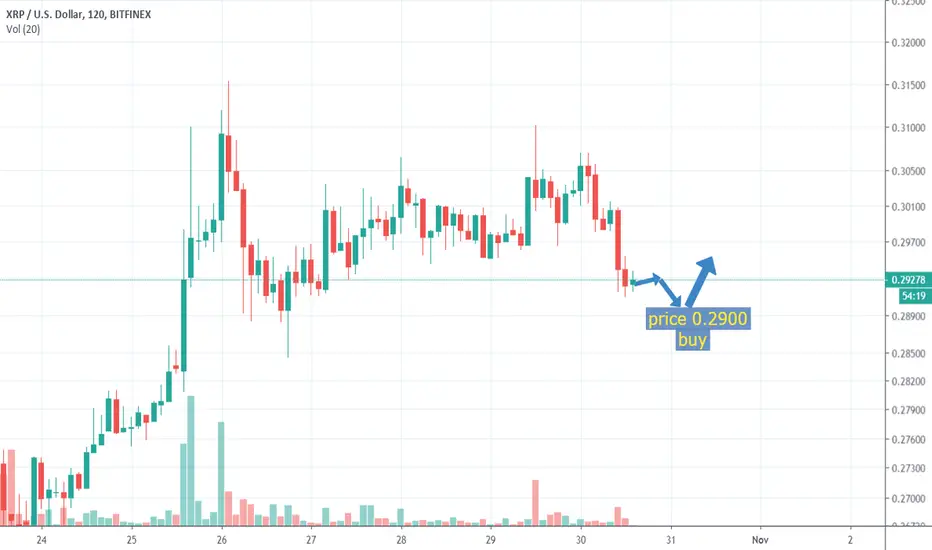
Ripple: Buying Trade Setup.Ripple: Buying Trade Setup.
Note: This is only for Educational purposes; this is not investment advice.

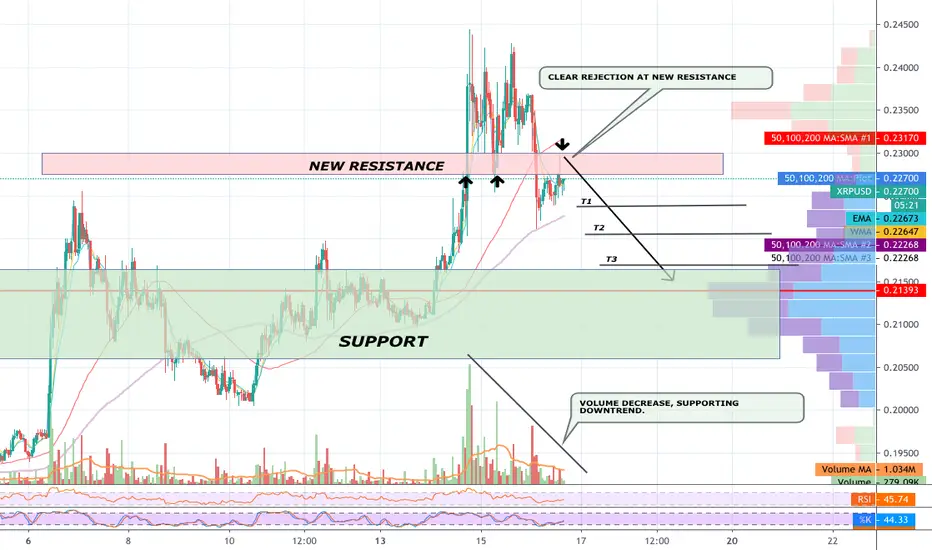
XRP/USD ANALYSIS (SHORT TERM BEAR MODE)XRP/USD
XRP has created a new resistance at $0.23, as you can see on the chart. There was a breakthrough upward, followed by one bounce off this new resistance, then a failed attempt followed on the third attempt. After breaking BELOW the resistance, XRP tried again to break thru and rejected. This is a clear sign, there will be a followed spike down. Volume is also supporting the downtrend as it continues to decrease after each pump. Look for XRP to fall first to recent low T1 at $.2225. If 100 MA breaks, look for T2 at $.22 and T3 at $.216. T3 is a front run of the local support and I do expect a reversal within this green support zone. Look for volume jump and a reversal wick up to flip from short to long.
Possible Short Entries: $.227
XRPUSD After 2 Years RSI Is Oversold Now Ready To Hit $0.31On week chart the Ripple is moving in a falling wedge. The formation of this chart pattern was started in Aug 2018 and now after Aug 2018 this is the price action has hit the support of this wedge in Dec 2019 and with hitting at support of wedge the priceline is also hitting the lower band of Bollinger bands.
Now we have some more positive developments in favor of bullish move after hitting the support.
As per bitfinex exchange data on week chart the relative strength index (RSI) is entered in oversold zone 1st time since after Sep 2017 and it has just tipped in oversold and indicators and oscillators are turning bullish. For example the Stochastic has given bull cross from oversold and moving average convergence divergence
Stochastic has given bull cross from oversold zone and moving average convergence divergence (MACD) has turned weak bearish from strong bearish and also likely to give bull cross very soon.
Since Aug 2019 the price action has broken down the $0.31 support now this support is become a key level resistance for the price action of XRP and sofar the priceline is not able to breakout this resistance even after several attempts.
Now we have an optimistic situation coz after more than 2 years the RSI on week chart has visited the oversold zone and sudden after this happened all indicators are turning bullish as we have seen earlier if this time the price action will be able to breakout this resistance level then we witness a real powerful bull rally which can lead 1st the price action to hit the previous high and if the previous high level will be broken out then a new highest price level can be achieved.
Regards,
Atif Akbar (moon333)
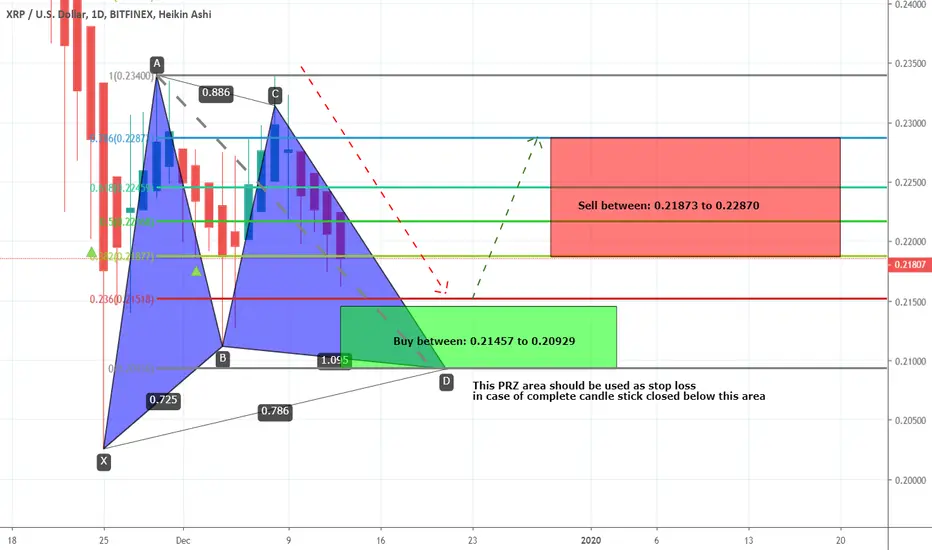
XRPUSD formed Gartley | A good long opportunityPrice action of XRP / US Dollar has formed a bullish Gartley and entered in potential reversal zone.
This PRZ area should be used as stop loss in case of complete candle stick closed below this area.
I have used Fibonacci sequence to set the targets:
Buy between: 0.21457 to 0.20929
Sell between: 0.21873 to 0.22870
Regards,
Atif Akbar (moon333)
#RIPPLE He Faces Strong Resistance Please share your opinion in the comments box and do not forget to press the like button
XRPUSD formed bullish BAT | A good long opportunityPriceline of world's 3rd largest cryptocurrency Ripple (XRP) has formed bullish BAT pattern and entered in potential reversal zone.
This PRZ area should be used as stop loss in case of complete candle stick closes below this zone.
Lets have a look on the move of price action to see how perfect this pattern is driven:
After initial leg (X to A) the A to B leg is retraced between 0.382 to 0.50 Fibonacci and then B to C leg is projected between 0.382 to 0.886 of A to B Fibonacci projection area and last leg (C to D) is retraced between 0.786 to 0.886 Fibonacci and now the price action is moving in potential reversal zone of this bullish BAT and now we can expect bullish divergence at any time which will lead the priceline between 0.382 to 0.786 Fibonacci projection of A to D leg , but if after this bullish divergence the candles sticks will be closed above the 0.786 Fibonacci projection area of A to D leg then it can also lead to the long term bullish move.
As per Fibonacci sequence method we can set our targets as below:
Buy between: $0.19305 to $0.19228
Sell between: $0.19490 to $0.19766
So this very short term 2hr chart would be a good long opportunity for XRP day traders.
Regards,
Atif Akbar (moon333)
The harmonic moves analysis involves hours of hard work and determination however the success of harmonic trading in fiat and cryptocurrencies is around 80% therefore it is always important that you follow any stop loss strategy while trading harmonic patterns I have also shared a stop loss idea in this article, the information in this article is for educational purpose only this is not an investment advice, I have tried my best to catch the harmonic moves as per predefined classical harmonic BAT pattern if you find any flaw or you have any suggestion feel free to share with me in comments section.

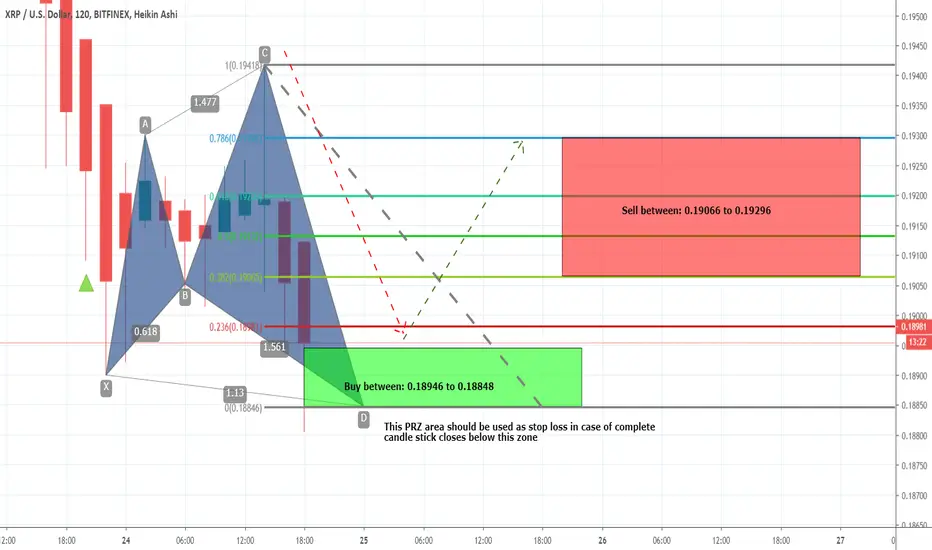
XRPUSD formed bullish Shark | A good long opportunityPriceline of XRP / Dollar cryptocurrency has formed a bullish Shark pattern and entered in potential reversal zone.
This PRZ area should be used as stop loss in case of complete candle stick closes below this zone.
I have used Fibonacci sequence to set the targets:
Buy between: 0.18946 to 0.18848
Sell between: 0.19066 to 0.19296
Regards,
Atif Akbar (moon333)
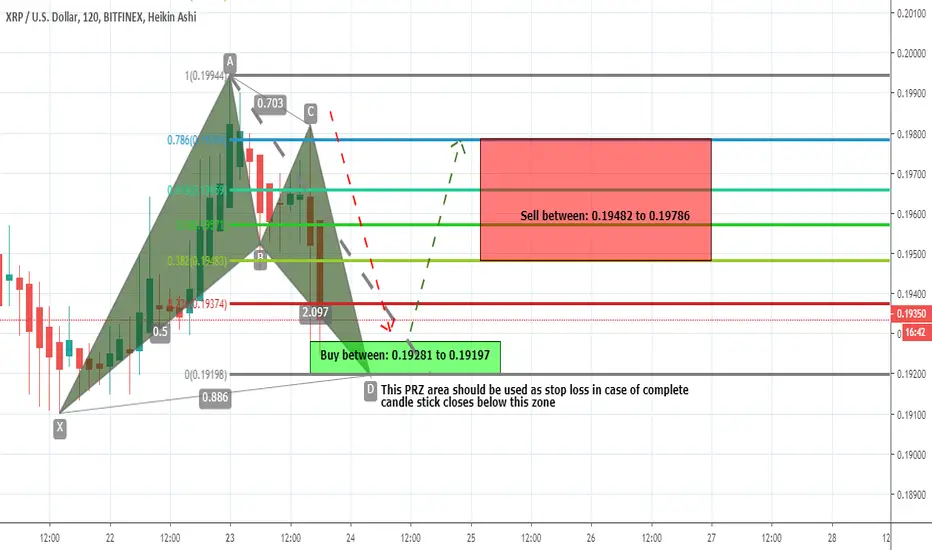
XRPUSD formed bullish BAT | A good long opportunityPriceline of XRP / Dollar cryptocurrency has formed a bullish BAT pattern and entered in potential reversal zone.
This PRZ area should be used as stop loss in case of complete candle stick closes below this zone.
I have used Fibonacci sequence to set the targets:
Buy between: 0.19281 to 0.19197
Sell between: 0.19482 to 0.19786
Regards,
Atif Akbar (moon333)
XRPUSD formed harmonic within harmonic | XRP mid term analysisIn my previous post:
We have seen that the price action of Ripple / US Dollar has formed a bullish Crab and so far the price action is still moving within the potential reversal zone of this pattern.
This time the priceline has formed a parallel channel within the potential reversal zone of this shark pattern and likely to form a 3rd bottom at the support of this channel:
The Indicators and Oscillators:
On daily chart the Relative Strength Index (RSI) has entered in oversold zone with the value of 29.45 this is the second time it is visiting the oversold within a month before this it was oversold with the value of 16.86 on 25 Nov 2019 but at that time the bollinger bands was moving steep down and this time the bollinger bands is squeezed and side ways which is a good indication.
On 25 Nov the moving average convergence divergence (MACD) was in bear cross and histogram was showing strong bearish trend and this time the MACD is in bull cross and histogram is showing weak bullish trend soon it can be changed to strong bullish trend.
The Stochastic is in bear cross and it may visit the oversold once more in the meanwhile the price action can move sideways.
Harmonic within harmonic:
Now withing this potential reversal zone of previous Crab pattern and in this channel the price action has formed another harmonic pattern and this time it is bullish Gartley pattern now lets see how this pattern is perfectly driven:
After intitial leg which is started from 25 Nov's candle stick the A to B leg is retraced between 0.618 to 0.786 then B to C leg is projected between 0.382 to 0.886 projection area of A to B leg (ignoring the spike) then sofar the C to D leg is retraced between 0.618 to 0.786 Fibonacci which is perfect as required for bullish Gartley and now we are in potential reversal zone of this gartley so on bigger pitcure we are in potential reversal zone of bullish Crab pattern where the price action has capacity to take almost 40% bullish move and on smaller picture the price action is in PRZ of bullish Gartley pattern with capacity to take bullish divergence upto 9 percent move.
Now according to both patterns we can set our buying and sell targets as below respectively:
The bigger Crab pattern:
Buy between: $0.23249 to $0.20982
Sell between: $0.25012 to $0.29287
The smaller Gartley pattern:
Buy between: 0.21457 to 0.20929
Sell between: 0.21873 to 0.22870
Regards,
Atif Akbar (moon333)

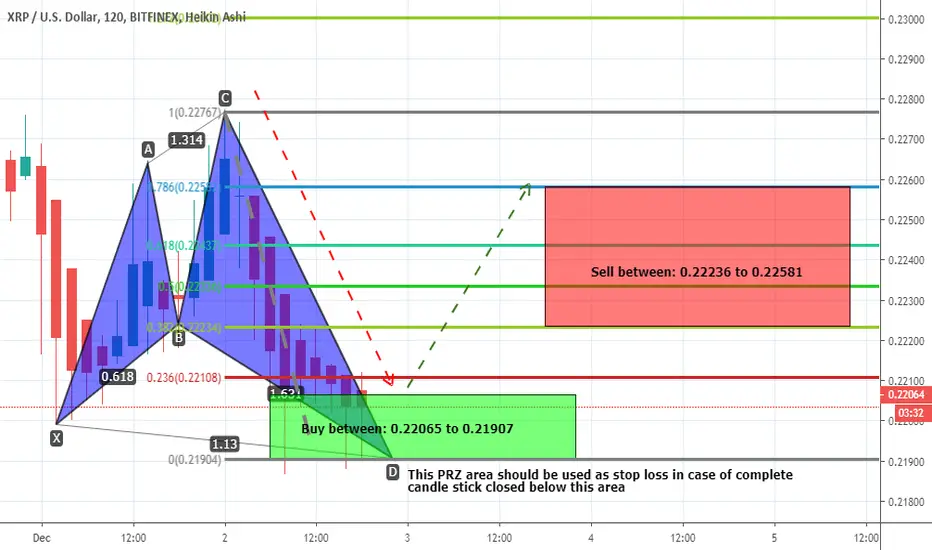
XRPUSD formed bullish Shark | A good long opportunityPrice action of XRP / US Dollar has formed a bullish Shark and entered in potential reversal zone.
This PRZ area should be used as stop loss in case of complete candle stick closed below this area.
I have used Fibonacci sequence to set the targets:
Buy between: 0.22065 to 0.21907
Sell between: 0.22236 to 0.22581
Regards,
Atif Akbar (moon333)
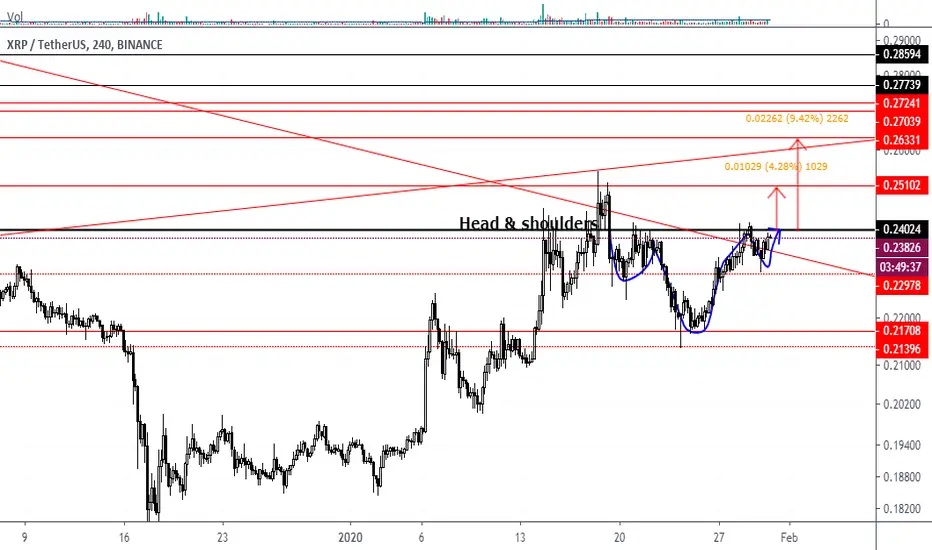
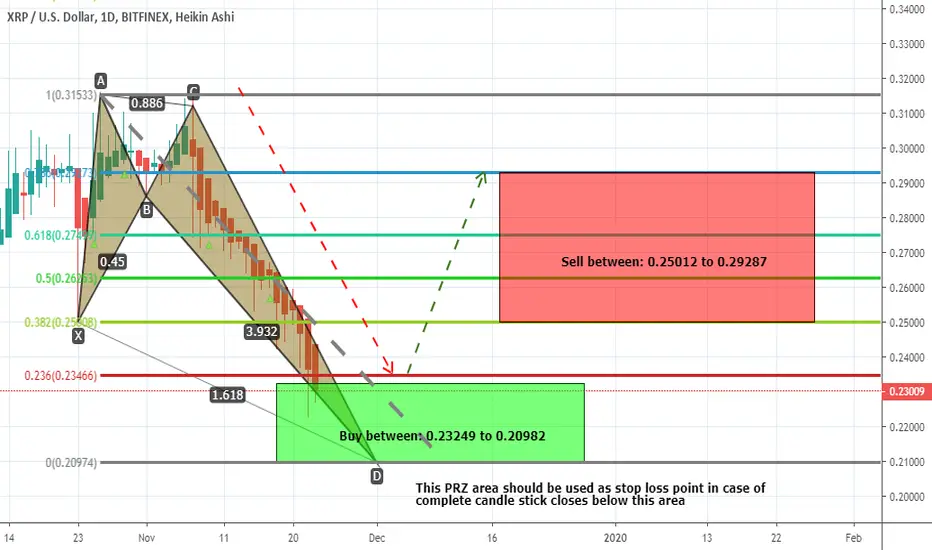
Ripple (XRP) Mid Term Analysis | XRP Has Formed Bullish CrabStarted moving in channel:
Since 3rd Nov 2019 on 4hr chart the price line of 3rd largest cryptocurrency Ripple had started moving in a down channel and on 7th Nov the price action crossed down the Basis of Bollinger bands and kept moving below the Basis in the meanwhile it was continuously hitting the lower bands of Bollinger bands.
At last on 25 Nov a large spike down beyond the lower band support of Bollinger bands hit the channel support which produced a bull bounced and after getting bounced from here the price action crossed up the Basis and also broke out the channel resistance on 27 Nov 2019 and now the Ripple is moving through a price correction period during this period the price action may retest the resistance of channel as support.
The oscillators and indicators:
We have received strong bullish signals upto 12hr chart but if we see on Day chart then it can be seen that the indicators and oscillators are just turning bullish lets have a look.
1st is we see the moving average convergence divergence (MACD) then it was strong bearish since 1st Nov in the meanwhile it has been fluctuating to weak bearish but that was only for a day but now it has turned weak bearish since last 5 days continuously.
The relative strength index is also in oversold zone and Stochastic has given bull cross from oversold zone moreover the price action is getting bounced from the lower bands of Bollinger bands these indications are quite sufficient for confirmation of trend changing from bearish to bullish.
The Harmonic Move:
Since 23 Oct 2019 the Ripple has started forming a harmonic bullish Crab pattern lets have a look how perfect pattern it can be as per text book information of bullish Crab.
After X to A (the initial leg) the B leg is retraced Upto 0.45 Fibonacci whereas per text book information of Crab we need the retracement of B leg between 0.382 to 0.618 Fibonacci and if we see the B to C leg then it should be projected between 0.382 to 0.886 Fibonacci projection of A to B leg and on chart there is little bit spike beyond the 0.886 Fibonacci but it can be ignored coz all other legs are driven perfectly as required for Crab.
Now if we see the movement of C to D leg then it should be retraced between 1.27 Fibonacci to 1.618 Fibonacci and on chart the final leg is driven perfect as required and this area from 1.27 to 1.618 Fibonacci is also the potential reversal zone of this bullish Crab pattern and we can take the long position between this area and we can set our sell targets between 0.382 Fibonacci to 0.786 Fibonacci projection of A to D leg, so the buying and sell targets can be as below:
Buy between: $0.23249 to $0.20982
Sell between: $0.25012 to $0.29287
So move has potential to give upto 39% profit but if the price action crosses up the 0.786 Fibonacci projection area and complete candle stick closes above that area then it can have more powerful bullish divergence from there and may start more powerful bull rally.
Regards,
Atif Akbar (moon333)

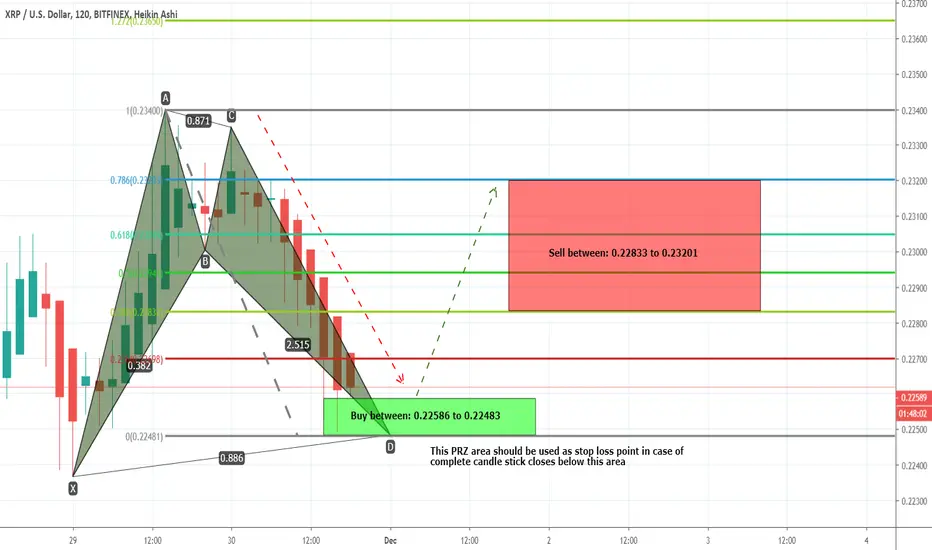
XRPUSD formed bullish BAT | A good long opportunityPriceline of XRP / US Dollar cryptocurrency has formed a bullish Crab pattern and entered in potential reversal zone.
This PRZ area should be used as stop loss point in case of complete candle stick closes below this area.
I have used Fibonacci sequence to set the targets:
Buy between: 0.22586 to 0.22483
Sell between: 0.22833 to 0.23201
Regards,
Atif Akbar (moon333)
XRPUSD formed bullish BAT | Upto 17.5% move expectedPriceline of XRP / US Dollar cryptocurrency has formed a bullish BAT pattern and entered in potential reversal zone.
This PRZ area should be used as stop loss point in case of complete candle stick closes below this area.
I have used Fibonacci sequence to set the targets:
Buy between: 0.26408 to 0.25756
Sell between: 0.27963 to 0.30293
Regards,
Atif Akbar (moon333)

XRPUSD formed bullish Crab | Upto 39% move expectedPriceline of XRP / US Dollar cryptocurrency has formed a bullish Crab pattern and entered in potential reversal zone.
This PRZ area should be used as stop loss point in case of complete candle stick closes below this area.
I have used Fibonacci sequence to set the targets:
Buy between: 0.23249 to 0.20982
Sell between: 0.25012 to 0.29287
Regards,
Atif Akbar (moon333)
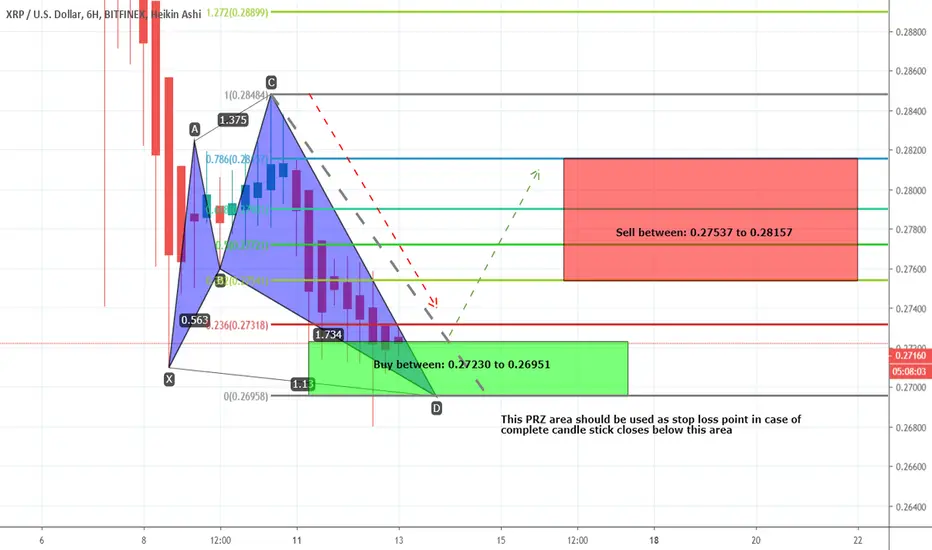
XRPUSD formed bullish Shark | A long opportunityPriceline of XRP / US Dollar cryptocurrency has formed a bullish Shark pattern and entered in potential reversal zone.
This PRZ area should be used as stop loss point in case of complete candle stick closes below this area.
I have used Fibonacci sequence to set the targets:
Buy between: 0.27230 to 0.26951
Sell between: 0.27537 to 0.28157
Regards,
Atif Akbar (moon333)
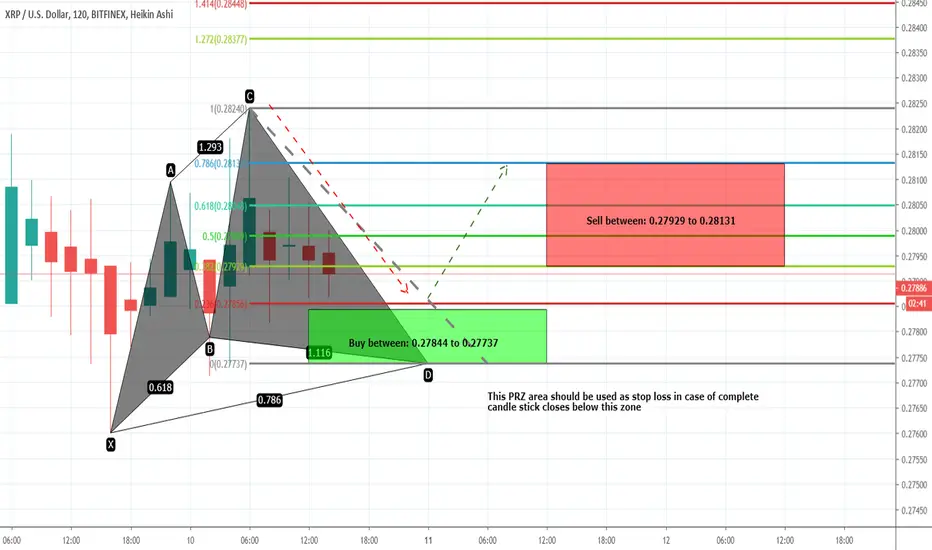
XRPUSD forming bullish Cypher | A good long opportunityPriceline of XRP / US Dollar cryptocurrency is forming bullish Cypher pattern and soon it will be entered in potential reversal zone.
This PRZ area should be used as stop loss in case of complete candle stick closes below this zone.
I have used Fibonacci sequence to set the targets:
Buy between: 0.27844 to 0.27737
Sell between: 0.27929 to 0.28131
Regards,
Atif Akbar (moon333)
XRPUSD forming bullish BAT | Upto 17% long opportunityPriceline of Ripple / US Dollar cryptocurrency is forming bullish BAT pattern and soon it will be entered in potential reversal zone.
This PRZ area should be used as stop loss point in case of complete candle stick closes below this area.
I have used Fibonacci sequence to set the targets:
Buy between: 0.26407 to 0.25755
Sell between: 0.27962 to 0.30304
Regards,
Atif Akbar (moon333)

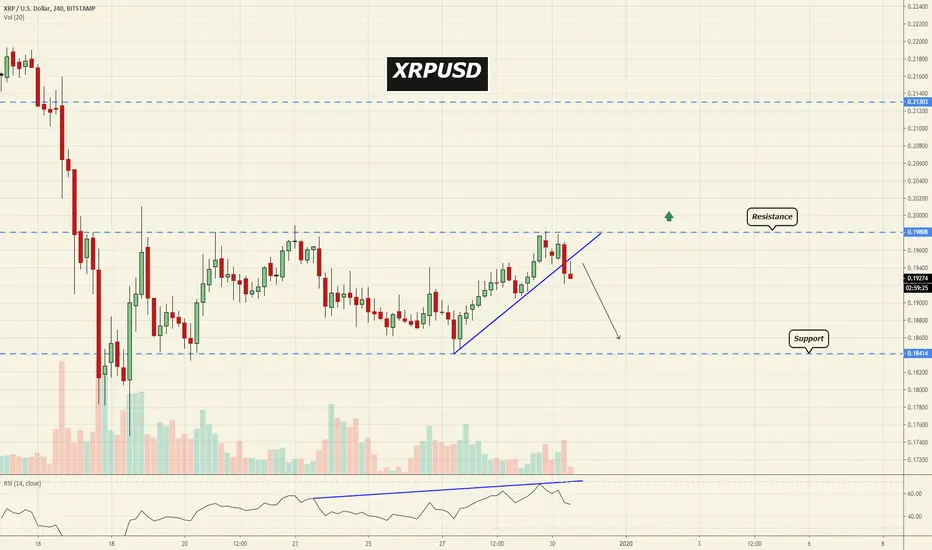
Ripple, more potential for buyers!Ripple is in strong sellers territory but if we look on a monthly time frame than we can see a lot more potential for buyers than sellers.. Of course price might came to the lowest support level and then bounced back to the higher levels.