Rippleusdt
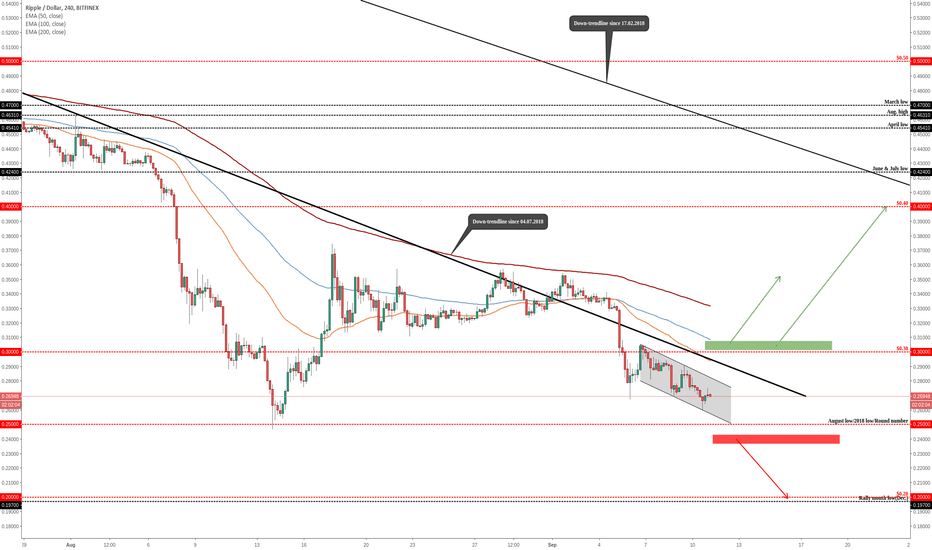
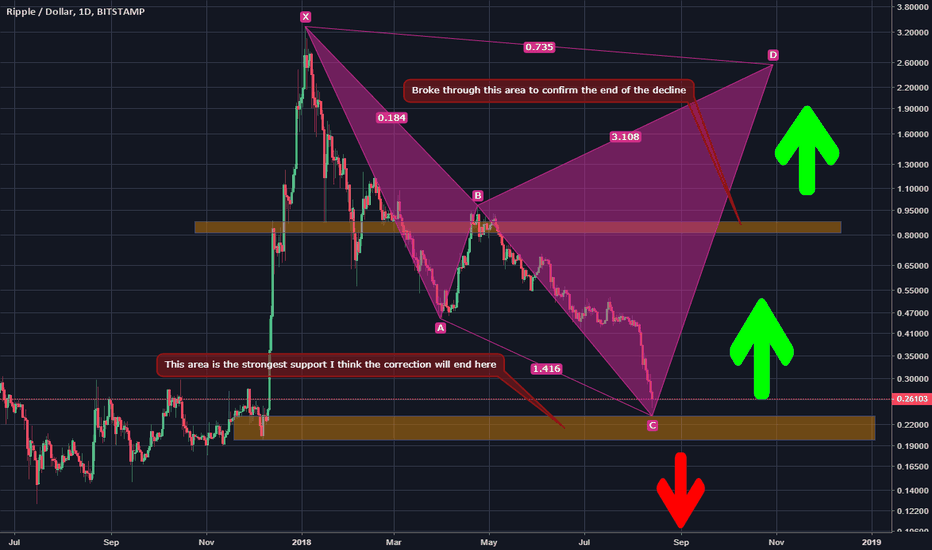
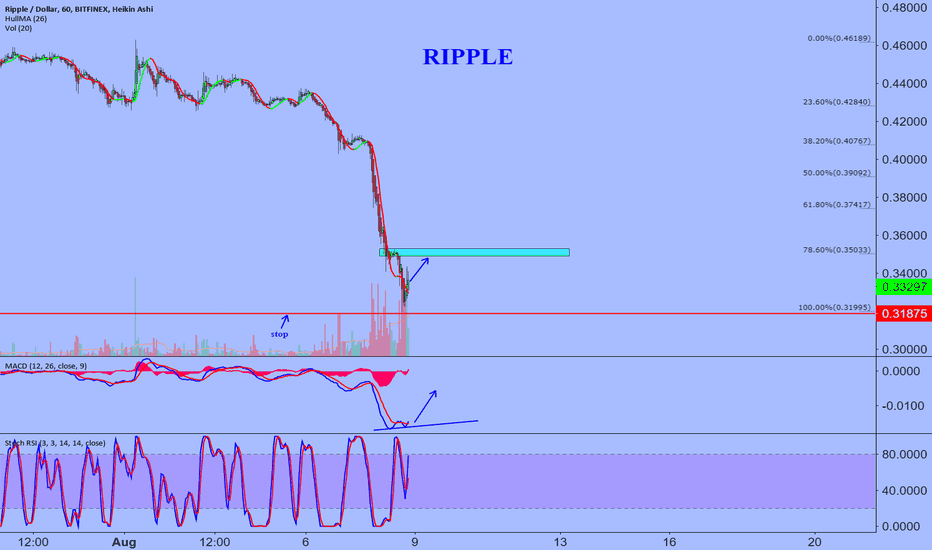
RIPPLE (XRP/USD) Possibly "Double Bottom"Currently, Ripple' trades between the $0.25 and $0.3 levels. The Short-term price structure is still lower highs and lower lows but the chart shows us that it slowly starts to slow down after the drop from $0.35. A first possible support is the August low/the 2018 low and the round number area $0.25. If it finds support from this area then we have also a bullish chart pattern called "Double bottom" and currently looks like the channel guide us into this area.
To enter the market from the mentioned area we have to watch what Bitcoin' do, if it also shows us some positive signs then definitely this is a place where Ripple' may bounce upwards.
Upwards target would be the trendline which is pulled from 04.07.18 wick. This trendline starts to work as a resistance and if we get a candle close above the trendline and above the round number $0.3, then we have an almost free ride to the $0.35 or $0.4, depends how healthy the market is.
To confirm bearishness then if we get a candle close (at least four-hour) below the August low which matching almost exactly with round number $0.25 then this is our confirmation and we can be almost certain that XRP' could drop as low as $0.2. There is the rally month low (December low), historically nothing more and the psychological number. The rally month low - last year December rally started from this area! So, if we drop below the $0.25 next stop would be around $0.2.
Hopefully, those level and this analysis helped You out a little bit to confirm Your own analysis!
Please, don't forget to hit the LIKE button to support us!
Best regards!
XRPBTC: Can XRP Prove itself?Hi All,
Hope all your trades are going well.
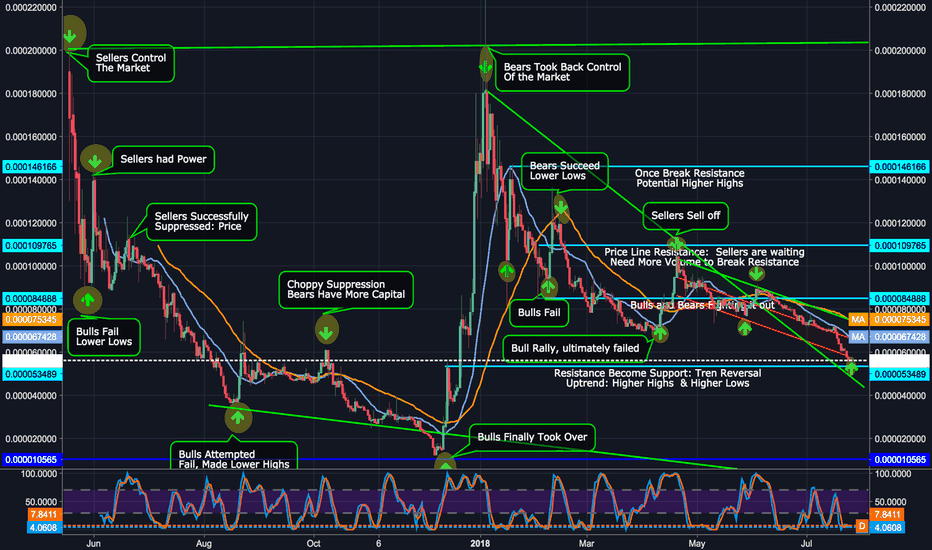
It's all in the chart.
RSI: Shows Oversold
Probability: Uptrend Reversal, depending on BTC trend.
Keep in Mind when trading: Not to be greedy: Use Trailing Stop Loss...
3-5 Bar Declines: it's an indicator to - Buy
3-5 Bar Increase: it's an indicator to - Sell
Hope this chart was helpful to you all. If you all have questions feel free to ask or comment in the comment section below.
Be sure to Follow me and like this post if it was helpful, and thank you all...
Like the Phoenix we will rise from the ashes...
Happy trading People...
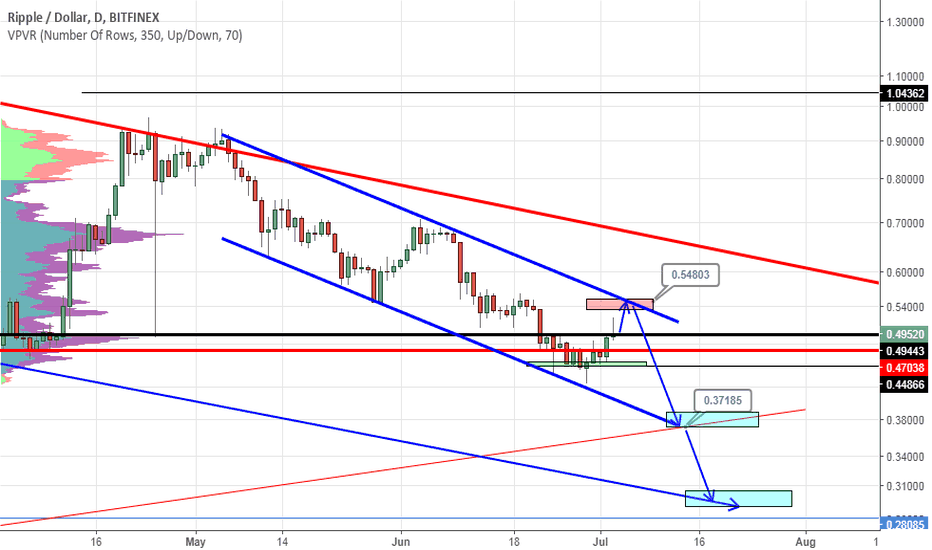
XRP. I do not believe in the global long!Now in the market there is a rollback after a long-running down trend. But are there any facts that can show us that further will be a strong upward movement? Especially, Ripple is relatively weak with respect to other coins.
I see a good opportunity to get into shorts at 0.54-0.55 $ with global targets of $ 0.37 and $ 0.29.
The previous idea of "trouble for investors XRP part 2" has not worked out yet. But my targets have not changed and there is a big chance to see them.
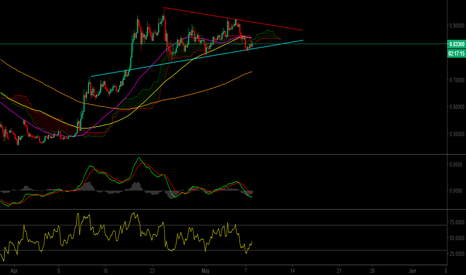
Ripple - How to trade?Price is moving on a wedge which supported by an uptrend line and RSI 8 confirmed for reversal. The cleavage of SMA 100 and SMA 200 is very good and Ichimoku cloud still up.
All of good conditions give us a trading opportunity. Order can be placed at the zone $0.82-$0.84.
Short term profit target: $0.9
Middle term profit target: $1.1
Long term profit target: $1.4, $1.7
-------------------------------------------------------------------------------------------------------------------
Stoploss: $0.7
Zoom out:
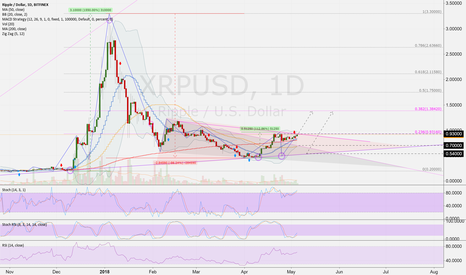
XRPUSD (D): Ripple at important decision point ...Ripple has corrected strongly since its high (86%). In the meantime, Ripple was able to gain 113% again. In comparison bitcoin achieves 50%!
Currently we could see two triangles, the red and the grey triangle in the chart. If Ripple breaks the red triangle, a further increase can be expected. If Ripple remains within then a correction down to 0.55 is possible.
If the grey triangle is correct, a retest is possible.
Next target could be Fibo 38 at 1.40.
Let's see what happens. Happy trading. :-)
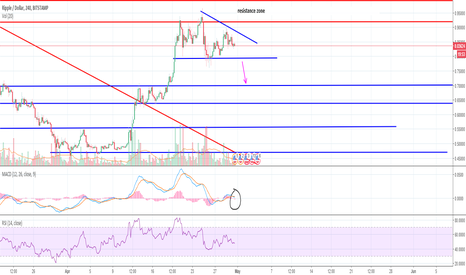
Not a Happy Pattern: RippleRipple is not creating a happy pattern with much of any potential to the upside. While BTC and ETH are trying to form a continuation pattern. Ripple just isn't at the moment.
Daily chart.
MACD looking bad, about to cross.
RSI not happy
Zooming in we have MACD about to cross and we are forming this descending triangle, which is not a happy sign. We really need to test this 91 cent area again for a continuation move. If we get a clean break of 80 cents, we are going to 70 cents at least.
If you are still in a position take half off the table and set a stop. Use caution and happy trading.
-Sherem
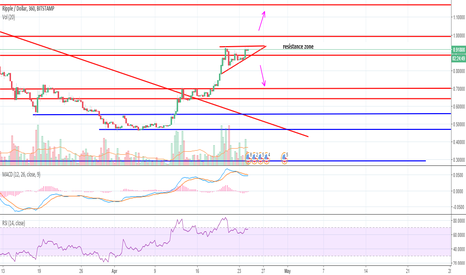
Ripple forming another continuation wedge, but use caution!!Ripple is forming another continuation wedge like the one we saw last time. However, this one is trickier because the wedge is in this resistance zone and right below the $1 mark which is more psychological than anything. the last wedge we had a good 20 cent gap before we hit any type of resistance. If we put a buy stop above this wedge we only have a few cents before it hits that $1 mark. If you believe it's just going to blow through $1, then a buy stop just above is the right call. But this first resistance zone has really held up. I would want to see it crack a $1 before I trade a break. Your call how you play it.
smash that like button if that helps.
Happy Trading,
-Sherem
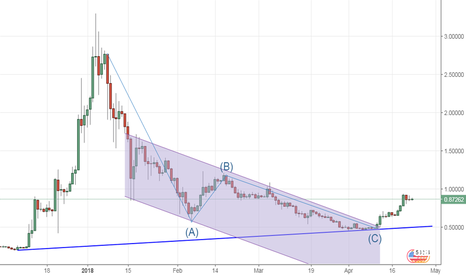
Ripple You Are Cleared For TakeoffAfter what can only be described as a dismal three months for Ripple investors who bought into the hype in December - January, there may finally be a light at the end of the tunnel. Looking at the chart, you can see that Ripple finally and clearly broke through the downtrend channel that plagued the cryptocurrency for months. Further, like most of the other cryptocurrencies, Rippple is showing an ABC correction pattern. Unless Ripple takes a major nose dive in the next 2 weeks, it looks like the majority of pain is over and we should see a slow and steady uptrend from here.
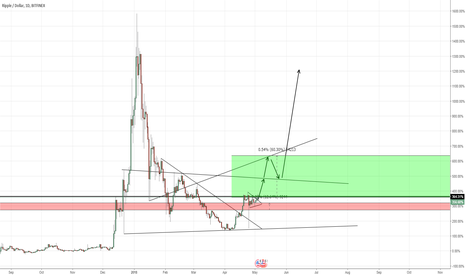
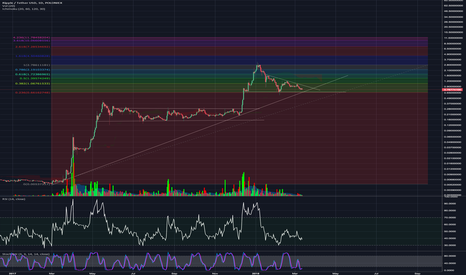
RIPPLE XRP/USD - BIG MOVE COMING! Wave 5 on the HorizonEveryone should look at the Ripple/USD chart in Log scale dating back 1 year to see whats really going on.
Its EXTREMELY Technical and is following the trend to perfection.
Say what you want about Ripple but you cant deny the BIG Moves it makes when its all gas'd up.
To me, its just a money making opportunity. I get in and get out.
We are in a descending wedge from the last correction and its about to break up. It wouldnt make sense for it to break down below the trend line that its followed for the past year when we're not at the end of it yet.
It would have to be squeezed out of it at the top which if you follow my trendline to the top this should happen around may which is when we will see the real correction take place. This last one was peanuts IMO
Also, this pattern lines up perfectly with the FIB so if my TA is correct im seeing a top around $8-$10 as hard is that is to believe but i cant see it play out any other way being its so technical.
***NOT FINANCIAL ADVISE... This is just my humble opinion. Ive been wrong many times, and i may be again, but this one is hard to ignor.
Id love to get the opinions from others if you see what im seeing
Happy Trading Ya'll!
RIPPLE XRP/USD - HARD TO IGNOR THE FACTSEveryone thinks that Ripple is gonna dump off again like last time but I see something completely different and this can only be seen in Log scale dating back 1 year.
If you Look at the trend line, its following it to perfection, and this would also indicate that we are only on Wave 4 of 5.
I Started the Fibonacci at the top of the last run all the way to the bottom of last years run and it lines up perfectly! should it reach the top of the Fib scale that would indicate a Top at around $10 as hard as that is to believe.
This would also tip the scale of the trend line and send it into a correction there after. Right now i believe we are at the bottom of the 4 Wave.
If you see something different please share but I believe this is about as accurate as it gets and I never see anyone post the XRP chart from this perspective.
SIMPLE YET EFFECTIVE!
R-R-R-R-Ripple getting R-R-R-Rekt... Again! Taking a quick look at the XRPUSD market today
The Ripple market is looking weak, with the bulls also staying shy of the market, confirmed by the low trading volume.
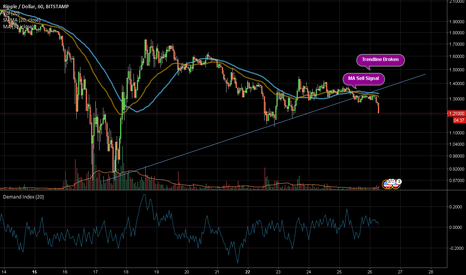
We have 2 sell signals on the 1 hour chart and I would advise caution to most speculators that are long short term.
The first sell signal is the cross of the 20 MA and 50 MA, which is followed by the bullish trend breaking. (Trend line breaking)
The bearish action is confirmed for me by the Demand Index and other indicators.
I am short on the short term for ripple and sitting on the sidelines for the longer term.
I might consider going long and playing the bounce should prices dip below $1 again.
Feel free to discuss this trade idea with us .
