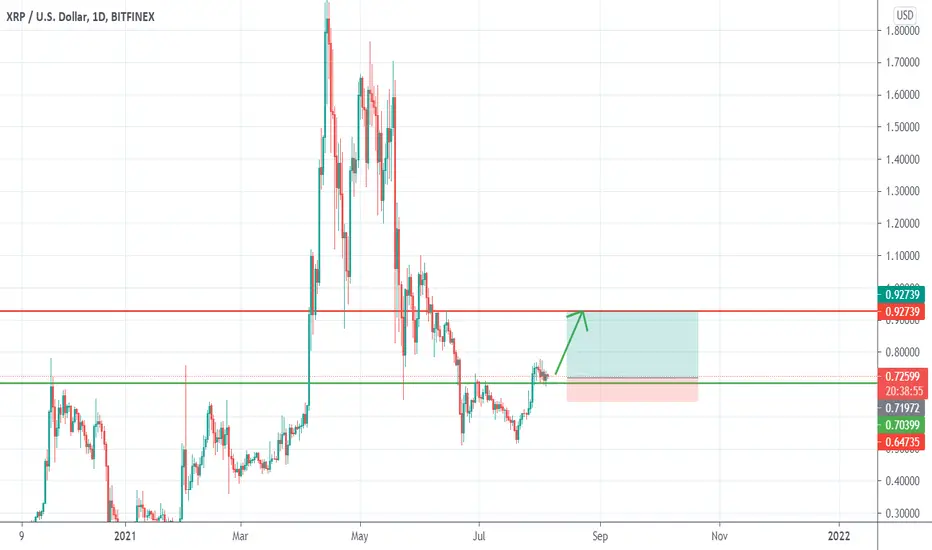
Ripple- New leg up soonAfter the double bottom in the 0.5 area, XrpUsd has broken the neckline of the pattern and for more than a week now is slightly correcting and consolidating.
The pair looks ready for a new leg up and 0.9 could be the target.
Rippleusdt
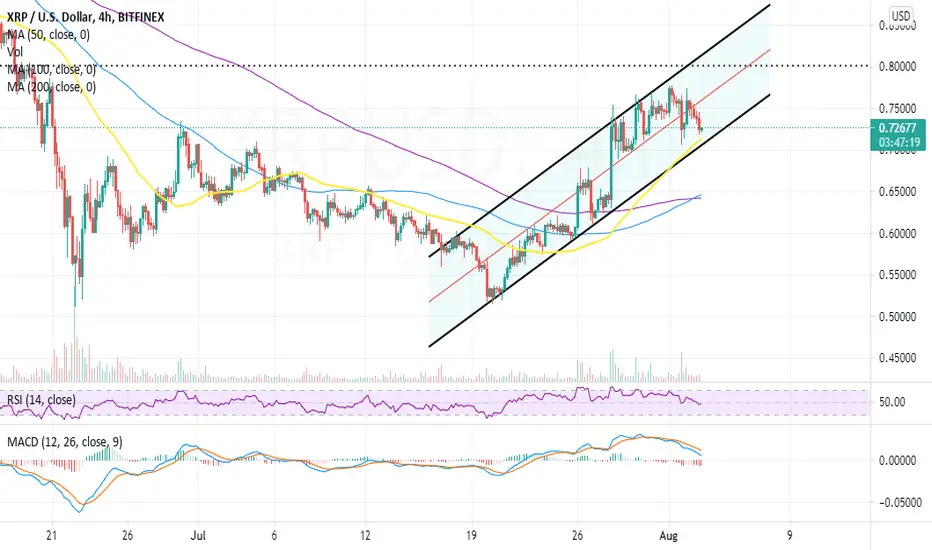
XRP Crumbles From July Highs, Risks Exploring Levels Under $0.7
XRP price failed to extend the bullish leg to $0.8 following the gains on the weekend.
Ripple hunts for support at the 50 SMA to avert losses under $0.7.
The MACD and the RSI reinforce the bearish outlook, leaving XRP vulnerable to losses.
Ripple price has continued with an upward roll started after July’s worst selloff that saw it plummet to $0.52. The international money transfer token seems to have restored investor interest, especially with the launch of the On-Demand Liquidity (ODL) remittance corridor between Japan and the Philippines.
The payments corridor tapping into Ripple’s flagship blockchain service is significant because of the nearly $2 billion a year remittance market between the two companies. Following this news, XRP made hastes stepping above $0.7. The bullish leg stretched toward $0.8 over the weekend but stalled around $0.78 on some exchanges like Bitfinex.
XRP Price Engages Reverse Gears At Full Throttle
Ripple is trading at $0.72 in the wake of rejection from $0.78. Since the recovery began last month, the price action shaped in an ascending parallel pattern. The channel’s upper edge contributed to the overhead pressure, cutting short XRP’s bid for $0.8 and $1.
Besides, a break under the middle boundary appears to have put bears completely in control. Hence, Ripple needs to hold the support at the 50 Simple Moving Average (SMA) and the channel’s lower boundary. This will ensure that losses do not stretch to $0.7 and explore levels further down.
It is worth mentioning that the short-term technical picture is mainly bearish, starting with the Moving Average Convergence Divergence (MACD). A sell signal from this trend-following tool appeared when the 12-day EMA crossed below the 26-day EMA. Note that the odds for a bearish outlook soar as the MACD moves closer to the mean line.
The Relative Strength Index (RSI) adds credibility to the bearish narrative, especially with the ongoing retreat from the oversold region. Sellers will get more aggressive if the RSI confirms movement below the midline and closes the gap to the oversold area.
Ripple Price Intraday Levels
Spot rate: $0.722
Trend: Bearish
Volatility: Expanding
Support: The 50 SMA and $0.7
Resistance: $0.75 and $0.78
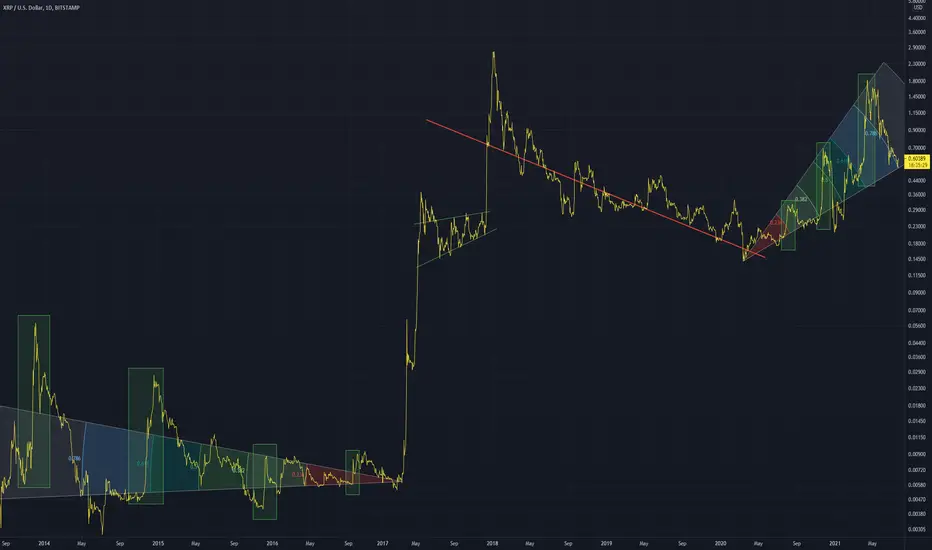
Using the Fib Wedge tool XRPUSD The wedge tool can be demonstrated here
XRP can be seen in 2014 (the early days) pumping periodically throughout fib ranges
When finished it led to a massive breakout.
Now the current rising broadening wedge can be seen to be pumping in the same periodic matter
Is this a sign of a large bull move coming? maybe.
The only difference is this time the wedge is expanding as price is rising.
While before the price was falling as the wedge was tightening.
This is makes the situations kind of equal in a way.
In green circles (flag emoji) very similar price action can be seen.
Below is a clearer version of the current ascending wedge on XRP
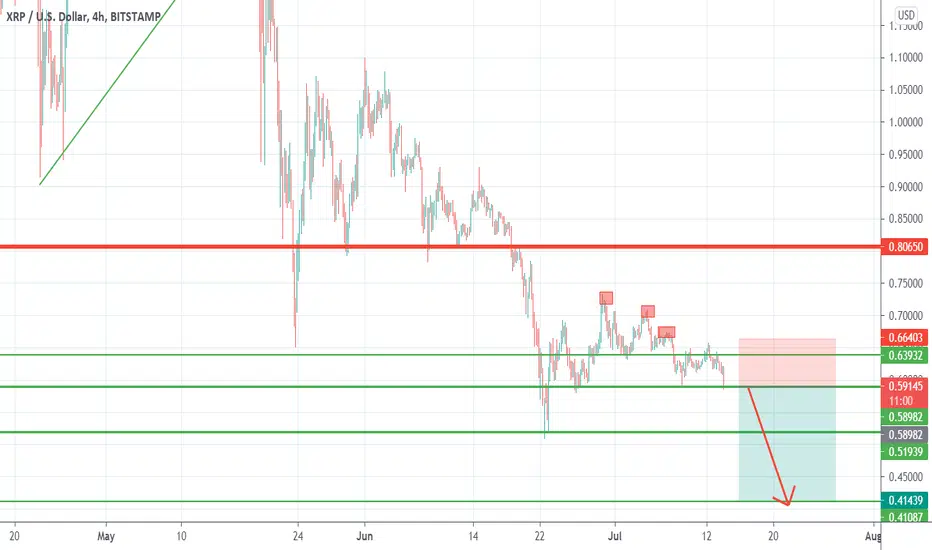
Ripple- eyes on 0.5Ripple has started to fall again and at this point is treading just in 0.6 zone support
In my opinion this support will not hold for long and XrpUsd will fall to the next one at 0.5
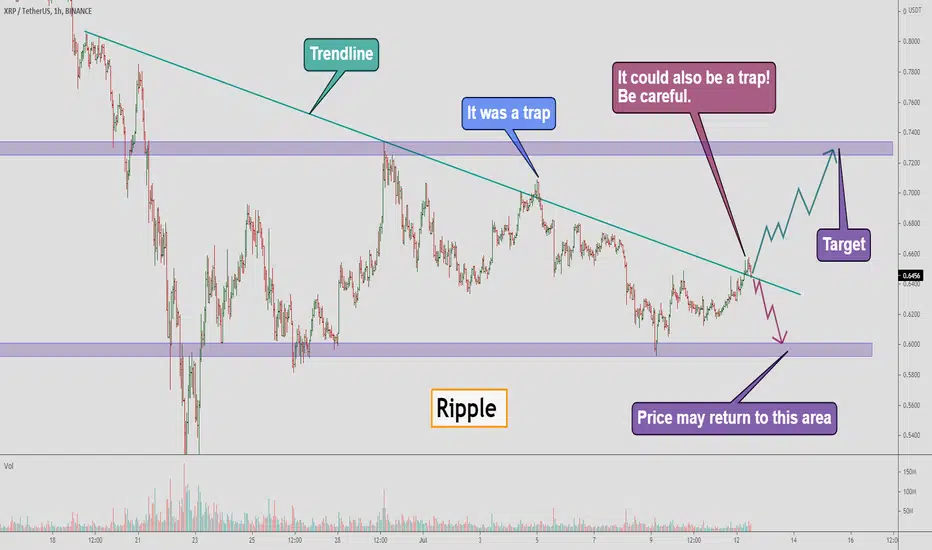
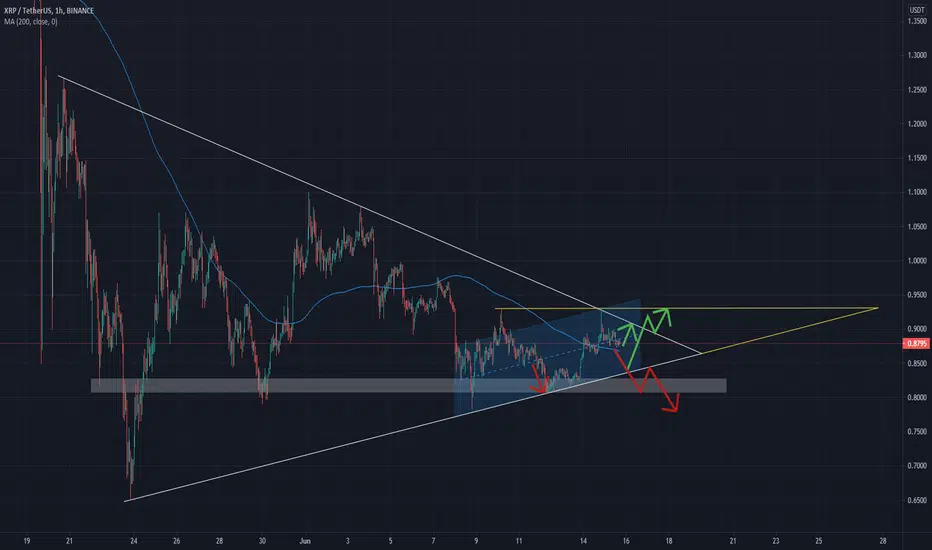
Ripple - Is it a trap again or will XRP fly up 😱❓What's on the Ripple chart now?
This is the second time Ripple has broken the trend line, which has been building since June 19. The first time it was a trap. Could it also be a trap? Of course, it is! From a technical analysis point of view, it is a good buying opportunity, as the price has broken the resistance line and is now testing it as support.
If this support line holds, the price will probably go significantly higher, but if it doesn't and the price goes back lower, it will likely fall back to the marked area.
Write in the comments all your questions and instruments analysis of which you want to see.
Friends, push the like button, write a comment, and share with your mates - that would be the best THANK YOU.
P.S. I personally will open entry if the price will show it according to my strategy.
Always make your analysis before a trade
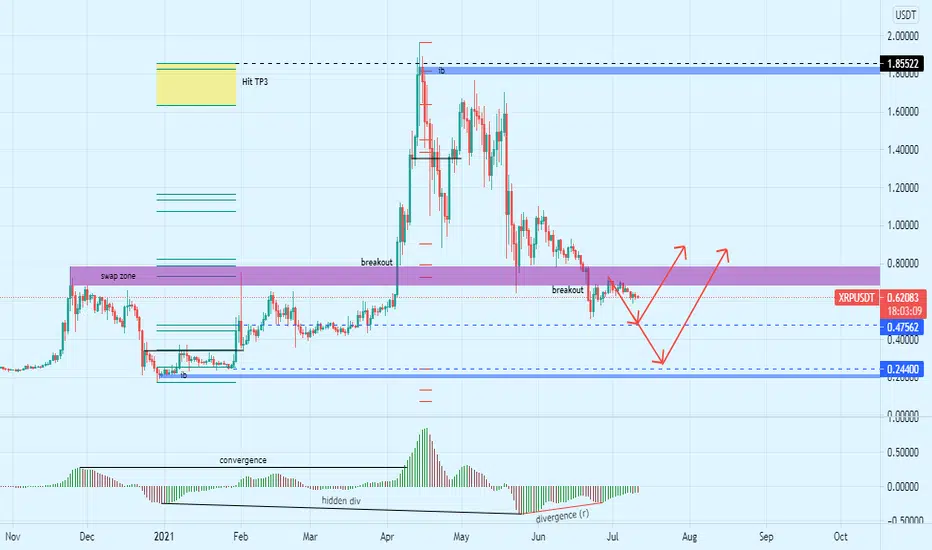
Ripple D1 Analysis - ''Door Up" Open or Not?Although bullish hidden divergence and divergence have formed but it is only a divergence in one valley which indicates the increase is only temporary.
I expect the downward momentum to remain strong and will likely go to the previous fibo buy level area around 0.47562 to 0.24400 to complete the pullback.
Looking at the fundamentals of Ripple or XRP, it is one of the Altcoins that has great potential to be part of the portfolio. The price is now very low and very worth it to grab and hold for the long term.
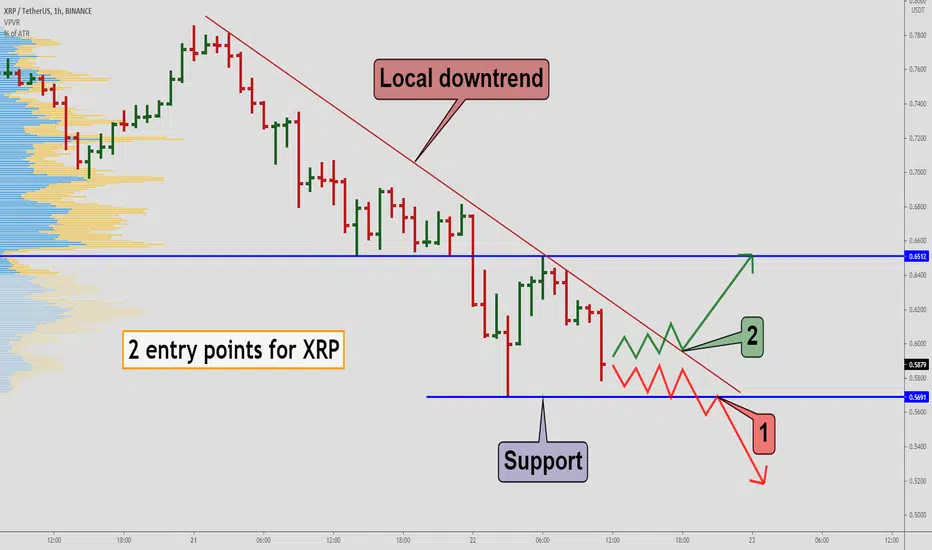
XRP, Ripple - 2 local entry points for coin.Take a look at whereI see two options for trading:
1. We have a local low at 0.5691. If we touch it several times and start trading near it, the chance of breaking down is very high. The entry point after the breakout and retest of the support line.
2 . We have a local resistance line. I'll consider it for a breakthrough in case of a squeeze to the level. If it happens, I'll enter after the breakout and retesting accordingly.
Write in the comments all your questions and instrument analysis of which you want to see.
Friends, push the like button, write a comment, and share with your mates - that would be the best THANK YOU.
P.S. I personally will open entry if the price will show it according to my strategy.
Always make your analysis before a trade
Ripple- Next target 0.4?As expected, XrpUsd has broken 0.8 support and now is trading at 0.75
My outlook for the crypto market remains grossly bearish and I expect Ripple to reach 0.4 in the next wave of selling
0.8 is now resistance and rallies to that zone should be sold
Only Ripple above 1usd would put a pause on this outlook

XRP, Ripple - I don't open buy position now. I'm waiting for...Like a lot of top coins, XRP broke the resistance line. I don't like this breakout because we didn't have a big volume for it. Now isn't a good time to do something. The best way, to wait for retesting to key level 0.8437 and open buy position with a small stop-loss after it.

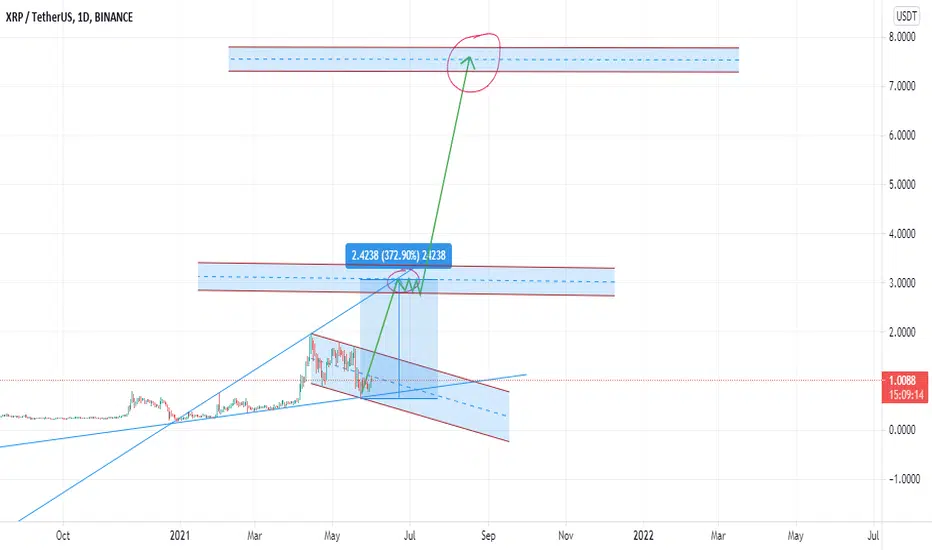
XRPUSDTIf the uptrend continues, the probability of moving in the first target is towards $ 3. For the second purpose there is a range of $ 7 until mid-August
XRP - Pushing DownXRP here followed the downtrend too.
It's pushing down the lower Bollinger Bands and now because it confirmed crossing the past fib line, we can say it's a bearish short-term move for now.
Sell volume is high in the whole market so if you're into leverage trading this might be a good time to open short positions.
For a safer strategy wait for the first 4H candle to close under the resistance area and the open short positions.
Current Market Price: $0.8070
Good Luck
Tell me your ideas. Like and Share

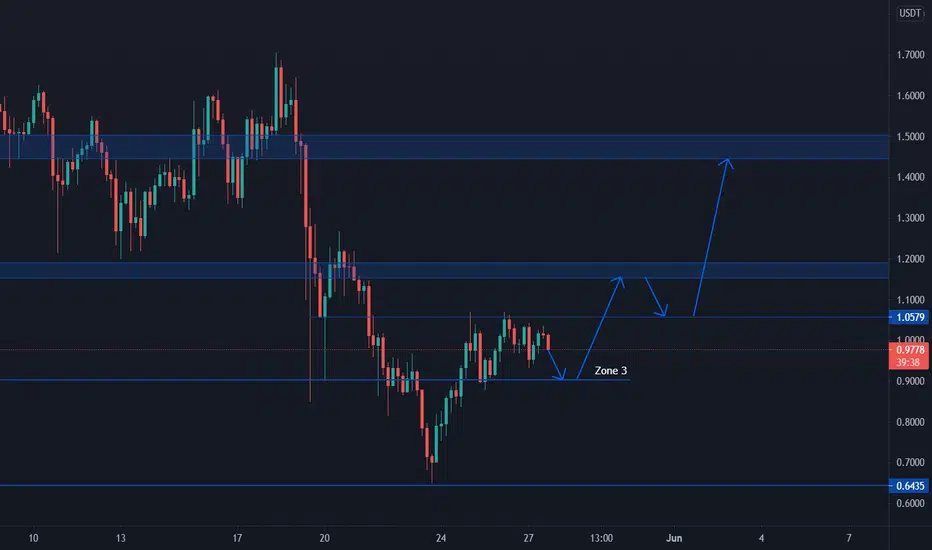
XRP, Ripple - look when I bought and what I'm waiting forI opened a buy position in 0.68. It was a great time to buy because of dramatically dropping in the whole market. With this drop, we showed how strong the zone 0.2- 0.6 is. On the chart, u can see a big accumulation there. Now I keep hold and wait for growth to 1.2 zones. Let's see what happened. I'm willing on another scenario. It's market and I'm not God
Write in the comments all your questions and instrument analysis of which you want to see.
Friends, push the like button, write a comment, and share with your mates - that would be the best THANK YOU.
P.S. I personally will open entry if the price will show it according to my strategy.
Always make your analysis before a trade

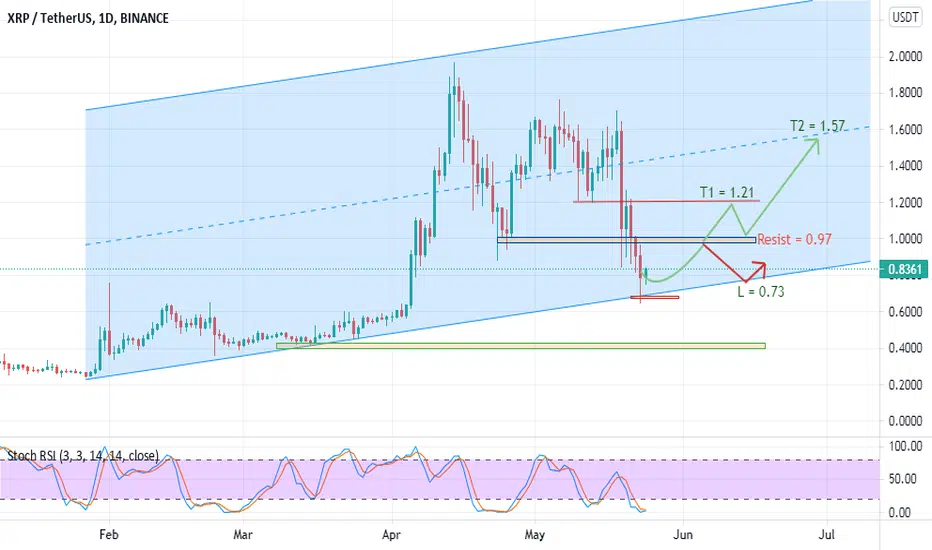
XRP Update 1 XRP has still above the bottom support of the historical uptrend and it seems that has returned back to the up (Short Time). But the nearest resistance 0.97 will be faced very soon and then we can only decide as per the action against the resistance. If it break up the resistance , hope would bring back for the rest of the uptrend. If not , we should stay and see what happen. The next support is 0.73 .
Note : Don't forget to analyze by yourself before any action.
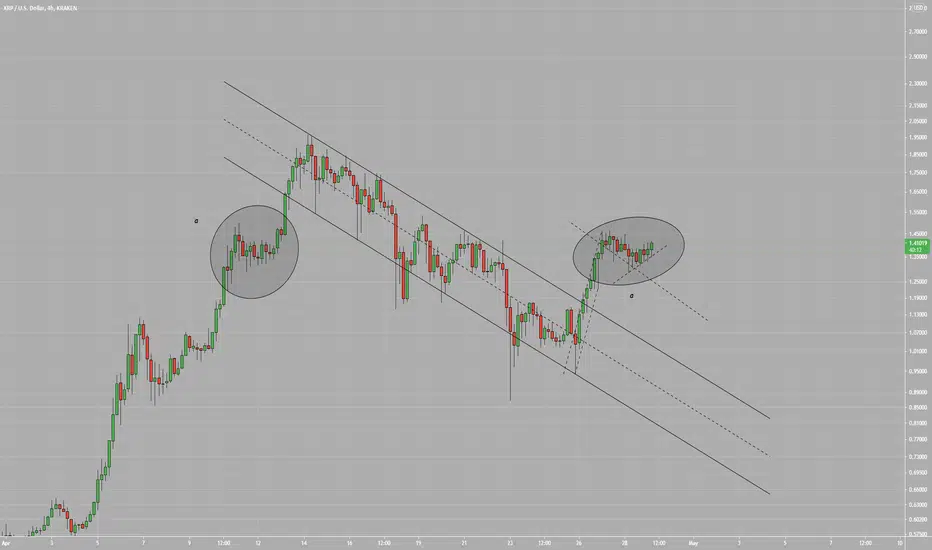
XRP Area to watchIs this a breakout formation?? possible
Watch area in circle as breakout will likely be there
I am long XRP
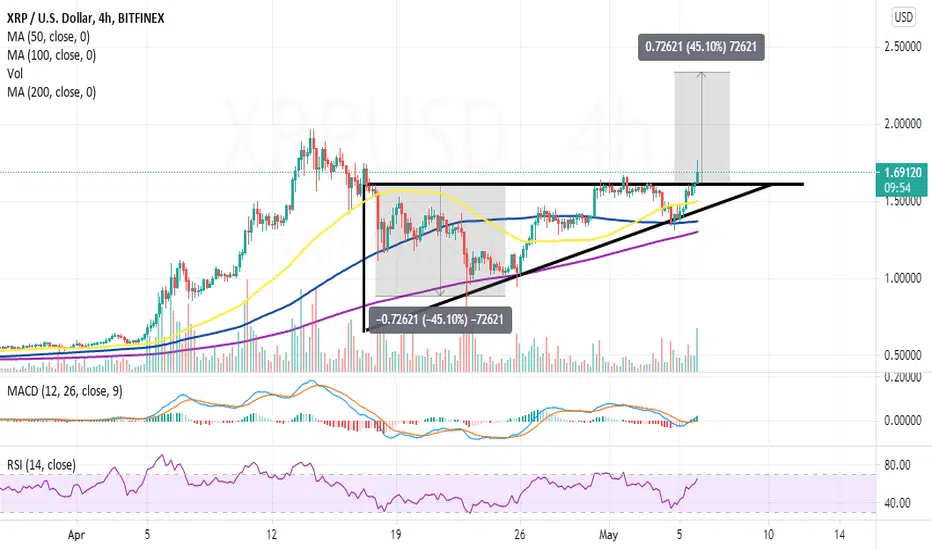
XRPUSDT Channel BreakoutXRPUSDT(4H CHART) Technical Analysis Update
Channel Breakout
XRP/USDT currently trading at $1.42
Buy-level: $1.40 - $1.44
Stop loss: Below $1.30
Target 1: $1.52
Target 2: $1.61
Target 3: $1.68
Target 4: $1.76
Max Leverage: 2X
ALWAYS KEEP STOP LOSS...
Follow Our Tradingview Account for More Technical Analysis Updates, | Like, Share and Comment Your thoughts.

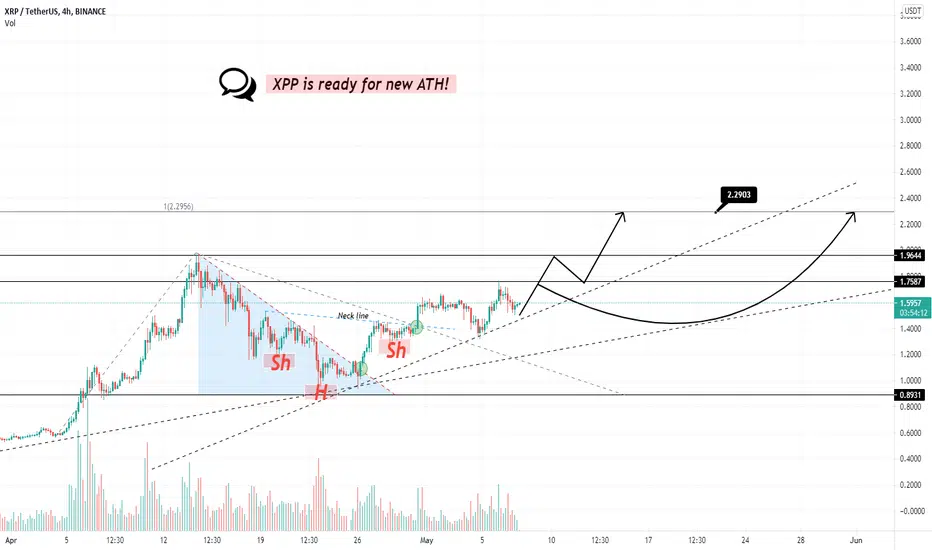
XRPUSDT | 4H Time Frame | 7 May 2021XRP is ready for new ATH
®Reasons:
✔ Head and shoulders pattern (confirmed)
✔ Triangle breakout (confirmed)
✔ new HH & HL (Uptrend)
✔ The opinion of most analysts is Bullish (Optimism)
XRP takes off for a colossal technical liftoff eyeing $2.3Ripple finally embraced the vital support at $1.3, allowing bulls to take the mantle. The bullish leg extended above the 50 Simple Moving Average (SMA) on the four-hour chart near $1.5, further cementing the bull’s presence in the market. Last week’s resistance at $1.6 seems to have bolstered XRP beyond $1.7.
At the time of writing, Ripple is exchanging hands at $1.7, following a 17% growth in the last 24 hours. The cross-border token has attracted a $15 billion trading volume across all platforms and boasts $78 billion in market capitalization. XRP is working toward reclaiming the fourth spot by unseating Dogecoin.
Ripple rally toward o$2.3 builds momentum
An ascending triangle formed on the four-hour chart is a massive bullish signal. This pattern develops during an uptrend and signifies the continuation of the previous trend. A couple of trend lines make the pattern, connecting the relatively equal peaks and the ascending lows.
The horizontal line (x-axis) shows that sellers gradually lose traction while the hypotenuse shines a light on a strengthening bullish outlook. A final break past the x-axis usually culminates in a significant upswing. The breakout is characterized by an increase in volume and has an exact target measured from the triangle’s highest to lowest points.
The ongoing uptrend seems to have been seconded by the Moving Average Convergence Divergence (MACD) indicator. In addition to entering the positive region, the MACD line has crossed above the signal line, which is a bullish signal.
Consequently, the Relative Strength Index (RSI) on the four-hour chart reveals that the slightest resistance path is upward. A break past $2 will likely trigger massive gains to close the gap heading to $2.3.
Ripple intraday levels
Spot rate: $1.7
Trend: Bullish
Volatility: High
Support: $1.6 and $1.3
Resistance: $1.75 and $2
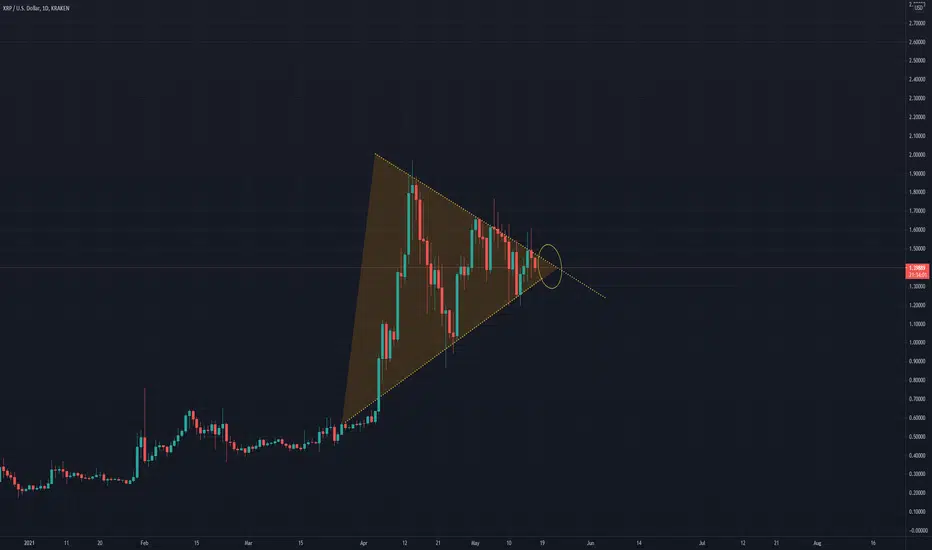
$RIPPLE / $XRPA Triangle breakout can be followed. Let's not take action without breaking.
Of course, we should not forget the possibility of getting reactions and testing sub supports.
POSSIBLE scenarios on the chart
--------------------------------------------
Üçgen kırılımı takip edilebilir. Kırmadan harekete geçmeyelim.
Elbette tepki alıp alt desteklerin test edilme olasılığını da unutmamak gerekir.
MUHTEMEL senaryolar grafikte
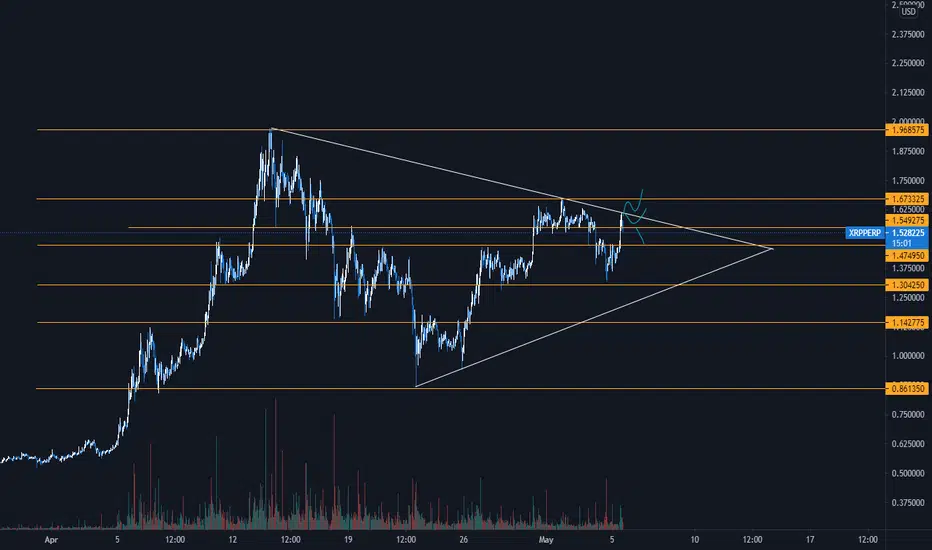
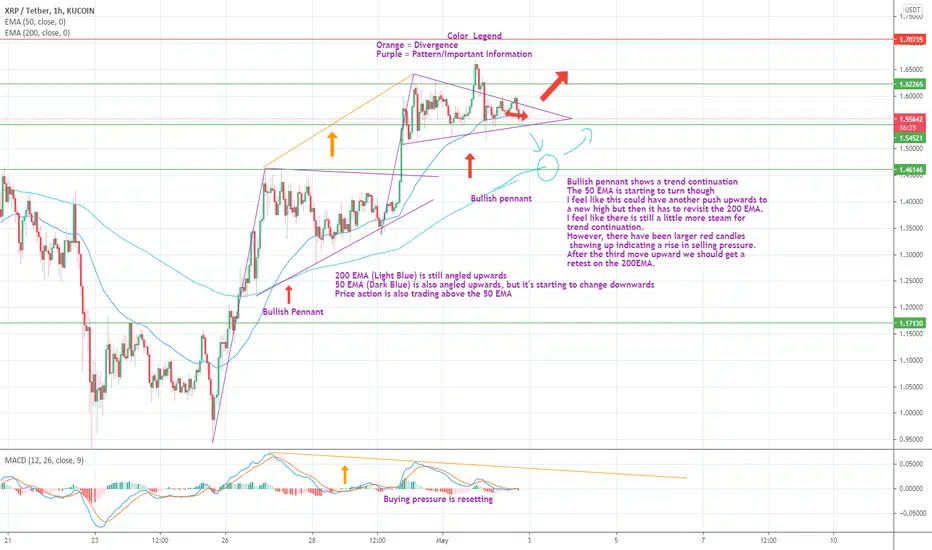
XRP/USDT Technical AnalysisHey guys, Top here.
This is a re-post of my idea because the last one got hidden. I believe I posted it in the spanish section by mistake.
I believe that the price action will remain in the pennant until squeezed. When squeezed I believe the price will move up to the next resistance level (1.71ish).
If not it'll fall through the support and retest the 200EMA for a bounce. Make sure to get in at 1.52-1.54.
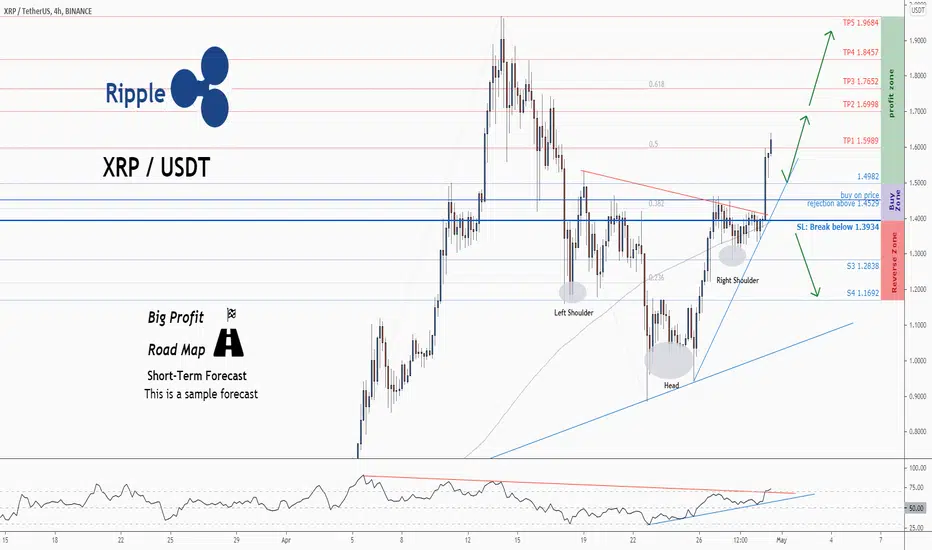
💡Don't miss the great buy opportunity in XRPUSDTrading suggestion:
". There is a possibility of temporary retracement to suggested support line (1.4982).
. if so, traders can set orders based on Price Action and expect to reach short-term targets."
Technical analysis:
. XRPUSD is in a uptrend and the continuation of uptrend is expected.
. The price is above the 21-Day WEMA which acts as a dynamic support.
. The RSI is at 73.
Take Profits:
TP1= @ 1.5989
TP2= @ 1.6998
TP3= @ 1.7652
TP4= @ 1.8457
TP5= @ 1.9684
SL= Break below S2
Previous Forecast:
❤️ If you find this helpful and want more FREE forecasts in TradingView
. . . . . Please show your support back,
. . . . . . . . Hit the 👍 LIKE button,
. . . . . . . . . . Drop some feedback below in the comment!
❤️ Your Support is very much 🙏 appreciated!❤️
💎 Want us to help you become a better Forex trader?
Now, It's your turn!
Be sure to leave a comment let us know how you see this opportunity and forecast.
Trade well, ❤️
ForecastCity English Support Team ❤️
XRPUSD 4H Buy scenarioPrinting bullflag
Looks to break upwards
This is the 4Hour chart
I am long XRP