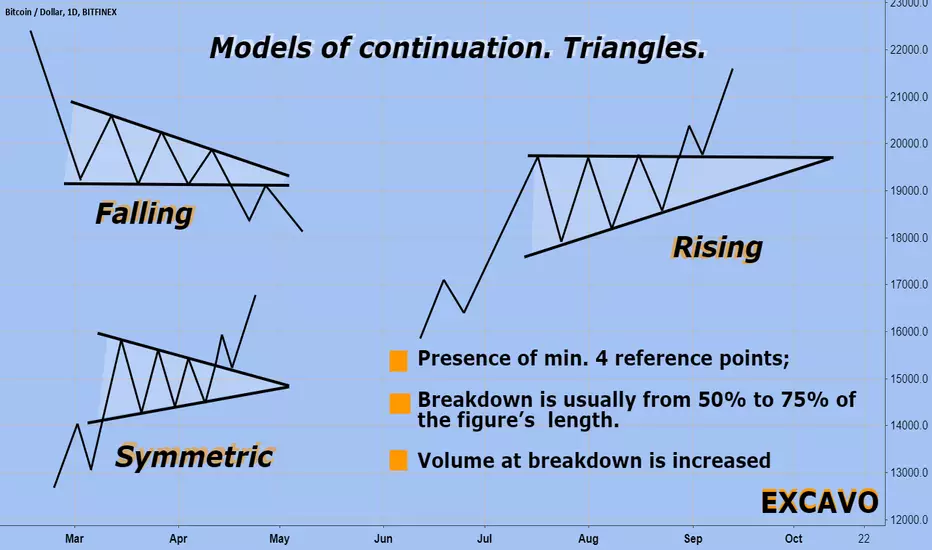
BTCUSD Models of continuation. Triangles.BASIC MODELS OF THE CONTINUATION OF THE TREND’S MOVE
Graphic configurations which will be studies in this chapter are called the models of the trends continuation. These models usually mean that the period of the price stagnation indicated on the graph is just a pause in the main trend development and that the direction of the trend will be the same after they end.
The second criterion between the fracture and continuation models is the duration of their formation. The construction of the first ones, which display serious changes on the price dynamics, require more time. The second ones are shorter. It is better to call them short-term and intermediate.
Note how often we use the word “usually”.
This is due to the fact that the interpretation of graphic models is subject, rather, to general patterns than to rigid rules. There are always exceptions in it. Even the elementary classification of price models is sometimes difficult.
There are always exceptions in it. Even the elementary classification of price models is sometimes difficult. Typically, triangles are models of continuation of the trend, but at times they show a fracture of the trend. Although triangles are usually considered intermediate models, they sometimes appear on long-term graphs reflecting the development of the main trend. A variation of the triangle - an inverted triangle - usually means a fracture of the main upward trend. At times, even the "head and shoulders" - the most famous basic model of a fracture - may indicate a phase of consolidation
TRIANGLES
We will begin a discussion of patterns of continuation of the trend with consideration of triangles. There are three types of triangles - symmetrical, ascending and descending (sometimes called the fourth kind, known as the "expanding triangle" or "broadening formation," but it will be considered below). All triangles differ in shape and have different prognostic functions.
SYMMETRICAL TRIANGLE
A symmetrical triangle or "spiral" is, usually, a continuation of the trend. It marks a pause in the already existing trend, after which the latter resumes.
An example of a bullish symmetrical triangle. Note the two converging lines. The model ends when the closing price is fixed on the market outside of any of the two trend lines. The vertical line on the left is the base of the model, and the point on the right where the two lines meet is the vertex.
The minimum requirement for each triangle is the presence of four control points. To hold the trend line, as we remember, two points are always needed. Thus, in order to draw two converging trend lines, each of them must pass through at least two points.
The completion of the triangle model takes some time, which is determined by the point of convergence of the two lines that is the top of the model. Usually, the price breakout should be in the direction of the previous trend, at a distance of half to 3/4 of the width of the triangle horizontally.
The ASCENDING AND DISCENDING TRIANGLE
Ascending and descending triangles are a kind of symmetric but have different prognostic functions. The figure below shows an example of an ascending triangle. Note that the top line of the trend is horizontal, and the bottom line is up. This model means that buyers are more active than sellers. Such a model is considered to be a bullish one and usually ends with a price breakout beyond the upper line.
This model is completed when the closing price goes beyond the upper trend line significantly. A breakthrough must be accompanied by a sharp increase in volume. The upper resistance line turns into a support level with subsequent price drops.
The minimum price benchmark is determined by measuring the height of the triangle (AB) and projecting this distance up from the breakout point C.
The descending triangle model is a mirror reflection of the ascending triangle and is often considered a bearish model. Have a look at the downward upper line and horizontal bottom line on the picture below. This configuration which indicates that the more active the sellers are than the buyers usually ends with the future price drop.
Completion of the model usually occurs with the closing price going beyond the lower trend line crucially and is accompanied by an increase in volume. Sometimes this is followed by a price return which meets resistance on the lower trend line. The measurement procedure for this model is exactly the same as for the ascending triangle. You should measure the height at the bottom on the left side of the model, and then project the distance down from the breakout point.
Rising
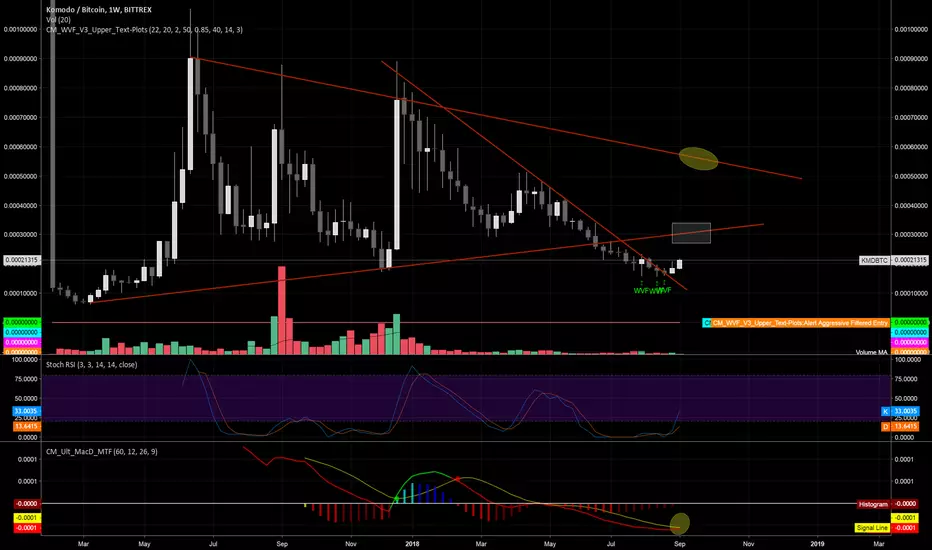
BTC in a giant rising wedge w/an apex close to 1 million in 2023 Decided to look at the overall trendlines for the entirety of BTC on bitstamp on the weekly log chart and it is very very encouraging. Although it is in a giant rising wedge which will eventually break down (most likely once the bubble finally bursts) The good news is we could climb to almost 1 million per bitcoin by 2023 before that happens....of course it could break down sooner than that like many rising wedges tend to do but if it holds out until the apex the dip it would fall to would be from 900k all the way down to the 6,000s which is where we are currently in price action. Also, this strong bottom support line which has held consistent since 2012 is fastly approaching our current price action which means we should soon go up from here and not have to worry about dipping down under the current level after December. Of course this is all my opinion not financial advice I could be wrong and the strong line of support could eventually be broken although an extremely low probability. We should also get back to our all time high range by no later than the end of 2019(possibly sooner) and continue to only go up exponentially from there if the support line holds true which the past has shown us time and time again it will.

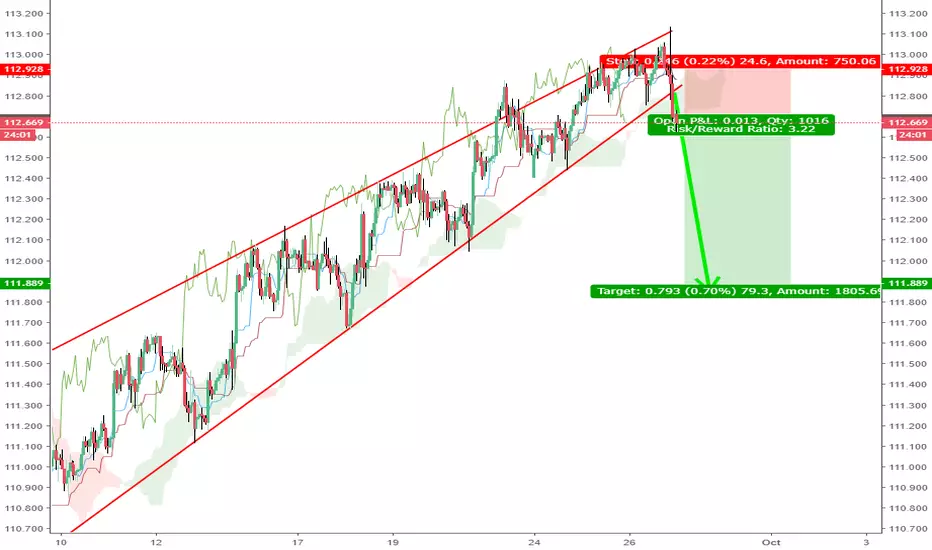
USD/JPY Broken Rising WedgeWe are in a great spot to sell, because we got good confirmation, so if everything goes to plan, we should be able to exit on a good profit. Good luck!
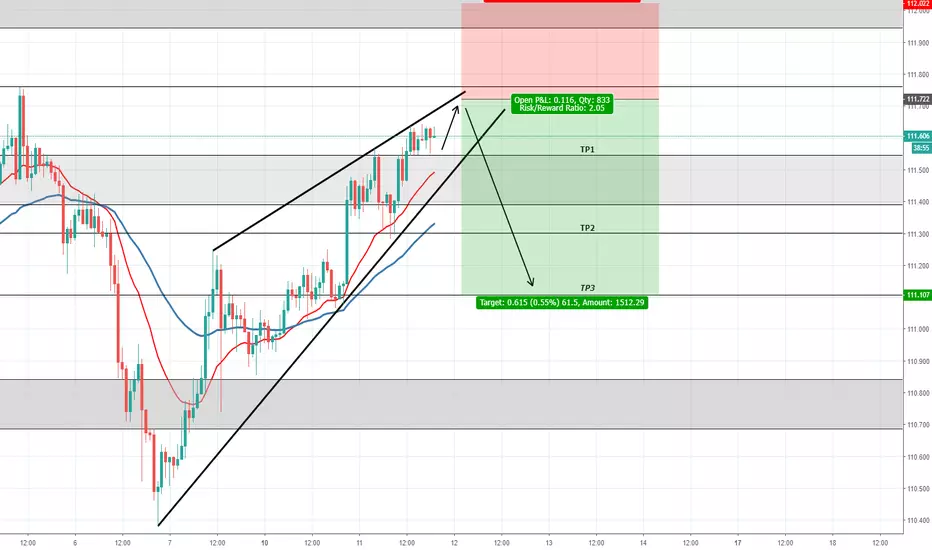
USDJPY - RISING WEDGE + BEARISH DIVERGENCEHello traders,
In the 1 our chart we can see a rising wedge + a bearish divergence on the rsi
Wait for a bearish candle (hammer or shooting star) for example and place your position.
This is my point of view for this pair for this next week.
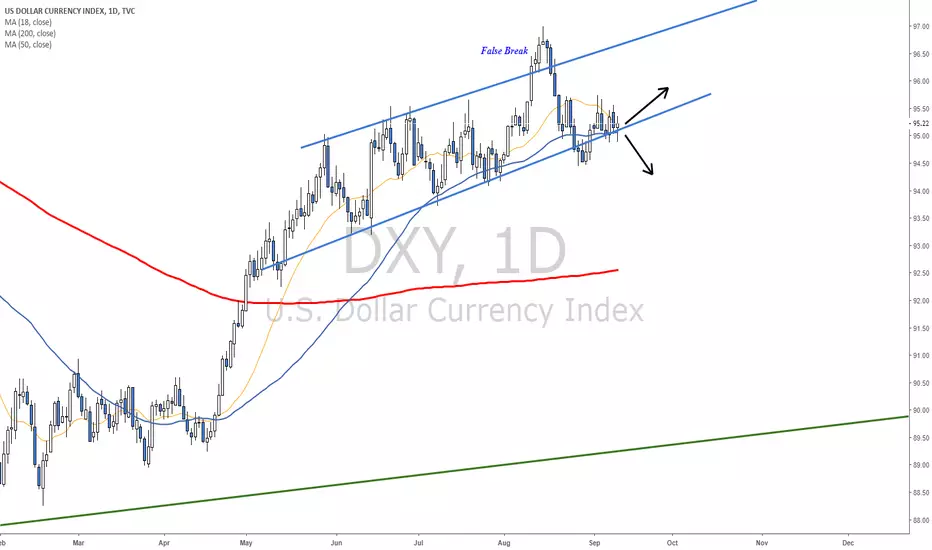
Dollar is testing support as Investors wait for Draghi and CPIThe Dollar Index is back near support after a failed rally that we saw in August.
The support zone includes the bottom of a rising channel, MA line and a structure zone (previously resistance, now potential support)
On Thursday we will have the ECB meeting and the U.S CPI data - Two events that can (and probably will) impact the Dollar.
The bearish scenario shows potential to reach 93
The bullish scenario shows potential to reach back to the top of the channel
What do you think?
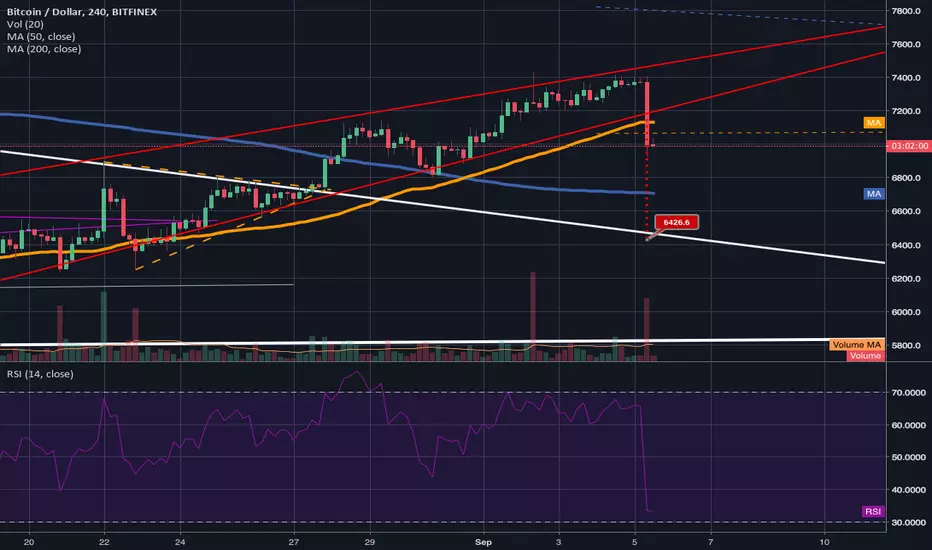
4hr lower low formed. Rising wedge breakout confirmed.target is around 6425 but may be wise to limit buy back in around the top trendline(in white) of the weekly descending triangle pattern as it may provide strong support. There's a chance the 1 day 200ma will provide that support so I will likely wait to sell again until I see us flip the 200ma to solidified resistance.

Higher low? Or breakdown confirmation of rising wedge?We have to dip under 6.8k to forma lower low and hand control back to the bears. If not we will simply form a higher low. There's a chance we can bounce back up into the rising wedge but if this current 4hr candle closes here or lower there is a very high probability it will trigger the breakdown that can potentially send us back inside the weekly descending triangle pattern. Let's hope by the time it reaches the 1 day 200ma that we see a bounce it seems like once it gets there the 4hr rsi will be hitting the oversold zone so a bounce there is possible..however if the breakdown from the rising wedge is triggered it will only be a dead cat bounce at most. Hopeful that we bounce up from there and prevent going back into the triangle.


1 potential bearish scenario is rising wedge + overextended rsisAlthough overall I am bullish I think it's important to note this rising wedge we appear to be in. Considering the rsi levels on the 4hr and 1 day are overbought and overextended we will have some difficulty breaking above the top trendline of the rising wedge which is also the neckline of a bigger inverted head and shoulder pattern we have been trying to break most of August. Rising wedges tend to break downward and I wou;dn't be surprised if to reset the rsi levels it did some sort of flash crash to 6.3k to trick the bears finding support on the top trendline of the big weekly descending triangle pattern and bouncing back up off it while also triggering the breakout of that pattern at the same time. A scenario well worth considering. The weekly candle closes in 4 hours so odds are if bears are gonna try to cause the flash dump it will be right before it. In order to have enough momentum to breakout above that top wedge trendline odds are very good that we need to reset the 1 day and 4hr rsis. However it's always wise to remember in moments of extreme bullishness rsis can stay in the overbought zone for much longer than most analysts would expect.

Mirror Predicting Major Positive BreakoutHere I have what I have found to be a mirror of the PG stock which is about to predict a big positive breakout. As you can see all the valleys and peeks line up pretty close in time and price with their mirrored counterparts. Also I believe this will break positive because the rising wedge ( in yellow) tends to have positive breakouts in u shaped volume, which as you can see is u shaped. I will be providing the link to the site that i got that information from. thepatternsite.com
{In the U - Shaped Volume Section On The Website At the Bottom of The List is Rising Wedge For Upward Breakout}.
I am quite positive this will preform. What do you think

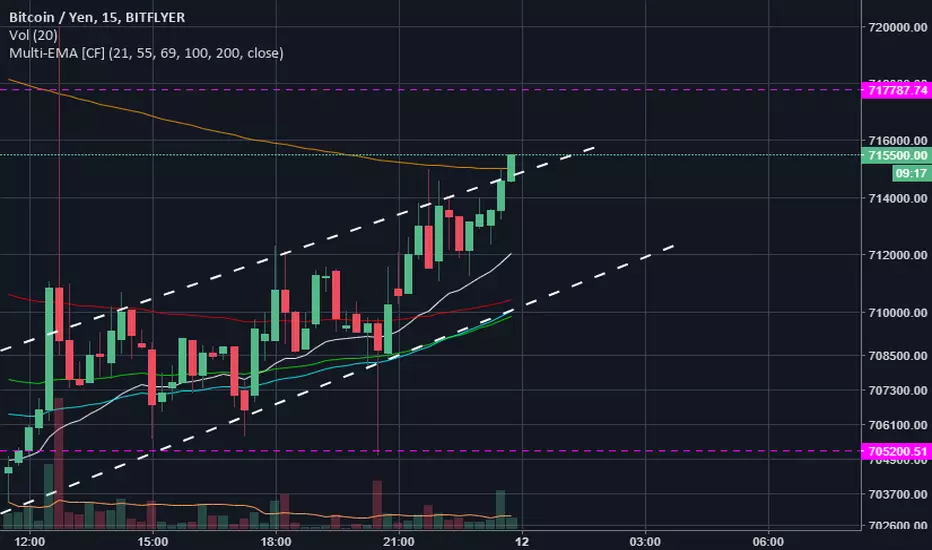
Rising channel on JPY exchange suggests bullish price actionWe are seeing a rising channel in the Japanese markets suggesting bullish price action to come, this could mean a jump to 6500 is more likely than i previously thought, keep your eyes open
lower low on the 4hr chart; officially broken down from wedge. I think it's very likely we can head to 5.9k here. The stochrsi on the 1day chart has plenty of room to drop still and the reason we are currently consolidating I believe is that the 4 hour rsi just hit oversold conditions. So it is likely we will fall back down and retest the bottom trendline of the pink symmetrical triangle. Even though we are currently at a lower low on the 4hr chart...dropping to 5.9k and then bouncing up would actually be a higher low on the 1 day chart. For now I am short. My one hope is that it doesn't cause the golden cross to undo itself. One still potentially bullish outcome to watch for in all of this however is that now we have fallen to a much more symmetrical shoulder height as the first shoulder of the inverted head and shoulder pattern, which means the ivnerted head an shoulder pattern for now is still valid...however it will be invalidated if we continue to fall and retest the bottom trendline of the pink symmetrical triangle pattern. Being prepared for either outcome is my plan...you make your own decision as this is not financial advice. Good luck and thanks for reading!
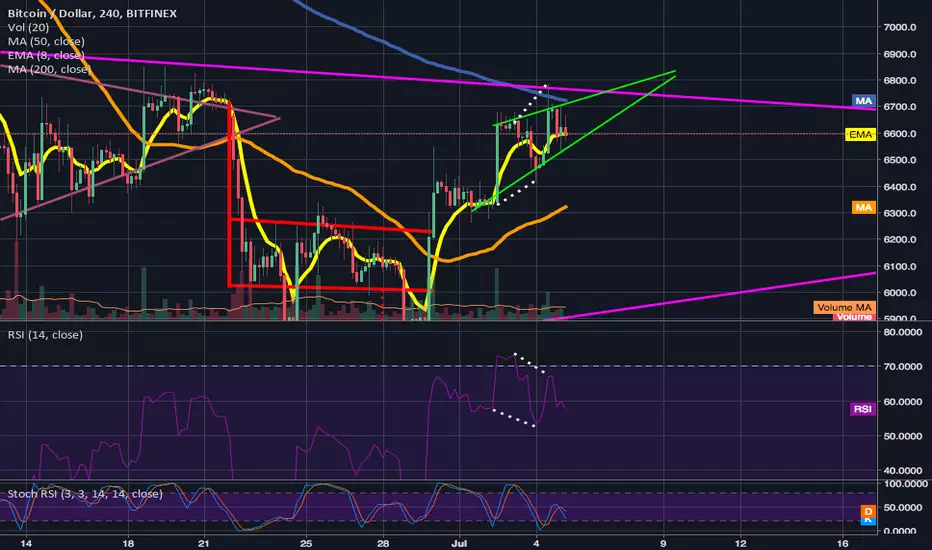
rising wedge still valid; 4hr srochrsi reset.As I had said an idea or so ago we will likely fake a breakout once or twice to reset rsi and stochrsi levels before w have enough momentum to break above the neckline of the inverted head & shoulders pattern. What was once looking like your average bull flag has morphed into a sort of small falling broadening wedge and now are 4hr stoch rsi is ready to go up again. I was also able to widen the bottom trendline of the rising wedge slightly and still maintain it's trend validity. So unless we see a big surge in bear volume here we are still inside the rising wedge and also found support at the wedge. If we do break down from the lavender wedge we may drop all the way back down to retest the bottom trendline of the symmetrical triangle. I think probability favors the uptrend still especially with the recent 4hr golden cross but need to anticipate the opposite happening as well. Just my opinion and not intended as financial advice. Good luck out there and thanks for reading.
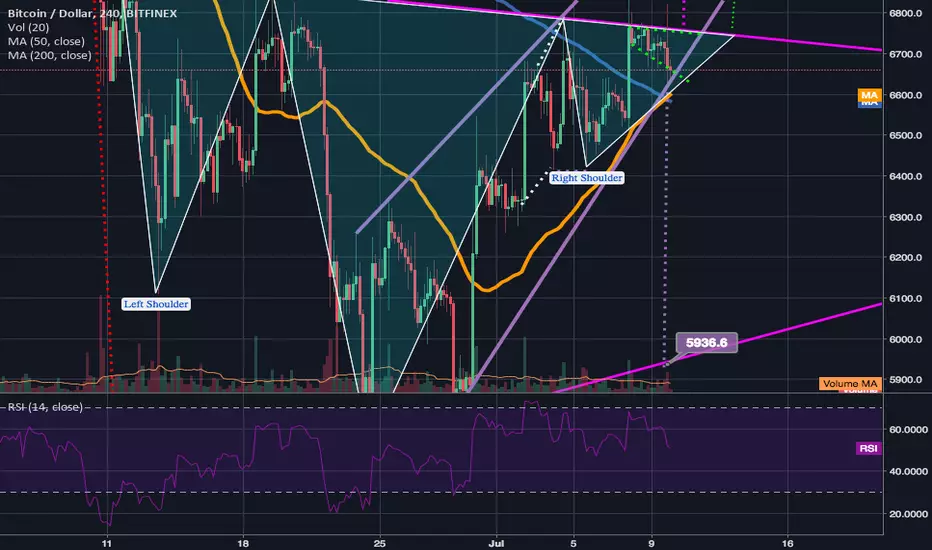
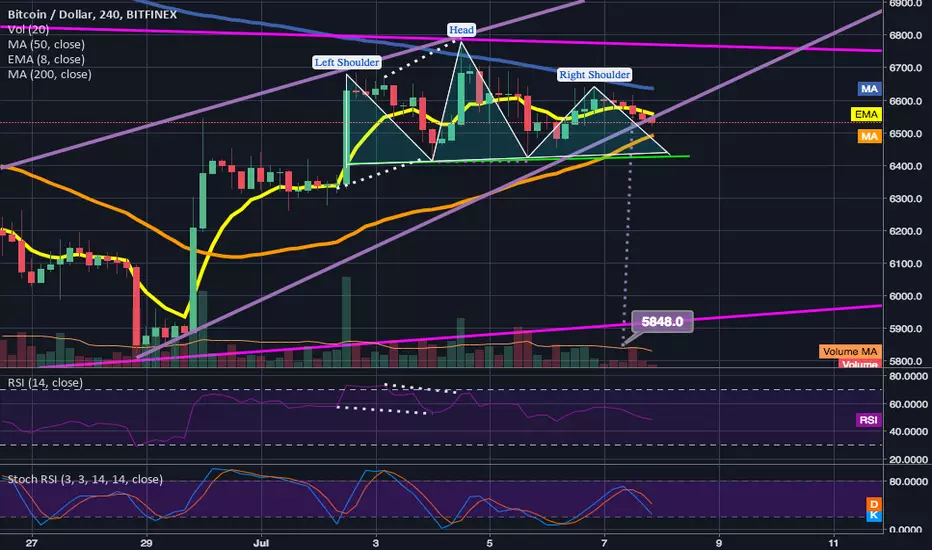
BTC Sideways; Potential Small Head&Shoulders Pattern Playing Out4 hour chart has formed a left shoulder ad head of a small head and shoulders pattern...if that breaks down it may trigger the rising wedge breakdown as well...been going sideways for a few days now...the larger inverted head and shoulder pattern is still in play as well though...so this idea will remain neutral.

Still inside larger rising wedge; Potential inverted h&s in playAfter seemingly breaking down from the first wedge but not getting a big enough red candle to go with it I have readjusted the smaller green rising wedge to fit more of a traditional bull flag shape. Was also able to widen the larger purple rising wedge with the newer candles wicks to see that we are still very much inside the bigger rising wedge. We could essentially however stay inside the bigger wedge and trigger an inverted head and shoulder pattern for a bullish break upward before we break downward out of the larger wedge. If hat were to happen it may allow us to avoid breaking downward from the bigger lavender rising wedge all together. Current stochrsi, and rsi on the 4hr chart seem like tey are ready for an upward climb as well. All these things considered makes this idea a neutral one.

Bearish Divergence + Rising Wedge = Breakdown?Seeing the combo of the rising wedge and the bearish divergence on the 4hr chart and 4hr rsi makes me think we will at least see a small breakdown back to the 4hr 50ma. Hoping we turn it back towards the upside after forming another higher low to allow the bulls tos tay in control. In the short term though probability is high enough for me to switch my idea status to short. Of course as always, I will be prepared for the exact opposite outcome as well with a smart stop buy back a few pips above the top trendline of the pink symmetrical triangle..hoping I can instead buy back in near the 4hr 50ma though. bst of luck in whatever you decide. Thanks for reading! (not financial advice)
July Bitcoin tanking Now its pretty obvious where its going, and it peaks in like 1 or 2 days from now

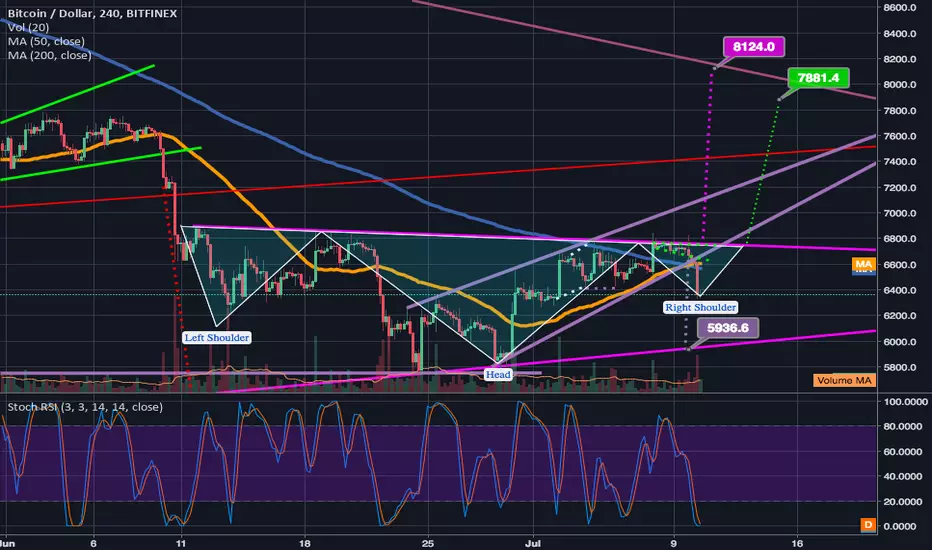
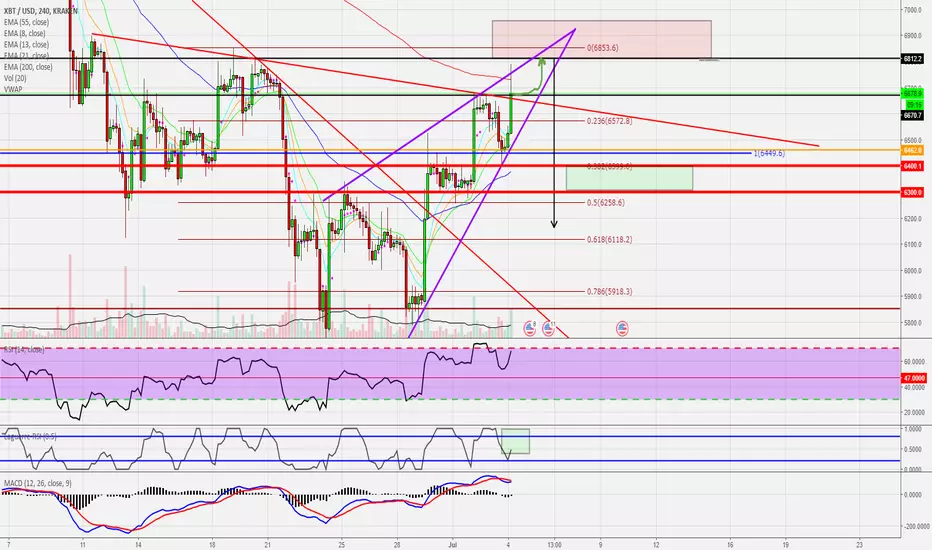
BTC: possible short opportunity comingGood morning and Happy Fourth of July all! Bitcoin has been making some great moves lately. It appears there is actually some buy interest now instead of bears playing games. However, even in a bull run we need healthy retracement to reload the coil springs. I'm not bearish at all by any means, but will be looking for a short. On the 4 hour we have almost completed a rising wedge pattern. We are also approaching a heavy rejection zone right at the top of the wedge. Even though regular RSI is oversold, I think we have one more leg to run with the L-RSI (see green box below,) to maybe 6800ish. The expected retracement of this wedge would put us around 6050-6100, but I typically expect wedges to follow through to about 80%. This would put us at 6300 which I believe is a pretty psychological and charted support zone, so I will close my short around here to be safe.

[USDCAD] Goodnight Looney Bearish harmonic spotted on USDCAD. Weak price action and lower highs. Entered short.
Targets are labelled.
Please use a stop loss and appropriate risk management.
Remember to always trade responsibly.
Good luck! :D This universe has no boundaries.
