Bitcoin at 120,000: Decisive Breakout or Renewed Consolidation?__________________________________________________________________________________
Technical Overview – Summary Points
__________________________________________________________________________________
Momentum: Strongly bullish on H1 and above; healthy consolidation below ATH.
Supports/Resistances: 120,000 USDT (pivot resistance), 116,400–117,000 (major support), 104,000–110,000 (long-term support).
Volumes: Normal, no anomaly nor climax detected.
Risk On / Risk Off Indicator: Strong buy signal on all timeframes except very short term. Sectoral health confirmed.
Multi-timeframe: Short-term bearish divergence on 15/30min, but robust technical structure above H1-D1.
__________________________________________________________________________________
Strategic Summary
__________________________________________________________________________________
Global bias: Confirmed bullish across all timeframes; no major break detected.
Opportunities: Strategic buys between 116,400–117,000 (pullback); confirmed breakout above 120,000 (target 130,000).
Risk zones: Below 116,000 (potential correction to 112,000–104,000), false breakout at the top.
Macro catalysts: Monitor Fed (next FOMC July 29-30), volatility on risk assets, geopolitical tensions.
Action plan: Prioritize stop management, stay reactive ahead of macro events. Main scenario: buy confirmed pullback or validated breakout.
__________________________________________________________________________________
Multi-Timeframe Analysis
__________________________________________________________________________________
1D / 12H: Bullish structure intact but facing historical resistance (120k), strong supports in place (104–107k).
6H / 4H / 2H: Consolidation below resistance, no signs of exhaustion, tactical supports at 116,000–117,000.
1H / 30min / 15min: Weakness on shorter timeframes (sellers at top), confirmation of range polarization. No emotional excesses (ISPD DIV neutral), standard volumes.
Risk On / Risk Off Indicator: Strong buy except for very short-term fatigue.
Summary:
Multi-horizon bullish bias, technical and sectoral confluence for upside extension if clear breakout >120,000. Key support to hold at 116,400–117,000. Buy dips, ride breakout up to 130,000. Focus on risk management, flexibility advised as macro (Fed) nears.
__________________________________________________________________________________
Key macro events to watch
__________________________________________________________________________________
2025-07-18: Fed rate/volatility debate (Equity, Bonds, BTC).
2025-07-29: FOMC (potential pivot for risk assets).
__________________________________________________________________________________
Strategic decision & final summary
__________________________________________________________________________________
Main bias: Bullish, to be validated at key levels, favor buying dips/breakouts.
Risk management: Stop below 116,000, scale out progressively after 125k, reinforced protection ahead of FOMC.
Opportunities: Pullback 116,400–117,000 (RR >3); H4/D breakout >120,000 targeting 130,000 (RR >2).
Monitoring: Macro (Fed, geopolitics), dynamic management according to market response to news.
Conclusion:
A validated move above 120,000 projects target to 130,000 (next statistical/on-chain extension). Deep dips can be bought above 104,000. Do not loosen risk management as Fed date approaches.
Riskon

Bitcoin facing breakout, active management recommended__________________________________________________________________________________
Technical Overview – Summary Points
Strong bullish momentum across all timeframes (MTFTI “Strong Up”).
Key supports: 110,483–111,949. Major resistances: 118,689–119,499.
Volumes normal to slightly elevated. No anomaly or climax.
Behaviour: early caution signals on ISPD DIV (4H–2H), sector “sell” trigger on the Risk On / Risk Off Indicator (15min).
__________________________________________________________________________________
Strategic Summary
Overall bullish bias on all timeframes. Structural uptrend confirmed, but early behavioural/sector divergence at short term.
Buy zones: pullback to 110,483–111,949. Stop/alert below 110,483 H4/H6 close.
Opportunities: tight trailing above 118,689 to capture extension. Partial take profit advised in upper range (118,689–119,499) if divergences persist.
Risks: geopolitical risk-off catalysts, start of selling extension, or loss of support.
Plan: active management required, avoid overexposure, plan for key break levels, readiness to exploit imminent breakout.
__________________________________________________________________________________
Multi-Timeframe Analysis
1D : Price above all pivots, strong momentum. Key resistance in play (119,499), supports at 110,483/105,054. Volumes normal, bullish alignment.
12H : Confluence of resistances (119,499–115,495), structure intact, buy opportunity on retrace. No major alert.
6H : Strong buying extension, pure momentum. No excess signals.
4H : First divergence (ISPD DIV “sell”). Consolidation on resistance, consider partial profit-taking.
2H : Bullish momentum but ISPD DIV “sell” and moderately high volumes. Localized euphoria risk.
1H : No excess, post-breakout consolidation.
30min : Extreme consolidation, decelerating volumes, possible fatigue.
15min : Sector “sell” trigger (Risk On / Risk Off Indicator “Sell”). Trend remains up, but caution is advised.
Multi-tf summary:
Bullish alignment across all horizons. Short-term behavioural caution, but trend remains unchallenged as long as above 110,483–111,949.
__________________________________________________________________________________
Synthesis & Strategic Bias
Multi-timeframe momentum confirmed, watch supports at 110,483–111,949.
Buy on valid retrace, take profit at highs if behaviour diverges.
Break below 110,483 (H4/H6 close) = invalidation signal.
Key triggers: geopolitical news, broken supports, selling spikes.
Base scenario: likely imminent directional breakout (volatility). Watch for spikes on major headlines.
__________________________________________________________________________________
Fundamentals and Macro News
Uncertain backdrop (Fed, US inflation, bonds & FX), no major macro trigger in 48h but latent volatility.
Crypto: Bitcoin stable, general accumulation, no violent distribution detected.
Geopolitics: rising tensions (Iran, Ukraine). Can prompt sharp risk-off if escalation occurs.
No major macroeconomic event scheduled (empty calendar).
__________________________________________________________________________________
On-chain Analysis
Accumulation phase for all holders, >19k BTC/month absorbed. Extreme volatility compression (coiling).
Realized & implied volatility is exceptionally low, setting up violent move.
ETF (IBIT BlackRock): record accumulation. Downside break could trigger psychological stress.
Baseline: technical & on-chain setup disfavors bears. Any exogenous shock accelerates volatility.
__________________________________________________________________________________
Strategic Recap & Action Plan
Bullish bias validated, risk of market fatigue on short-term signals.
Buy on controlled pullback, tight trailing at highs, partial profit-taking in 118,689–119,499 band.
Swing stop below 110,000 (H4); total invalidation if daily support fails.
Expect directional move + volatility on next impulse (8–48h).
__________________________________________________________________________________
Conclusion
BTC remains in a primary bullish trend, supported by on-chain accumulation and extreme structural compression. Only active management (profit, leverage, stops) optimizes R/R and prepares to respond to an imminent, directional volatility event. Stay proactive and plan!
__________________________________________________________________________________
Bitcoin Analysis: Risk under 108k, aiming 111k+ in continuation__________________________________________________________________________________
Technical Overview – Summary Points
__________________________________________________________________________________
Momentum: Strong uptrend across all major timeframes (MTFTI “up”). Buyers remain in control; daily/4H/1H structure robust.
Key supports: 108,239.1 (720min Pivot, critical transversal support), 105,054.7 (240min Pivot), 99,581 (240min Pivot). Active defense seen on 108,239.1 at all timeframes.
Main resistances: 110,630.1 (1D), 110,483.1 (240min), 111,949 (W). The 110–111k area acts as the short-term ceiling.
Volume: Moderate activity, no spikes or climaxes, slight intensification noted on the 30min during key tests.
Risk On / Risk Off Indicator: “STRONG BUY” signal on all Tfs ≥30min, contributing to marked bullish momentum. Minor short-term divergence only on 15min.
Multi-TF behavior: ISPD DIV and Investor Satisfaction are neutral, no extreme behavioral stress; psychology is balanced, neither panic nor euphoria.
__________________________________________________________________________________
Strategic Summary
__________________________________________________________________________________
Overall bias: Bullish, synchronized multi-timeframes, dominant bullish liquidity.
Opportunities: Optimal long entries on validated pullback to 108,239.1, add on breakout of 110,630–111,949. Gradual partial take profit recommended in the 111k area.
Risk zones: Invalidation below 108,239.1 (confirmed H2 close), risk of further correction toward 105k then 99.5k; suggested swing stop under 108,000.
Macro catalysts: No major event, global markets stable. Geopolitical tensions monitored, low short-term impact.
Action plan: Prioritize “buy the dip” on pivots, active monitoring for any breakout/failure. Dynamic stop management, partial profit-taking on extension.
__________________________________________________________________________________
Multi-Timeframe Analysis
__________________________________________________________________________________
1D: Very strong daily structure, high momentum, intermediate supports near 98k/100.5k. Watch for major resistances at 108–111k.
12H/6H/4H: Ranging below 110–111k resistance, no fragility. Supports 108,239.1 and 105,054.7 holding, no selling pressure detected. Watch for breakout/impulse.
2H/1H: Buy zone if maintained >108,239.1, risk of sell-off below this pivot toward 105k. Price is ranging, momentum remains positive.
30min/15min: Consolidation on supports. 15min: temporary divergence on the Risk On / Risk Off Indicator but bullish structure intact unless a clean break below 108,239.1.
Risk On / Risk Off summaries: Dominant “strong buy” tone, synchronized momentum, only weak short-term divergence. No behavioral stress (ISPD DIV neutral everywhere).
__________________________________________________________________________________
Cross-analysis and recommendations
__________________________________________________________________________________
Momentum: Bullish environment sustained as long as >108,239.1. Continued upside bias if breakout above 110–111k is confirmed.
Risks: No major vulnerabilities detected. Very low probability of a local top, except in the case of exogenous macro shock.
Macro & On-chain: Stable newsflow, no distribution from HODLers or significant new inflows. Preferred strategy: swing trading in trend direction, tight stop under the main pivot.
__________________________________________________________________________________
Decision summary
__________________________________________________________________________________
Preferred scenario: Hold long >108,239.1, add on validated pullback, look for breakout with volume extension to 111k+.
Risk management: Stop under 108,000, partial profit-taking in the 110,630–111,949 area.
No immediate macro constraints: Use this calm window to ride the trend.
Monitoring: Resilience of the main support, any sudden geopolitical shocks.
BTC/USDT keeps a clear bullish bias, favoring swing or trend-following strategies as long as key pivots hold. Buy the dips remains optimal while technical structure holds; strict stop management is advised pending any “breakout fail”.
Bitcoin Robust Bullish Structure, Key Entries at 105k & 100k__________________________________________________________________________________
Technical Overview – Summary Points
__________________________________________________________________________________
Bullish momentum confirmed across all timeframes : Structure remains healthy, no behavioral anomalies detected.
Key supports: Main HTF pivot around $98,000–$100,000; first intermediate support zone at $105,000.
Major resistances: Critical area between $109,000 and $112,000, dense pivot and volume profile confluence.
Volumes: Normal to very high depending on TF, no speculative excess; gradual rise hints at possible expansion phase.
Risk On / Risk Off Indicator : Strong Buy from daily to 1H, shifting to neutral on shorter timeframes (30min–15min).
ISPD DIV/Mason's line: Predominantly neutral histogram, no overheat or capitulation detected.
Multi-timeframe behavior: Robust underlying structure, increased volatility but no massive selling stress.
__________________________________________________________________________________
Strategic Summary
__________________________________________________________________________________
Global bias: Bullish dominance as long as $98k–$100k holds.
Opportunity zones: Buy on pullback to $105k, swing confirm above $111k with volume/ISPD validation.
Risk / Invalidation: Stop loss below $98k; extra caution on macro/Fed events.
Macro catalysts: Fed/NFP-US (July 2–4), monitor behavior via ISPD DIV (blue to red).
Action plan: Structured and tactical long bias, “no trade” zone before major US releases, immediate stop on support break.
__________________________________________________________________________________
Multi-Timeframe Analysis
__________________________________________________________________________________
1D: Bullish momentum, no overheat. Pivot 98–100k = strategic fallback.
12H–6H: Signs remain bullish, no anomalies, intermediate supports at 105–107k.
4H–2H: Positive consolidation, rising volumes; possible accumulation on 105k dips.
1H–30min: Multiple resistances under 110–112k, very high volumes, maintain vigilance for sudden spikes.
15min: Extreme volatility, but no clear seller excess; watch for “trap” formation.
Risk On / Risk Off Indicator : Strong Buy on main timeframes, shifting to neutral/buy on 30min/15min (breather zone).
ISPD DIV/Mason's line: No buyer capitulation, overall neutral histogram.
Summary: Bullish cross-timeframe alignment, only macro events may trigger a break.
Key economic calendar
- 07/02: Powell speech – Potential added risk-on boost.
- 07/02: US tariff updates – Possible volatility.
- 07/04: NFP, ISM... High expected volatility.
Action : Heightened caution pre-announcements, validate through volume/ISPD.
On-chain: Dominant HODLing, no dumping, stable institutional volume.
Macro: Fed, inflation, geopolitics under watch.
Tactical: Spot any warning via ISPD or volume cluster.
__________________________________________________________________________________
Conclusion & risk management
__________________________________________________________________________________
Strong bullish bias as long as $98k–$100k holds .
Optimal buy on $105k/$100k dips, swing confirm on $111k break .
Outside of US events: strict tactical discipline required .
Absolute invalidation zone: break below $98k (HTF + STH cost-basis) .
Remain vigilant for ISPD red + volume spike / macro headlines .
__________________________________________________________________________________

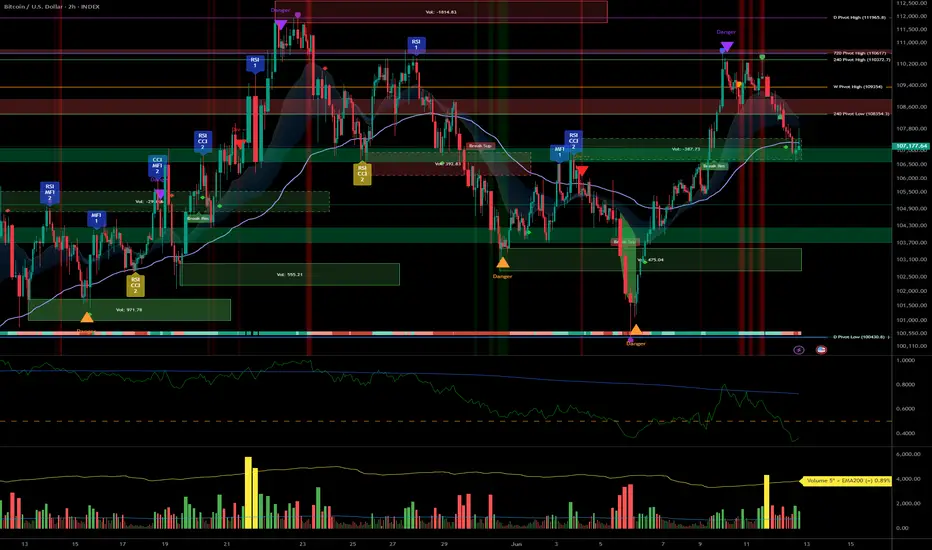
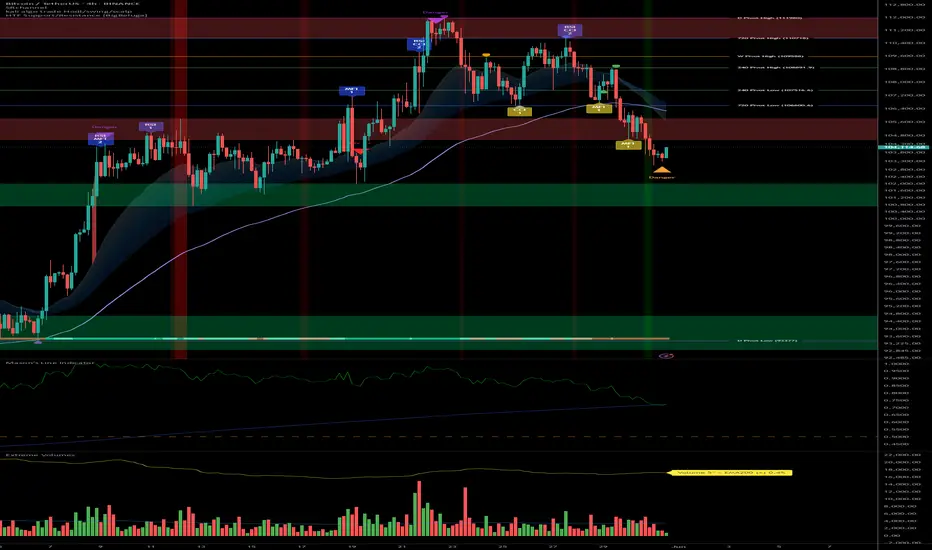
Upward Momentum, Caution Near 106,500–110,000 Resistance__________________________________________________________________________________
Technical Overview – Summary Points
Momentum: Strong bullish bias on mid/long-term (1D-4H), short-term "Down" divergences (1H/2H). Overall alignment, no capitulation/euphoria signals.
Key supports / resistances: Supports at 103,300/102,600 (D Pivot Low, 720 Pivot). Major resistances: 106,480–109,952. Price compression under daily/weekly resistance, technical rejection risk.
Volumes: Normal to moderately high, 1H abnormal volumes signal possible squeeze.
Multi-TF: Bullish confluence 1D–6H, short-term Down divergences, caution required for late long entries under resistance.
Risk On / Risk Off Indicator: "Strong Buy" signal consolidated across all timeframes except 15min (neutral ST), sector bullish.
ISPD DIV: Neutral on all TFs – no behavioral overheating or exhaustion.
__________________________________________________________________________________
Strategic Summary
Overall bias: Bullish HTF setup (1D–4H), buy opportunities on dips towards 103,300/102,600, stop <102,000.
Risk zones: 106,480–109,950 = resistance cluster, active management required. Technical invalidation below 102,000.
Macro catalysts: Window of increased volatility 15:00–16:00 UTC (CB Consumer Confidence & Powell speech). Middle East geopolitics = “wildcard”, caution on any escalation.
Action plan: Buy on pullback, manage actively >106,000, mandatory protection during news hours, reassess post-macro-volatility.
__________________________________________________________________________________
Multi-Timeframe Analysis
1D & 12H: Upward momentum confirmed, solid supports, no exhaustion signals, Risk On / Risk Off Indicator "Strong Buy".
6H–4H: Technical and behavioral confirmation, constructive volumes, caution near immediate resistances.
2H–1H: Short-term downside divergence, 1H very high volumes = potential squeeze or shakeout, active caution required under resistance.
30min–15min: Consolidation/digestion; Risk On / Risk Off Indicator neutral at 15min, no impulsive entry point yet.
Summary: Robust up-structure on HTF, buy-side strategies on dips favoured, active management imperative near resistance and macro volatility events.
__________________________________________________________________________________
Fundamental, On-Chain & Macro Risks Analysis
Macro news: No immediate catalysts except USD news (CB Consumer Confidence, Powell) at 15:00-16H00 UTC, source of temporary volatility – no prevailing trend in question at this stage.
On-chain / Market: High volumes, institutional leadership, no “retail” panic, no flush/fomo, healthy structure.
Leverage: OI >$95B, stablecoin dominance, risk contained except on external triggers (macro, geopolitical).
Geopolitics: Middle East context = spike risk, active management mandatory on escalation.
__________________________________________________________________________________
Summary:
• Dominant bias Up (buy on dips >102,600), active management below major resistances (106,500–110,000).
• Key stop <102,000 (invalidation).
• Increased risk window: 15:00–16:00 UTC (USD news).
• Monitor leverage, adjust exposure ahead of key catalysts.
EUR/CAD Long Bias🚀 EUR/CAD – Strong Long Opportunity Based on Multi-Factor Confluence
Over the past week, I conducted a comprehensive macro and sentiment-driven analysis across G10 FX pairs. Among several potential setups, EUR/CAD emerged as the most fundamentally and technically aligned long opportunity, supported by a confluence of high-probability signals across positioning, macro divergence, and capital flow sentiment.
🔍 Key Drivers Behind the EUR/CAD Long Bias:
1️⃣ Macroeconomic Divergence (ENDO View)
🇪🇺 Eurozone has shown relative stability in core macro indicators:
Inflation continues to cool, providing flexibility for ECB rate guidance.
GDP growth remains structurally flat but not contracting — suggesting resilience.
🇨🇦 Canada, on the other hand:
Shows a deteriorating inflation-growth mix.
Retail Sales and Industrial Production trends are softening.
ENDO analysis flags CAD as one of the weakest among G10 currencies.
2️⃣ Positioning – COT Report & Z-Scores
Speculative traders are increasing their long exposure to EUR (COT net longs rising +13,887 last week).
Z-Score on EUR long positions: +1.33 → statistically elevated interest in long EUR exposure.
CAD positioning is flat-to-negative, with no bullish buildup in speculative flows.
This gives EUR a clear relative edge in terms of speculative conviction.
3️⃣ Score & EXO Sentiment Framework
EUR/CAD is one of few pairs showing clear directional consensus across:
✅ EXO Score Sheet: Long Bias confirmed.
✅ RR_w Sheet: Strong risk/reward rating supports further upside.
✅ IR Forecast Sheet: ECB-CAD policy spread favors EUR strength in medium term.
4️⃣ Market Sentiment – Risk Regime
We are currently in a “Risk-On” sentiment regime, which generally favors currencies like EUR over defensive, commodity-linked currencies like CAD.
CAD tends to underperform in reflationary sentiment waves — especially when Oil fails to support the currency.
5️⃣ Cluster & Trend Confirmation
While not a primary factor, cluster analysis shows that EUR/CAD is not in a weak trend regime.
Trend alignment over 30 and 14 days remains favorable.
🔚 Conclusion:
EUR/CAD is one of the few pairs this week that aligns across all analytical fronts: macro, positioning, sentiment, and structure. In a crowded FX environment, such confluence is rare and valuable.

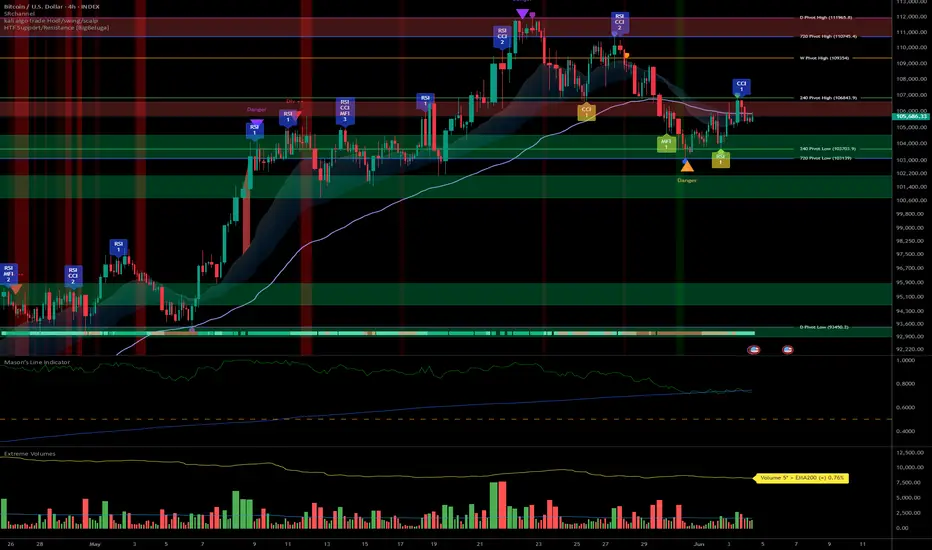
BTCUSDT: Strong bullish trend, 102k–106k supports heavily defend__________________________________________________________________________________
Technical Overview – Summary Points
__________________________________________________________________________________
Momentum : Bullish trend remains dominant from 1D down to 1H. Corrective consolidation on shorter timeframes (15/30min).
Key supports/resistances : 102,000, 104,800, 106,000 (key supports) – 109,500, 110,800–111,000 (major resistances and ATH zone).
Volume : Normal to moderately high depending on local volatility. No climax or distribution/absorption anomalies.
Multi-TF behaviour : Risk On / Risk Off Indicator at “Strong Buy” across all >2H timeframes, ISPD DIV neutral, no detected capitulation or excess behaviour.
__________________________________________________________________________________
Strategic Summary
__________________________________________________________________________________
Global bias : Strongly bullish on swing/daily horizon, healthy consolidation on short timeframes.
Opportunities : Favour swing entries on retests of 102k–106k supports, dynamic stops below 102k.
Risk zones : Break and close below 104,800, especially 102,000 = bullish bias invalidated.
Macro triggers : FOMC unchanged, stable US context, focus on upcoming inflation/employment data.
Action plan : Actively monitor pivot zones and on-chain behaviour; act on confirmed breakout signal or deep retest.
__________________________________________________________________________________
Multi-Timeframe Analysis
__________________________________________________________________________________
1D / 12H : Pivot support at 102k–106k, resistance 109.5k–111k. Bullish bias maintained, no excess volume, Risk On / Risk Off Indicator confirmed “Strong Buy.” Market remains mature, no concerning distribution.
6H / 4H : Structured supports 104.8k–106k, resistances 108.3k–110.8k. Healthy consolidation, swing buyers strong.
2H / 1H : Dense supports 105.6k–106.2k, barrier 109.5k–110.8k. Positive momentum, no extreme ISP/volume signals.
30min / 15min : MTFTI “Down” trend—micro-consolidation after extension. No stress, digestion/reload phase.
Multi-TF summary : Strong bullish alignment above 1H. Micro TFs in low-risk consolidation—entry opportunity on clear retracement.
__________________________________________________________________________________
Cross-analysis, synthesis & strategy
__________________________________________________________________________________
Confluences : Stable macro, on-chain & technical supports aligned, no panic or excess volume. Risk On / Risk Off Indicator “Strong Buy” dominates daily/swing horizons.
Risks/unexpected : Potential sharp volatility if breakout >111k or sub-102k support break.
Optimal plan : Defensive buying on support, tight stop <102k, active management post-macro data.
On-chain : Strong recovery since $101k, matured supply, solid STH cost basis at $97.6k.
Caution window : Wait for US data release before heavy positioning; favour scalping/swing on confirmed signal.
Objective : Leverage multi-indicator confluence, stay flexible/reactive if structural break.
BTC market retains strong bullish markers on all ≥1H timeframes. No behavioural or volume stress. Best approach: defensive buys near supports, tight stops, watch for macro releases. Stay reactive to ATH breakout or support break—act on confluence, adjust if structure fails.
__________________________________________________________________________________
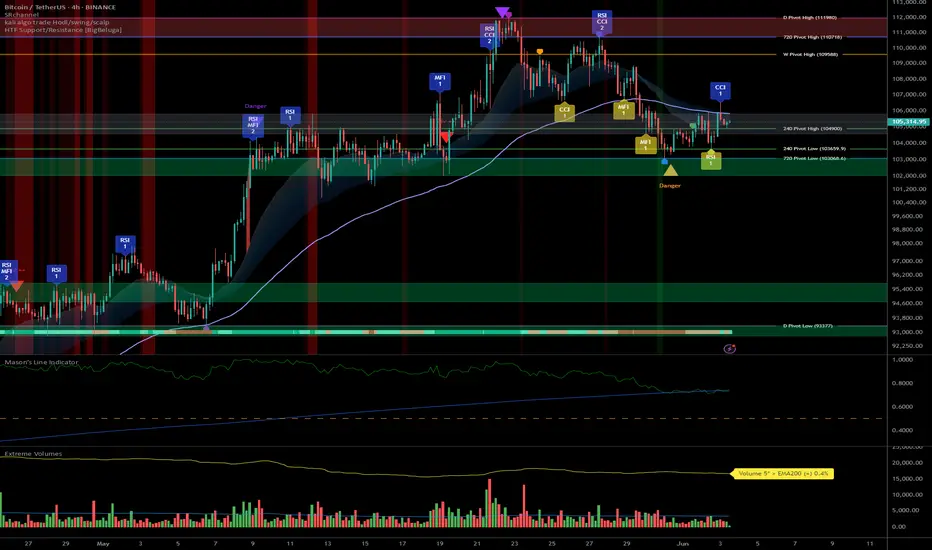
Tactical BTCUSDT Swing: Persistent Risk On, Key Stop at 103,000__________________________________________________________________________________
Technical Overview – Summary Points
__________________________________________________________________________________
Momentum: Strong bullish sectoral momentum (Risk On / Risk Off Indicator on strong buy across all timeframes), but momentum is fading just below key resistances.
Supports/resistances: Key 104,179–103,086 area tested on every timeframe, consolidating a major price floor. Upside targets: 109,588 then 111,980.
Volume: Stable liquidity, no anomaly spike or structural rupture. Volumes consistent with trend; moderate pickup in activity near supports, no climax.
Market behavior: Investor Satisfaction Indicator is neutral on all timeframes except 1H (behavioral buy signal to monitor). No euphoria or panic, no aggressive accumulation.
__________________________________________________________________________________
Strategic Summary
__________________________________________________________________________________
Global bias: Cautiously bullish as long as 104,179–103,086 pivot support holds. Risk On / Risk Off Indicator gives a strong bullish sector signal. Macro backdrop neutral, low volatility.
Opportunities: Swing timing on pullback to support confirmed on 1H/4H, targets 109,500/111,980. Wait for daily/4H confirmation before full allocation.
Risk zones: Strong invalidation under 103,086, alert under 104,179. Suggested technical stop-loss below 103,000 USDT.
Macro catalysts: Watch ECB and Fed (8:30–9:45 UTC, Thursday). Expect possible volatility spike, adjust sizing and stop accordingly.
Action plan: Active swing trading off support, dynamic stops, partial exposure ahead of major events. Active risk/reward management (>2.5), upside targets on technical pivots, liquidity is normal.
__________________________________________________________________________________
Multi-Timeframe Analysis
__________________________________________________________________________________
: Global uptrend but fading momentum below ATH. Major support 104,179–103,086, no clear behavioral signals. Risk On / Risk Off Indicator strong buy, volumes stable.
: Strong tech sector bias (Risk On / Risk Off Indicator strong buy), support at 104,179. ISPD DIV neutral, volumes normal.
: Pause/consolidation above multidimensional support (104,179). Healthy but cautious structure.
: Consolidation >104,179, long positioning remains valid as long as support holds; no clear short-term behavioral inflow.
: Testing key support, first signs of indecision. Increased watchfulness recommended.
: First short-term behavioral buy signal (ISPD DIV/mason's), optimal tactical allocation timing if 104,179 support is defended.
: Intraday range on support, no emotional spike or break volume.
: Local flush, defensive rebound off support, short-term range scenario; potential technical bounce.
Cross-timeframe summary:
- 104,179 is the key defensive multi-support area, tested across all TFs.
- Risk On / Risk Off Indicator is bullish across the board, except behavioral divergence (ISPD DIV Buy on 1H only).
- No panic or rupture volumes detected.
- Immediate risk if breakdown below 104,179 and/or 103,086: opens door to intraday bearish extension toward 93,377.
__________________________________________________________________________________
STRATEGIC OUTLOOK – Final Summary
__________________________________________________________________________________
Technical setup: Solid consolidation above 104,179/103,086 supports, sectoral buying confirmed. No major deterioration unless a clear breakdown occurs.
Opportunity: Short-term swing entry on 1H/4H signal, target 109,500–111,980. Stop-loss below 103,000 advised.
Risk: Downside acceleration if support breaks, especially if LTH profit taking continues or spot demand fades.
Macro: Calm backdrop, ECB and Fed decisive for short-term volatility. Watch post-announcement market action.
On-chain: Significant profit-taking near highs, no euphoria, positive risk/reward if stops are respected.
Operational summary:
Cautiously bullish while 104,179/103,086 hold.
Tactical swing entry possible on pullback and confirmed signal (1H or 4H).
Strict stop management below 103,000, reduced exposure before key ECB/Fed events.
Upside targets: 109,588 – 111,980.
Monitor volumes and behavioral signals post-news.
Key levels to watch:
Supports: 104,179, 103,086
Resistances: 109,588, 111,980
Macro alerts: ECB/Fed (Thursday morning, 8:30–9:45 UTC)
Behavioral ISPD DIV signal after news
Suggested stop-loss : < 103,000 USDT (as of 01/06/2025, 22:56 CEST)
Comprehensive analysis based on multi-timeframe technical structure, Risk On / Risk Off Indicator and ISPD DIV behavioral/mason's confirmations. Remain disciplined and flexible in risk management.
__________________________________________________________________________________

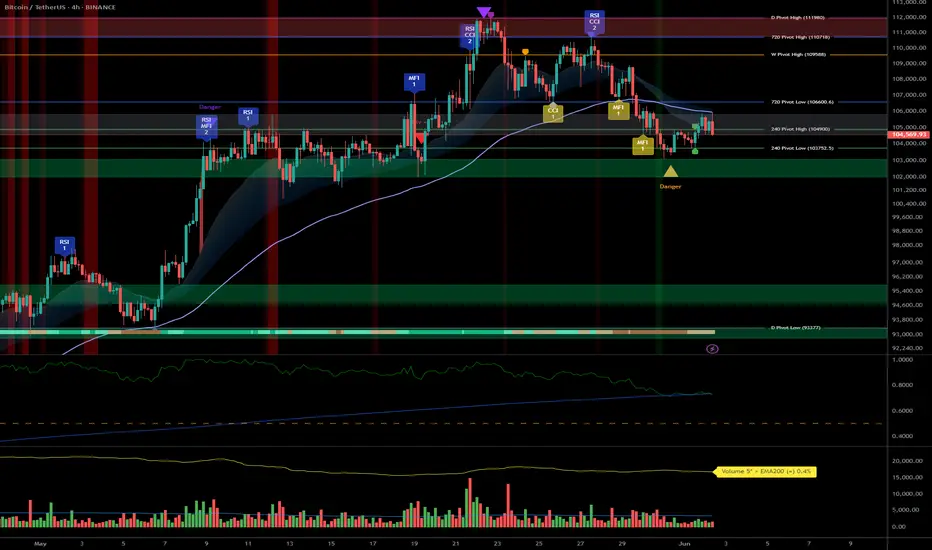
BTC at resistance: tactical swing plan for bulls <106.7k __________________________________________________________________________________
Technical Overview – Summary Points
__________________________________________________________________________________
Momentum: Dominant bullish structure across all timeframes, major resistance at 106.7k–112k.
Supports/Resistances: 106743 (multi-TF pivot), 103000–105000 (key supports). Price compressed below main resistance.
Volume: Normal to moderately high, a few occasional yellow spikes, no massive distribution or capitulation.
Behavior Multi-TF: Risk On / Risk Off Indicator bullish at every horizon. Behavioral indicator (ISPD DIV) in constant buy zone, no orange anomaly.
__________________________________________________________________________________
Strategic Summary
__________________________________________________________________________________
Overall Bias: Bullish structure intact, sustained momentum up to the critical 106.7k–112k resistance.
Opportunities: Swing entries on 103–105k support clusters, long scalps on 15–30min signals, partial exits near/under key resistances.
Risk Zones: Confirmed break below 103k = major bearish alert, repeated rejection below 106.7k–112k = risk of extended/distributive range.
Macro Catalysts: US data (ADP, ISM, PMI), stablecoin/GENIUS regulation. High-volatility windows expected during major news (03/06–04/06).
Action Plan: Active management, progressive reinforcement on pullbacks, controlled exposure below resistance, stop-loss advised < 103k.
__________________________________________________________________________________
Multi-Timeframe Analysis
__________________________________________________________________________________
Daily: Pivot High 1D: 111949/ Pivot Low 1D: 93337.4. Stalled below 106.7k–112k. Normal volume, strong software sector/ Risk On / Risk Off Indicator buy signal, healthy behaviors.
12H – 4H: Compression in 104.5k–106.7k/109.9k. Cautious bullish bias, localized volume clusters, all buy signals except on immediate resistance tests.
2H – 1H: Technical pullbacks at 104k, micro-range 105–106k. Momentum intact, 15–30min buy signals on every support retest.
30min – 15min: High intraday volatility, liquidity absorption at supports, active ranging phase. Risk On / Risk Off Indicator and ISPD consistently bullish.
ISPD & Risk On / Risk Off Indicator Summary: Buy alignment across the board, no behavioral deviation, strong sector support.
__________________________________________________________________________________
Summary:
BTC/USDT remains capped beneath the 106.7k–112k resistance, but all multi-TF, behavioral, and sector signals stay bullish above 103k. Favored setup: active management around supports, prudent profit-taking below resistance, intensified macro monitoring.
__________________________________________________________________________________
BTC/USDT: Strong Bullish Alignment, All Signals Green (01/06/25)__________________________________________________________________________________
Technical Overview – Summary Points
__________________________________________________________________________________
Momentum: Bullish structure confirmed by Risk On / Risk Off Indicator (“BUY” across all timeframes).
Key Supports: 103k–104k, consolidated on every horizon (1D to 15min).
Resistances: 105.5k–108k (short-term), 110k as a main pivot.
Volume: Moderately high, with no climax or distribution signals.
Behaviour: Proprietary indicators (ISPD DIV) show strong bullish confluence across timeframes; no divergences or significant bearish signals.
__________________________________________________________________________________
Strategic Summary
__________________________________________________________________________________
Directional Bias: Dominant bullish bias across all timeframes.
Opportunities: Tactical entries on pullbacks to 103k–104k, main exits >108/110k.
Risk: Invalidation below 101k; watch for extreme volumes or major macro catalysts.
Catalysts: Strong global risk-on dynamics (tech rally, institutional flows, weak USD); monitoring SEC regulation and macro events (NFP, CPI, FED).
Plan of action: Buy defended support zones, reduce on exuberance >110k, dynamic stop below 101k, stay reactive ahead of major events.
__________________________________________________________________________________
Multi-Timeframe Analysis
__________________________________________________________________________________
1D: Major resistance at 110k (Pivot High), strong support 101–104k, Risk On / Risk Off Indicator “BUY,” healthy volume; maintained momentum.
12H: Confluent resistance 105.5–110k, support 102.5–104k, bullish indicators, no divergence or volume climax.
6H: Resistances 105.5/108k, solid support 103–104k, strict bullish confirmations.
4H: Clustered resistances 105.5/108k, dense support 103–104k, digestion phase in volume (healthy consolidation).
2H: Major pivots 105–108k, supports 103k/101.5k, strong demand on pullback.
1H: Barriers 105.5–106k, support 103.4–104.2k, no bearish signals.
30min: Spot resistance at 105.5k+, support 103.8–104.2k, microstructure favors buying, weak selling pressure.
15min: Support 104k, resistance 105.5–106k, intraday flow remains pro-buy on weakness.
Risk On / Risk Off Indicator: Consistent “BUY” signal across all timeframes — sector and behavioural momentum alignment.
ISPD DIV: Positive histogram, no red zones or distribution alerts.
Volumes: Normal to moderately high, no climax suggesting trend end.
Summary: Strong multi-timeframe technical alignment. Bullish momentum, firmly defended supports. No imminent reversal signals, healthy consolidation within dominant risk-on trend.
__________________________________________________________________________________
Strategic & Fundamental Synthesis
__________________________________________________________________________________
Technical bias: Strong bullish conviction as long as 103–104k is defended, supported by Risk On / Risk Off Indicator/ISPD.
Fundamentals: Macro momentum (Nasdaq/US tech rally, weak USD), OI and spot dominance high, growing euphoria (ATH ~111k), watch for potential distribution if buyer exuberance peaks (P/L ratio 12:1).
Scenarios: Buy on defended flows 103–104k, TP >108–110k; caution on extreme volume at support.
Macro: Anticipate reactions to major events (NFP, CPI, FED). If a key event is due within 48h: prudence, adapt post-release.
Opportunities: Potential rotation to altcoins (SOL/ETH), short-term swing as BTC momentum pauses.
Momentum prevails, but caution warranted on any volume spikes or major macro headlines. Market remains a buy at support, optimal strategy is dynamic pullback/TP management, strict discipline in case of high-volume sell-off.
__________________________________________________________________________________
Actionable Summary
__________________________________________________________________________________
Entry: Buy securely on 103–104.2k zone
Stop: Hard invalidation if <101k (on volume)
Take Profit: 108–110k+
Risk: Excessive on-chain euphoria, violent support break
Stay agile near major releases and watch flow rotations (BTC/ALT)
__________________________________________________________________________________
BTCUSDT: Strong Risk-On Signal, Optimal Swing Above 103k__________________________________________________________________________________
Strategic Summary
__________________________________________________________________________________
Global bias : Dominant bullish structure, confirmed sector momentum, “risk-on” technical setting.
Opportunities : Favored swing entries above supports (103703.7–107019.9), breakout plays at 104865/106537.
Risk zones : Technical invalidation below 103703.7 or rapid ISPD DIV deterioration (red/orange zone + extreme selling volumes).
Macro catalysts : Rate, inflation/PCE, job numbers publication (48–72h) – to monitor closely for volatility pivots.
Action plan : Tight stops below supports, partial profit-taking on resistances, reduce exposure before key macro events, re-enter post-announcement on confirmed direction.
__________________________________________________________________________________
Fundamental & Macro Analysis
__________________________________________________________________________________
Favorable macro momentum (BTC, ETH, equity indices, institutional trust). Bull-cycle confirmation via technical triggers (bullish cross, MACD divergence).
Risks : Major token unlocks coming (3.3B+), on-chain euphoria (extreme profit/loss, exchange dominance >33%). Dynamic risk management crucial – swing stop-loss < 103703.7 is imperative.
Events to watch : US rates, inflation/PCE, payroll data – periods of heightened volatility expected, necessitating exposure adjustment.
Swing trade plan : Defensive entries on key supports, reduction pre-announcement, gradual profit-taking below 106537, then 109952.8/111949.
Risk/reward : Optimal for swing trades near supports, tactical management required for breakout chasing.
__________________________________________________________________________________
Multi-Timeframe Analysis
__________________________________________________________________________________
1D (Daily) : Bullish structure intact, key supports (107019.9, 81075.6). Risk On / Risk Off Indicator remains “Strong Buy”. No excess in volumes or behavior – buyers’ climate.
12H – 6H : Solid momentum above 103703.7–106537. Risk On / Risk Off Indicator still “Strong Buy”, ISPD DIV neutral, standard volumes.
4H – 2H – 1H : Pivot range (103703.7/104865/106537), buyer momentum, swing/scalp strategies favored. Supports to watch: 103703.7 (main stop trigger).
30min – 15min : Tight range (103703.7/104865), Risk On / Risk Off Indicator “Buy” (slightly weaker on 15min). Tactical scalping on bounce or pivot breakouts – risk zone if range breaks sharply.
Summary : Sectoral outperformance on all timeframes via the Risk On / Risk Off Indicator, ISPD DIV neutral, normal volumes. Key pivots: 103703.7 (support) and 104865/106537 (resistances) frame all action. Swing trading optimality as long as these levels hold.
__________________________________________________________________________________
Conclusion
__________________________________________________________________________________
BTCUSDT market remains bullish on all timeframes, supported by strong sector momentum (Risk On / Risk Off Indicator), steady volume and behavioral stability (neutral ISPD DIV). Preference remains for long strategies on support, with increased vigilance around macro windows (events, unlocks). Strict stop discipline and active profit-taking are key on extension moves.
__________________________________________________________________________________
BTC/USDT – Bullish Bias with Short-Term Accumulation Signals __________________________________________________________________________________
Technical Overview – Summary Points
__________________________________________________________________________________
Momentum (Risk On / Risk Off Indicator): Persistent strong buy signal across all timeframes (1D to 15min), reflecting a sustained bullish bias and tech sector outperformance.
Support/Resistance Zones: Major support at 99.5–103k repeatedly tested across intraday charts; resistance cluster between 108–112k continues to act as a strong technical ceiling.
Behavioral Indicator (ISPD): Neutral on HTF (1D/12H), but shows buy signal on 1H–30min with strong accumulation patterns. Flat readings on other frames indicate no panic or euphoria.
Volume Profile: Normal volume across all timeframes, absence of climactic spikes or signs of local capitulation/euphoria.
Behavior Summary: Bullish structure remains intact, but market is at an inflection point. Short-term accumulation visible, especially below 104k.
__________________________________________________________________________________
Strategic Summary
__________________________________________________________________________________
Bias: Clearly bullish, supported by strong momentum and institutional flows into Bitcoin and the tech sector.
Opportunities: Tactical buy zone on retracements toward 99.5–103k. Intraday scalping possible with tight stops below 99.5k, targeting resistance zone at 108–112k.
Risk Zones: Break below 99.5k could trigger high-volatility liquidation down to 91k. Multiple resistance failures under 108–112k may prompt a sharp pullback.
Macro Catalysts: ETF inflows and equity risk-on backdrop boost technical signals. Lack of macro news shifts dominance to technicals and crypto narratives.
Execution Plan: Accumulate near 103k on dips. Manage trades actively under resistance. Avoid chasing breakouts without confirmation. Monitor ISPD for behavioral shifts.
__________________________________________________________________________________
Multi-Timeframe Analysis
__________________________________________________________________________________
1D – Macro Context
- Resistance: Strong cluster between 108–112k from daily/weekly pivots.
- Support: Long-term structural base down at 74–92k.
- Risk On / Risk Off Indicator: Strong Buy
- ISPD: Neutral – no extremes.
- Volume: Normal.
- Summary: Market is stretched above its macro base but retains strength; no acceleration or behavioral stress.
12H – Inflection Zone
- Resistance: 104–112k cluster.
- Support: Secondary pivots (240–720min).
- Risk On / Risk Off Indicator: Strong Buy
- ISPD: Neutral.
- Volume: Normal.
- Summary: At a decision zone; momentum intact, awaiting directional confirmation.
6H – Lateral Strength
- Resistance: 104–112k convergence.
- Support: 99.5k key.
- Risk On / Risk Off Indicator: Strong Buy
- ISPD: Neutral.
- Volume: Normal.
- Summary: Short-term consolidation inside a rising structure.
4H – Under Pressure
- Resistance: 108–112k confluence.
- Support: 99.5k.
- Risk On / Risk Off Indicator: Strong Buy
- ISPD: Neutral.
- Volume: Normal.
- Summary: Risk of false breakout. Tactical caution needed.
2H – Trading Range
- Resistance: 104–108k.
- Support: 99.5k.
- Risk On / Risk Off Indicator: Strong Buy
- ISPD: Neutral.
- Volume: Normal.
- Summary: Consider tactical entries near range base; no seller climax detected.
1H – Emerging Reversal
- Resistance: 108–112k.
- Support: 103k, 99.5k.
- Risk On / Risk Off Indicator: Strong Buy
- ISPD: Buy – signal of behavioral accumulation.
- Volume: Normal.
- Summary: Signs of reversal from bearish accumulation; watch for confirmation above 104k.
30min – Low-Risk Entry Setup
- Resistance: 105k–108k.
- Support: 103k.
- Risk On / Risk Off Indicator: Strong Buy
- ISPD: Buy – strong behavioral signal.
- Volume: Normal.
- Summary: Contrarian long setups favored; tight stop strategy under 103k.
15min – Caution on Fade
- Range: 103–105k.
- Risk On / Risk Off Indicator: Buy.
- ISPD: Neutral.
- Volume: Calm.
- Summary: Market in cleansing phase; scalps possible, but avoid overconfidence due to short-term softness.
USD Price Action Correlation with Bitcoin PriceIn the later stages of the liquidity cycle you have a devaluation of USD leading to bitcoin breaking out of its bullish trend into a parabolic trend.
-Last 2 cycles this predictive correlation leaded bitcoins breakout by 4 to 6 months.
-Current cycle DXY/Bitcoin charts look very similar to 2018
Taking this correlation into account, we could likely see the bullish trend on Bitcoin transform into a parabolic trend sometime between May and June. Meaning, we are in the final stages of a bottoming in Bitcoin at the time of this post, likely about to continue bullish momentum as we just went through significate market strain. Removing the possibilities of another Black Swan event, like a major geopolitical event but it is my belief that this was already priced in from the markets reaction just this month. This being said, there are no certainties. Things could always get worse. Time will tell, but given my aforementioned annalists, the buying opportunity at this current point is to great to ignore. Reward greatly outweighing the risk.

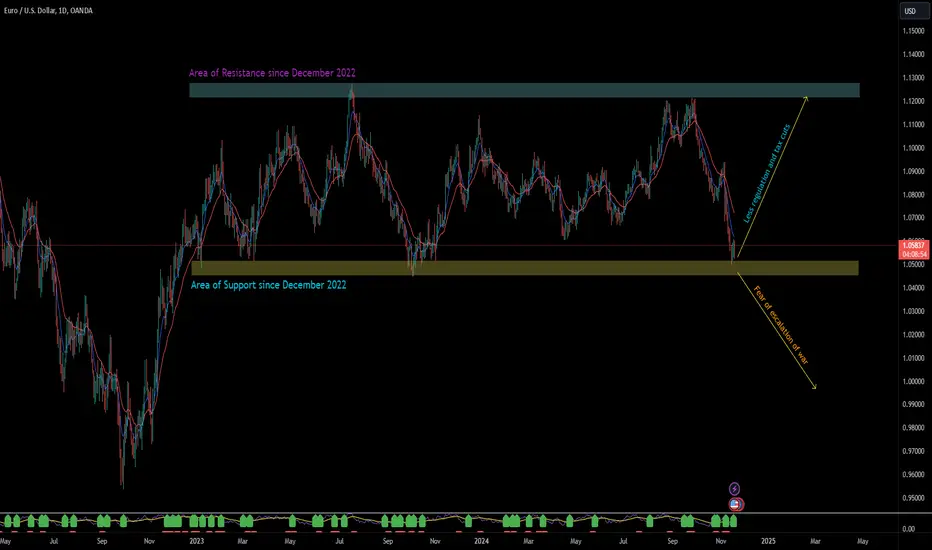
Fundamental Analysis of EURUSDEURUSD is trading in the support area which has been respected by the price action since December of 2022. Similarly, there is an area of resistance.
There are two scenarios based on the current geopolitical tension and the policy of the new administration in the US.
Scenario#1: Risk OFF or USD depreciates against EUR and other currency pairs
The new US administration will take charge in Jan 2025, and by that time if the Scenario#2 has not happened then the EUR should appreciate significantly against USD. The new administration is expected to be business friendly. The US economy should get an ultra-boost because of lower taxes and less regulations.
There are many other promises made by the winning party like the increase in import tariffs on all the countries, deportation etc., maybe those promises were to attract voters. We don't know how it will play out, so we go with the simple approach that republican party means less regulation, hence business friendly.
Scenario#2: Risk ON or USD appreciates against EUR and other currency pairs
This scenario could play out even before the new administration takes charge!!! We don't know if it is a bluff from Russia or a real threat, but the fear of nuclear war can be frightening. Whenever there are major escalations in the world, the USD appreciates and that is as simple as 1 + 1 = 2, right?
Risk-On or Risk-Off? Stocks vs. Bonds Introduction:
With stocks reaching new all-time highs and market sentiment edging into euphoria, it's an opportune time to revisit a classic risk-on/risk-off indicator: the ratio between stocks AMEX:SPY and long-term bonds NASDAQ:TLT . This ratio provides a clear view of investor sentiment:
Risk-On: When SPY outperforms TLT, investors favor equities for their higher potential returns.
Risk-Off: When TLT outperforms SPY, it reflects rising risk aversion and a move toward safer assets like bonds.
Analysis:
Uptrend Intact: Currently, the SPY-to-TLT ratio remains in a clear uptrend, defined by a series of higher-highs and higher-lows. This sustained upward momentum signals continued confidence in equities.
Ascending Channel: The ratio is also rising within an ascending price channel, a bullish continuation pattern. As long as this structure holds, the market can be interpreted as firmly in risk-on mode.
What to Watch:
Channel Support: A breakdown below the channel’s lower boundary would be the first sign of caution.
Higher Highs: If the ratio continues to push upward, it would confirm further bullish sentiment in equities.
Conclusion:
The SPY-to-TLT ratio is a key barometer for risk appetite, and its sustained uptrend within the ascending channel is a clear signal of the market’s risk-on posture. As long as this trend holds, equities remain in a favorable position. However, traders should stay vigilant for any signs of a breakdown, which could hint at rising market caution. Are you aligned with this risk-on outlook, or do you see potential cracks forming? Share your thoughts below!
Charts: (Include charts showing the SPY-to-TLT ratio, the ascending price channel, and key trendlines for support and resistance)
Tags: #SPY #TLT #RiskOn #RiskOff #Stocks #Bonds #TechnicalAnalysis #MarketTrends

Risk ON-Bearish stance on Dollar indexFor longer Term I'm focusing on 99.500 level which is 15 July 2023 low.
As price already clear the Buyside liquidity which was resting above Oct 2023 High.And price broke the Bullish structure on daily Time Frame and now price is accumulating shorts for the new move.In my opinion dollar is making its anchor point for the move.

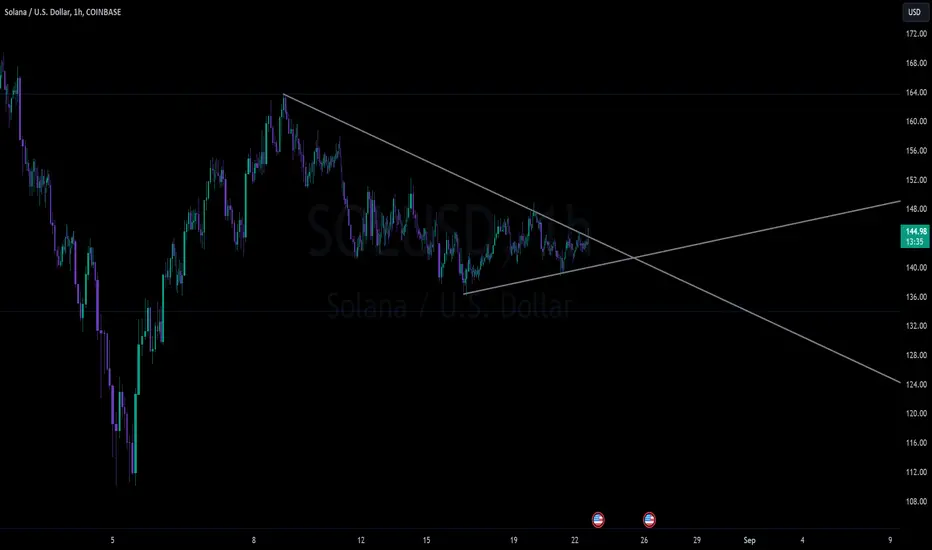
SOL / USD ConsolidationNeutral consolidation for a week heading into major economic data. Any sort of risk-on response from the overall market could lead to significant upside. However a breakdown could flush out a lot of bulls in quick fashion.
Upwards price targets of: 151, 158, 163, and 184+
Downwards price targets: 134, 110, 104
Bitcoin Breaks Record, Shrugs Off Risk-On Label Gold extended gains for a third consecutive session, crossing $2,650 per ounce, as investors sought safety following an escalation in the Russia-Ukraine conflict.
Meanwhile, Bitcoin is also performing well and doesn't appear to be acting totally as a risk-on asset in this environment, surging to a fresh record high. President-elect Donald Trump’s administration is reportedly considering a dedicated cryptocurrency policy role within the White House, Bloomberg reported.
Adding to Bitcoin's momentum, the Financial Times revealed that Trump Media and Technology Company is in advanced talks to acquire crypto trading platform Bakkt.
Bitcoin remains above key technical levels, including the 50- and 100-day EMAs, while the RSI hit overbought territory at 80.

Semiconductors vs. Nasdaq: Key Indicator of Tech MomentumIntroduction:
The ratio between semiconductors NASDAQ:SMH and the Nasdaq 100 NASDAQ:QQQ serves as a key indicator of tech sector momentum and near-term risk sentiment. When SMH outperforms QQQ, it signals a "risk-on" environment, reflecting strong demand for semiconductors and overall tech sector health. Conversely, if QQQ outperforms SMH, it suggests a "risk-off" environment, pointing to concerns over weakening chip demand.
Analysis:
Risk Sentiment: The SMH-to-QQQ ratio provides insights into tech momentum. A higher SMH performance often indicates robust chip demand, a positive signal for the broader tech sector. On the other hand, when QQQ outperforms, it signals caution, possibly reflecting waning demand for semiconductors.
Bullish Outlook: Recently, the SMH-to-QQQ ratio has formed a higher low, reinforcing a bullish outlook for semiconductors. This higher low is a positive sign not just for the semiconductor industry but for the broader market as well, as semiconductors often lead market rallies.
Conclusion:
The recent bullish signal in the SMH-to-QQQ ratio suggests tech sector strength, with semiconductors likely leading the way. This is a critical metric for assessing near-term market momentum, so traders should keep a close eye on this ratio to gauge potential shifts in sentiment. What’s your take on this trend? Feel free to share your thoughts in the comments!
Charts: (Include relevant charts showing the SMH-to-QQQ ratio and the higher low formation)
#Semiconductors #Nasdaq #TechSector #SMH #QQQ #RiskOn

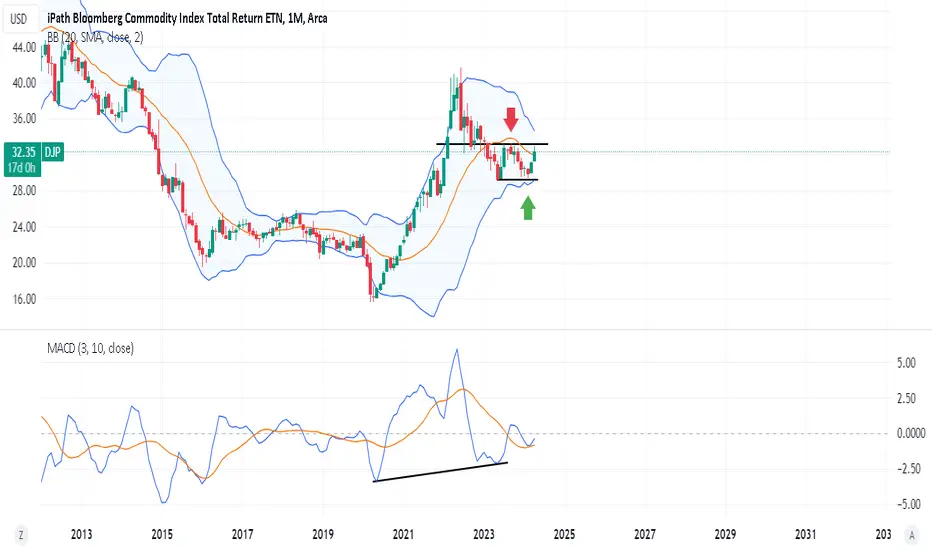
commodities high conviction entry in FebLooking back, commodities had a high conviction in february based on a longterm trend. Combining macd and BB break out.
Markets have either risk-on sentiment or defensive. During risk-on phase people want to put money to work, there is too much money. During risk-off or defensive, people want money and safety. Assets become too expensive. Bitcoin rallies during risk-on phases. Oil or gold can be either risk-on and risk-off . Markets are fascinating.
Faang can be a risk-on and risk-off, till everything becomes too expensive to have.
Markets leave clues. and they move on cycles.
It makes sense why commodities are risk-off . Small caps usually are risk-on (when economy does well, there are no global conflicts; ie the future is BRIGHT).
More concerns move the weight to risk-off , ie markets are a weighing machine longterm.
People tend to be stuck in one mood or another, and it's tough to adjust? markets can change gears quickly.
The most important chart in your trading career.Merry Christmas to all, I hope you and yours are well.
My present to you this year is the one chart you should ALL be watching. SPX/GOLD
Risk On (Equities), Risk Off (Gold). It will save you a TON of time/headaches, if you follow this chart.
In this video I go over why you should use it. How your portfolio would have been managed the last 50yr, and at the end give a quick method for managing your ratio between Risk On/Off.
As always, good luck in your trading, have fun, and practice solid risk management.

A clear risk on event is taking placeI multiplied the less risky Dow and Spy while dividing it with a multiple of bio, the Russel and Ark. This shows a clear shooting star candle in development this month which should signal much greater future gains in higher risk stocks and an end to this pullback in the market.
You can see that we had nice rallies the last two times that this has happened on this chart at March 2020 and Feb 2016.
I also noticed some more supporting evidence that this is near the bottom from the dark orange wedge breakout. If you measure the bottom to the peak in 2015-16 you can get an ideal exit target for the wedge breakout. Typically, you would measure from the breakout point, which it hasn't reached at this time, but if you measure from the bottom, you can see that the target has interestingly been reached to an almost exact amount.
We also have the yellow resistance and the peak at March 2020 as a pivot point for all of these lines. Not too critical of a point, I just found that interesting haha.
We also have institutions like black rock capitulating on growth twitter.com
Many institutions were bearish on the market at the bottom of the covid dip.
Finally we have a heavily overbought RSI and stoch on the monthly that also signals a top.
Now the short term future outlook looks bullish on risk to me but I was thinking on potential long term possibilities from there:
I believe that the yellow trajectory is more likely to happen over the blue one at this point to be honest. The blue option just requires too much competence in all global leaders to pull off so it seems unlikely to me and would be frankly miraculous. But it could still happen.
The yellow one would basically give investors an opportunity to exit growth at more reasonable prices before the market continues its tank fest again. And while I have this pivot point at Jan 2024, it could happen much steeper and faster and pivot later this year.
The yellow support line and the blue breakout line are most important to watch and see what option it'll be.

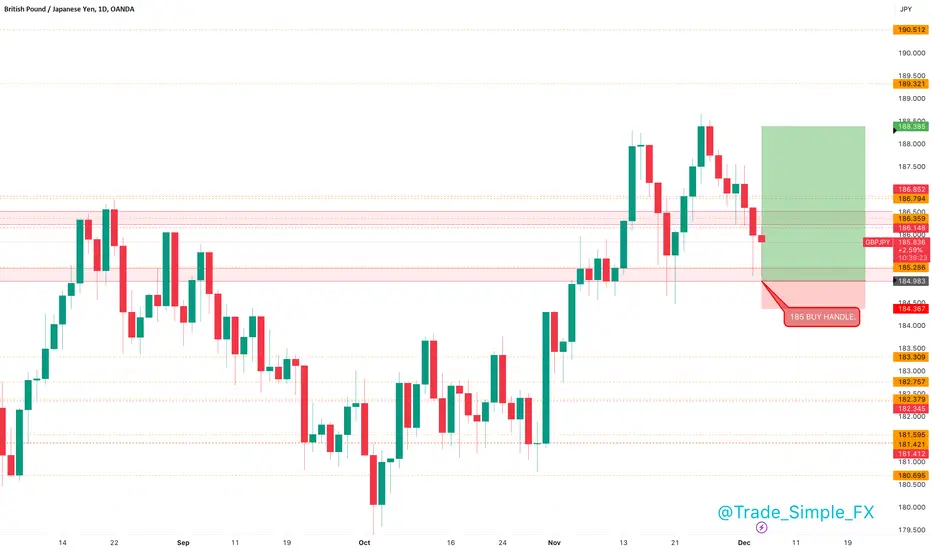
GBPJPY D1 - Long SignalGBPJPY is flirting between this 185 support price and 188 region, a solid 300 point range, we are hopeful to see a pullback and another opportunity to enter long from this 185 psychological price zone. From here we can look to targets 1R, 3R, 6R respectively.
A lucrative setup, with lots of mileage upside, nothing to say we can't target 190.00.