BREXIT & GEO-POLITICAL AFTERMATH: SHORT GBPUSD - HOW TO TRADEGBPUSD
- At the end of last week GU traded to lows of 1.32 on the brexit vote, before retracing substantially to 1.39 by the end of the day.
- GU retraced 600-700pips after the brexit event IMO solely as investors took profit from their shorts (which causes buying) - thus there was no structural reason for GU recovering e.g. it was that 1.32 had mispriced GU too low for the brexit vote.
On the back of this I expect the following for GU this week:
1. I have a 8/10 short conviction on GU and ultimately believe it will trade <1.30 by weeks end for the following reasons: -
- As on friday, the bearish movements we saw on GBP were 90% fast money trades and NOT real/ slow money positioning (due to different regulations and trading strategies) therefore, this week, slow/ real money will now be able to get behind the short sterling move thus providing momentum for GBP to move lower and sub 1.30.
*Fast money is hedge funds and slow money is asset managers*
- David Cameron UK PM also resigned following the result, thus putting further downside expectations on GBP in the near-medium term particularly as it as all come at once.
- Also the BOE plans to increase its QE by 66% 350bn to 600bn to support markets but this printing increasing GBP money supply affect puts downward pressure on the GBPUSD.
- Further, members of the European parliament have asked and put pressure on the UK to make their exit faster than previously expected, this puts further uncertainty around the brexit and increases the negative impact it may have on the economy and therefore the GBP speculation is made further bearish.
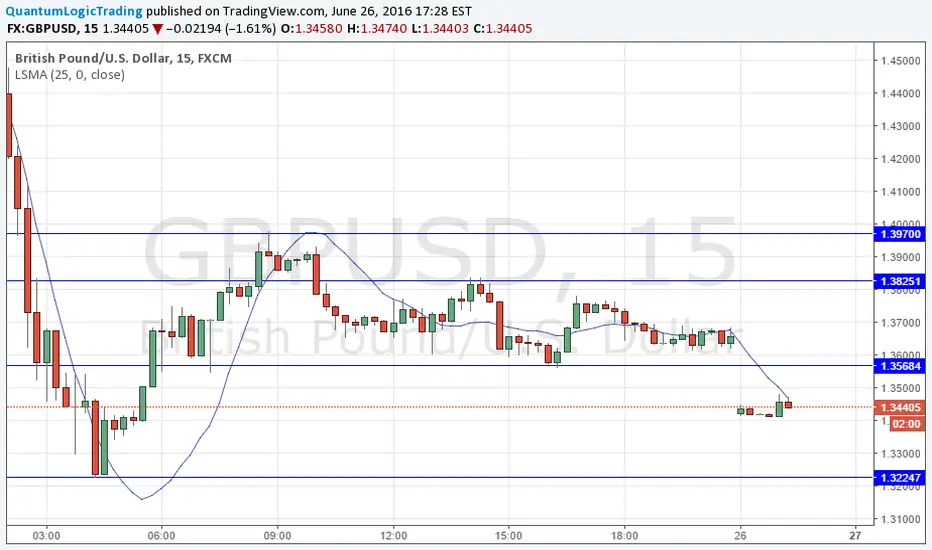
- As pictured I had expected the 1.356-1.382 range that had held at the end of last week to hold for the next 24hrs and for GU to trade relatively flat (24hrs for people to make decisions on positioning) however it looks like corporations and other entities have derisked their GBP exposure over the weekend hence we opened 300pips lower at 1.342.
- With this range broken we now trade in no mans land, thus with all the negative biases my target from now is for GU to drift towards the lows set from last week for now - If the market changes significantly within the next few hours (e.g. trades back into range) i will update this view.
- My target for GBP is <1.30 with a terminal value of 1.25 within the quarter - though i consider that the supportive (no hike) policy of the FOMC will ease GBPUSD losses somewhat. This in mind shorts at these levels are fair 1.34. Alternatively, I also encourage my favourite tactic of shorting/ fading any GBP rallies to 1.38/39 however the chance of GU realising such upside imo is only 50%, with bid trading dominating
Volatility update:
Current GU ATM 50 delta vols trade at 25%, which is surprisingly 2x higher than it was last week (the risk and volatility may not be over).
1wk GU ATM 50 delta vols trade at 30%, significantly higher than last week also.
However 1ms trade 20.49% and are significantly lower than they were last week (illustrating the event risk that has elapsed).
Current GU Option demand is skewed significantly to the downside, with Puts 27.5% vs calls 22.5% thus puts are in demand by about 20% more than calls - this supports current short views (RR -5).
1wk GU demand is also skewed in favour of downside coverage, with puts at 33% vs calls 28%, (RR -5%) with puts being demanded apprx 3% more than calls - supporting the near terms view of short GU
USDJPY as a measure of market risk.
I still suggest using UJ as a measure of GBPUSD market risk - the volatility seemingly isnt over, and with near term uncertainty high, it is prudent to track UJ and use breaks of its 101.2-103.2 range as signals of net risk on or risk-off commitment .e.g. UJ higher risk on (jpy selling), UJ lower risk off (jp buying).
The risk off move for GU imo is lower in this environment, and the risk-on move is higher. Thus, IMO UJ and GU are sync'd, and the two should be used as a tool.
Riskon
TP ON BREXIT VOLATILITY: SELL GBP RALLIES & BUY RISK-OFF DIPSThought id put a piece out as my guide for the week for how to trade the 23rd UK EU Referendum vote.
IMO the first rule and most important is - DONT TRADE THE VOTE.
Trying to guess the answer is like trying to win the lottery, so instead i advise taking a position on the volatility , as volatility doesnt discriminate, it trades both ways.
Trading the volatility:
- The asset most hit by the UK EU Referendum uncertainty is FX, with GBPUSD 1wk ATM implied volatility closing the week at a whopping 48% - as high as levels from the financial crisis.
- GBPUSD spot and volatility price is trading somewhat at the mercy of the UK Polls (i suggest checking them every few hours or so for updates if you want to trade any GBP or JPY pair the next two weeks) - intuitively, when the polls have been BREXIT biased - as they were at the front of last week, we saw GU plummet to 1.40 flat and then towards the end of the week as the polls tipped towards bremain, we saw GU recover somewhat to 1.44 almost.
- I expect the same at the start of this week - GBP will open higher today as polls over the weekend tipped into BREMAIN's favour - supported by the tragedic murder of one of its supporters which consequently lead to a prohibition on campaigning and the "stay" party gaining more publicity).
-Therefore I suggest SHORTING GBP rallies as with volatility trading at the 48% level, probability supports that GBP wont be able to hold onto any strength and will at some point conceive considerable downside. Further, the BREXIT/ BREMAIN Polling balance is likely to toss and turn - (www.bbc.co.uk) - so Fading/ Selling rallies on the back of any new BREXIT/ Leave Polls out is advisable.
- GBPUSD - SELL @ 1.45/6 - lows of 1.40 from last week or 1.385 is the next support level for TP
- GBPJPY - SELL @ 151/2 - Lows of 140.5 is the next support past 148, however, 1.455 are lows from last week
- GBPCHF - SELL @ 1.39/40 - Lows of 1.338 are in sight for TP, or 1.358
- Reward for all is upward of 500pips, Risk is no more than 250pips so IMO this provides a great trading opportunity
My 3 conditions for shorting GBP on rallies is:
1. GBP must be trading "expensive" at the levels suggested above - making reversal more likely.
2. A recent poll is in favour of leaving
3. Volatility is high and Risk Reversals trade in favour - both putting a dampener on long term stability.
See my previous articles on which cross is best to trade - I still believe CHF is the best cross, it has the best long run SHORT possibilities too.
Finally, Safety assets e.g. Gold and US Bonds are tradable ON PULLBACKS also. Gold and Bonds have been on significant rallies (illustrating the market risk) recently, so I advise buying them on any 1-5% pull backs that we may/ may not get - However, the risk-off asset play was much more profitable several weeks ago (as i suggested). Much of the "easy liquidity" has been eaten up in the last 2wk rally - hence only buy pull backs.
In my opinion, the front end of the week will have the best conditions to trade in, volatility will be at its highest and i predict a level of "calmness" emerging on Wednesday/ Thursday as the result is awaited and as volume drops, thus I do not recommend trading on Weds/ Thurs - execute on the rallies expected on Monday and TP before Wednesdays London session at 8am GMT.
On a UK STAY VOTE we could see massive 5-8+% rallies in GBP (depending on how depressed it is) and mirrored strong sell-offs in JPY, Gold and Bonds - hence why i say DO NOT TRADE THE VOTE.
I will be posting updates on Volatility as soon as the market opens.

LONG USDJPY @105.8: NEUTRAL FOMC; DOVISH & EASE BOJ & RISK-ONWe had the best possible outcome for FOMC's Rate decision and Fed Yellens speech which was neutral IMO as expected, with the Economic Projections being dovish, downgrading the projected rate hike cycle. We now look to BOJ.
Trading strategy:
LONG USDJPY (possibly short also GBPJPY for longer term investors or investors that want to hedge against a hawkish BOJ)
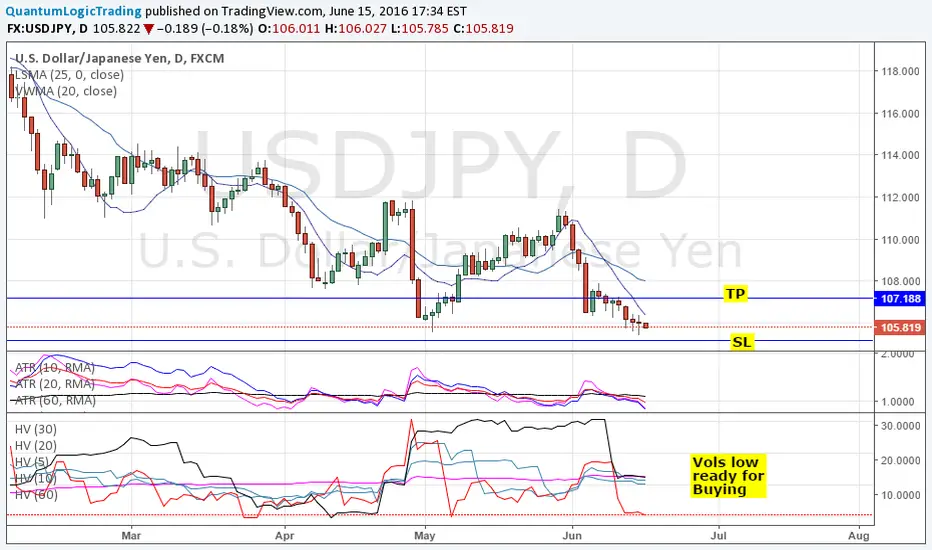
TP @>107 = 100pips at least - SL @104.9-105.2
Reasoning
- FOMC overall was neutral, we had lower projections but Yellen remained mildly upbeat, telling the market to shrug off the short NFP report (quite rightly).
- So this means $ demand/ supply remains flat.
- The main driver of the LONG UJ play is on the JPY side. Given that FOMC was flat, this means JPY "risk-off" and uncertainty buying which would have arisen if the fed was aggressively hawkish/ hiked was neutralised - meaning JPY "rate hike induced" safe haven demand was neutralised as instead the FOMC helped risk trade higher = LONG USDJPY as JPY demand falls
- So now we have a situation of neutral USD and neutral JPY as there was no rate hike to unsteady markets and cause JPY to be brought
- So the driver of the LONG USDJPY is the fact that IMO the BOJ will be aggressively dovish and likely to cut rates - their core and CPI prints are consistantly below 0% at -0.5% for Tokyo CPI and Core, with National at -0.3% for both.
These CPI prints are the average print for the last 6 months meaning BOJ policy has been inefective in reaching their goal as inflation is stale and not rising. Thus IMO they have to CUT and EASE and be DOVISH = Long USDJPY
- Further, Kuroda BOJ head said he is aware of JPY trading strongly due to its safe haven properties and he has stated he is prepared to fight this risk-off led Yen appreciation - this means HEAVY easing to negate the JPY risk-off strength and weaken the currency = long USDJPY
- Finally, a dovish BOJ helps ease the risk-off sentiment in the market at the moment (stocks falling and gold rallying) as BOJ easing puts more liquidity into the markets - calming the risk-off sentiment means LESS JPY buying and MORE JPY selling = LONG USDJPY
Evaluation
- So with USD as a stable denominator, I expect the BOJ to heavily ease in order to 1) improve their inflation performance closer to their target 2) to devalue JPY from the risk-off buying that brexit uncertainty has caused.
- Further, UJ is the best expression of the short JPY play as EUR and GBP are both comprimised by BREXIT uncertainty - which is constantly trying to trade eur and gbp lower - hence a long ej or gj is not advised - UJ is the least affected of the majors by brexit - *see my dynamic straddle post attached for more details*
- on that note one may argue AUD or NZD could be used for the long, since they too are even less affected by brexit downside, which is true, however i dont have enough experience in those markets - if think there is a better denominator than USD for the long then by all means use it - however IMO USD is the best of the bunch for future dollar demand as they are the only Central bank to be hiking NZD and AUD are still cutting.
- Also UJ imp volatility is finally falling with 1wk implieds dropping to 12.55 (-3.45), which improves the environment for buying.
Plus as you can see below Historical Vol is also falling, once again illustrating that price may be ready to start rising again - low vol = more buying. Plus the ATR trades lower than average which is a bullish sign - bull markets range less.
- And we are still oversold massively at -2/3 SD of the mean of the weekly. Plus we trade close to the handle at 105.35 which is the strongest support level in USDJPY history thus helping upside from here (unless we break ofc).
Comments welcome
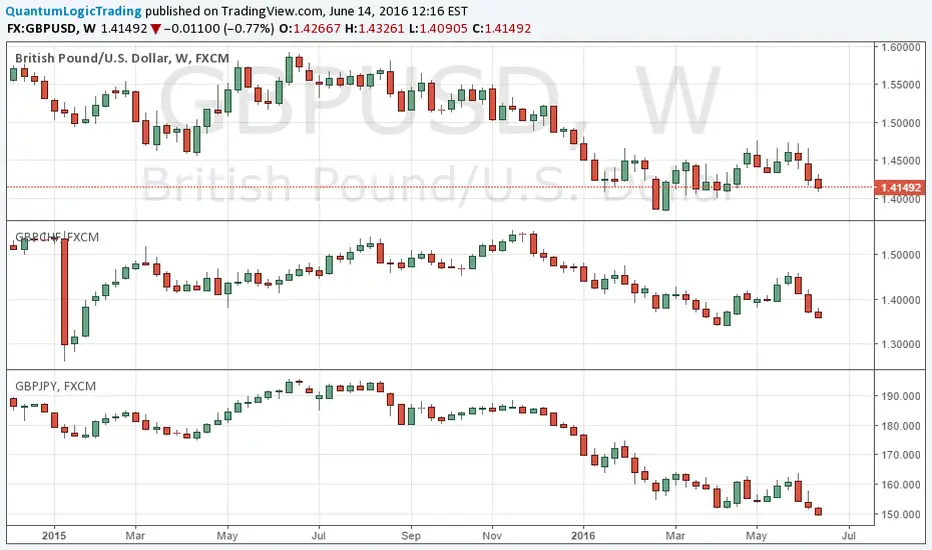
RELATIVE VALUE: BEST EXPRESSION OF BREXIT - GBP VS USD, JPY, CHFAn analysis of which LONG has the best value against the short GBP to play the Brexit. [
- GBPUSD has a target handle of 1.385.
- GBPJPY target handle at 1.483.
- GBPCHF target handle at 1.335 .
- IMO currently i rule out GBPUSD short, as USD doesnt have the same "risk-off" demand as CHF and JPY. Also USD and GBP economies are perhaps the most highly correlated, both economically and politically out of the pairs hence Brexit downside may/ will spill over into USD uncertainty also and may cause a lack of USD demand relatively to the unlinked regions of JPY and CHF. Not to mention GU has moved 400-500pips lower (the most) in a week and short liquidity is getting tighter - i think momentum is slowing in this pair - it isnt making any lows. Also at 1.41 there is little interest to get short/ for new shorts to be added as we near the all time low handle at 1.38 - hence JPY/CHF denominations which arent at all time low levels are better expressions of downside GBP.
- I think a dynamic and better way to play the BREXIT vote is using a long CHF or JPY denominator as you get a "two-way" short. e.g. investors will be actively buying JPY and CHF to hold a risk-off asset, that hedges against volatility/uncertainty/risk that the Brexit possibility holds (even more so if polls continue to become more skewed to a Leave vote - Guardian recently posted 55% in favour of the leave) - thus by denominating CHF or JPY you benefit from the demand momentum AND the Supply momentum of everyone wanting to sell/get rid of GBP as uncertainty and perceived risks/vols increases.
- Therefore, Given the further 300pips of downside available in GBPCHF downside (300pips) relatively to JPY (100 pips) it has some way to to fall yet - especially once investors begin to realise JPY is an over expensive risk-off asset, they will demand CHF more as the next best/ cheapest way to hold safety AND GBP downside.
- Also, since Sunday night short GBPJPY has performed twice as well as GBPCHF (2x as many pips lower - however this means that now GBPJPY is becoming oversold so we should choose short GBPCHF now). The GBPJPY 2x move lower vs GBPCHF is unsurprising as historically investors seek JPY first, until long liquidity tightens (overpriced) then they seek CHF as the next best alternative. However it is important to note, that in most high risk occasions, at the point of the event CHF and JPY eventually end up at the same levels e.g. it is a time horizon difference, JPY isnt necessairly better than CHF in the long run, JPY just receives liquidity BEFORE CHF, but not more than CHF in the end.
- Illustrating this - GBPCHF has lost the LEAST to date in pips compared to GBPJPY and GBPUSD over the last while - hence why currently GBPCHF is the best short/ has the most pips available to short.
Thus assuming you have missed the short GBPJPY I advise now adding GBPCHF short as we have 300 pips until the nearby handle at 1.338 (rather JPY only has 100 pips to the handle at 1.483).
-Also one other element to note, is that EUR pairs e.g. EURJPY and EURCHF are also relatively cheaper than GBPJPY and GBPCHF - short EUR numerated shorts are also the next best/ next most valuable shorts after GBP numerations. Hence - imo once GBPCHF reaches the handle at 1.335 I will be looking to short EUR numerations as they are still relatively cheaper (The demand is for GBP as GBP is the most sensitive), however short EUR is the next most sensitive numerator as the EUROZONE is the next most affected ccy, since the UK EU Referendum directly impacts Euro area economy.
Volatility demand:
- Also not to mention GBPJPY and GBPCHF 1wk and 1m risk reversals in the long run are becoming negative at a higher rate/ momentum compare to USD e.g. investors are buying GBPJPY and GBPCHF Puts at an increasingly faster rate than GBPUSD puts (the change of the RR values are increasingly negative more than the GU - The GU RRs are almost already fully priced). Hence we are no
GBPUSD: THE RUN DOWN & HOW TO TRADE - FOMC & UK EU REFERENDUM 1This article is a tradable summary of all of the indepth GBP$ analysis i have done recently - I aim to give you a conclusive opinion and trading plan. SEE PART 2 ALSO
I suggest you check out ALL of the relevant articles that i attach to this post so that this post makes sense
In a nutshell i am heavily short GU, about 8-9/10 @1.44/5 (@1.41 only 2/10) - so i advise shorting ANY pullbacks we get to >1.44 in the coming weeks.
- Also SHORT EU is a good trade as IMO it is heavily over brought, and hasnt priced any of the fundamental supply/demand stimulus ( e.g. EU is trading at levels higher since the dec 15th hike, March ECB cut and UK EU Ref uncertainty pricing) which all should have depressed the market lower. Thus short EU might be the better play if we dont get any GU pullbacks, since EU still has alot of downside to factor in imo.
Volatility
- The best indicator for dis-ciphering what the market has in store for GU and EU imo is implied volatility, since it uses options (actual demand/ supply of the market) to predict what the volatility will be in the future.
- Currently EU and GU on Friday both traded in their 2 year 99th and 100th percentile implied vol reading at 14.78% and 16.15 respectively.
- Furthermore, GU's IV has been trading higher everyday this week and has set new 52wk highs everyday. The volatility (time horizon) curve is severely fattened/ steepened around the next 2 weeks due to the up coming e.g.
23.55% 16.5% 16.15% 13.75% 10.25%
1m fwd 1wk fwd current 1wk ago 1m ago
- Hence, and as you can see, now (or last week or the week before that) is the time to get on the curve for GU downside since volatility has been rising and is projected, to rise into the FOMC and UK EU Ref - before tailing off quite considerably (3m fwd at 16%, 6m fwd at 13.25%).
- In addition to this we are seeing Historical Vol trade relatively flat - indicating that GU price action hasn't yet fully priced in the potential future event volatility, meaning we can expect large legs downwards in the future, since HV isnt at extremely high levels (as pictured), there is certainly room for price action vol to move higher, thus there is room for GU to trade heavily bid and shed a several more 100pips.
- Further we have seen a negative shift in Risk Reversals for GU and EU - GU the most extreme now with 1wks at -1 and 1m at -7.6 (EU -0.1 and -0.45). Risk Revs (RR) look at the Supply/Demand of OTM Call/Put options and RR is the difference between the vol of calls minus puts.. GU RR is currently growingly negative at -1 and -7.6, implying that puts are trading much more expensive than calls as their demand is higher.
GU puts are more expensive as investors over the next 1wk-1m period are increasingly demanding downside GU exposure or want to hedge their underlying length MORE than they want upside call exposure. From this skewed options market demand for puts (rather than calls) we can observe that GU downside is net what the market is positioning for, and therefore, GU downside/ short is ALSO what we should consider playing in the spot market.
Increasing volatility and decreasing RR supports SHORT positions as; 1. investors dont want to hold assets that have increased vols (it is seen as increased uncertainty and risk) and 2. investors are increasingly purchasing put options which at some level DOES represent investor sentiment in the spot market also - these are why i advise getting short if you haven't already, asap for GU to play the volatility.

GBPUSD: THE RUN DOWN & HOW TO TRADE - FOMC & UK EU REFERENDUM 2I suggest you check out ALL of the relevant articles that i attach to this post so that this post makes sense
SEE PART 1 ALSO
GBPUSD historical Price Action
The findings of previous the attached "Price action history posts" led to the conclusion that referendum history clearly wasn't repeating itself however IMO because this is the case it has opened up massive opportunities - for example;
- Price Action for the SUR sold off a massive 1000pips 8 weeks before the vote, then recovered 400pips 2wks leading into the vote in 2014 - such price action didnt present much trading opportunity since the risks were priced so early, many retail investors missed the big move and probably made heavy losses by shorting in the 2wks into the event when the market actually rose.
- HOWEVER, the market for the UER has been trading sideways/ directionless (with a slight upwards bias) for over 16wks only gaining from 1.41-1.45, with many candles failing to hold onto their extreme high/lows - simply open-close at median levels which further confirms the lack of conviction; this has meant that GU now trades considerably ABOVE lows at 1.38 which means there is clear room for a down trend to emerge and thus we can be confident/ safe in taking SHORTS on the pair at levels signif above the 1.38, as we can assume that the market will seek out the recent 1.38 lows if a downtrend does emerge - theres a clear and nearby target for a downtrend.
Fundamentals and Summary
- FOMC has started its hike cycle, GU is extremely sensitive to US rates and shed well over 1000pips in the run up and after the December FOMC meeting (compared to the EURO who still trades above hike levels). Thus we can assume that future rate increases, or the speculation that they will increase, will continue to price GU lower.
The UK BOE isnt likely to raise Rates until late 2017/2018 as our economy (CPI 0.3% vs US 1.1%/ Core 1.2% vs US 2.1%), thus this Monetary Policy divergence theme is likely to continue for sometime, consequently devaluing GBP consistently lower and lower in the future, as it has done before, which gives me confidence in this part of the trade.
Furthermore, in the short term the UK EU Referendum will serve as uncertainty that will undoubtably drive GU down in the near term - regardless of the result as the uncertainty WILL drive rational investors from holding sterling.
- I like being short sterling over the short and long term as the CB Policy divergence, imo, will serve as a consistent underlying seller of GBP over the next 1/2 years whilst the UK EU Ref provides us near term downside pressure.
ALSO, being short sterling into the Ref and into future FOMC meetings means you benefit from the carry of the "event tail risks" e.g. you are positively exposed to any probabilisticly unlikely, but possible, events - which would be extremely profitable e.g. if UK vote to leave EU you have downside already placed on GBP or if FOMC steepen the hiking curve we are positioned to benefit.
- As discussed earlier, over the weekend i thought using CHF or JPY to combine with short GBP or EUR may be effective as 1. CHF and JPY both havent priced lower as heavily as USD (relatively more downside value available). 2. By being long CHF/JPY on the basis of being short GBP because of Brexit risks, you are able to hold the risk-off assets which make the trade 2-way e.g. you collect the GBP Brexit uncertainty selling AND the JPY/CHF buying as investors flee to safety - such 2-way trades create exponentially more downside momentum since you have TWO drivers.
TRADING STRATEGY: SELL/ FADE ANY PULL BACKS IN A PYRAMID e.g. 3@1.450, 2@1.445 & 1@1.44!
SL: 1.48 - holding until June 23/24th, or 27th of July for all 2 X FOMC and the BREXIT REF event volatility carry
TP: Fed hike = <1.38; Fed Hawk = 1.40; Brexit uncertainty = <1.40; Brexit YES = < 1.345. Brexit & Hike = <1.30

BUY USDJPY: SUP LEVEL @105.5 & VOLATILITY SELL-OFF @ HIGH LEVELSBUY USDJPY @106.5 or @107.0 - SL @105 - TP @109-11 based on:
$YEN's historical most important support level - The 105.5 Key level will more than likely hold as it has many times before
- At 105.5 there are 3 significant UNSUCCESSFUL tests of the level over the last 3 years thus it is a great entry point. Also another plus is if you look at the monthly chart you will notice 105.5 is the 2nd most important level in $Yen's 20y+ history, the 1st most important/tested is the 101 level.
- Further, over the last 3 years the level has been tested 4 times in total and it only broke once when USDJPY
rose to 127 so that means LONG at this level has a 75% chance of success (based on the simple discrete math).
- Plus, around 105.5 at 106 and 106.5 these also provide "mini" strong support levels which i think are great, low risk entry points for long positions.
Normal Distribution and High Price Standard Deviation Volatility
- as you can see the weekly bar has closed below the 5 year -3SD (and -2SD 2.5year) once before, by the red bar 5 weeks ago which was also at the 105.5 support level- at which point USDJPY0.02% rallied back up to 111.5 from 105.5 after closing below the -3SD and -2SD line and on the 105.5 so we could see topside like this again.
- in addition to this, it is worth noting that the 5y -3SD blue line that was violated but rejected 5 weeks ago and is being tested again, based on normal distribution theory, says that prices touching this line have a 99.5% probability of reverting BACK UP towards the mean at 122.5. The -2SD 2.5year line that was also violated has a 95% probability of retracing up towards the mean at 126.
Historical and implied volatility at all time highs - a reversal
- Historical volatility across the board (5,10,20,30,60) is trading at all time high levels now and at some point these levels have to come down, investors cant keep pushing vols higher, which in turn, means selling of UJ must come to an end soon and we should see an upward recovery run.
- The same is true about Implied vols which are trading at 15.75% which is in the (upper) 90th percentile of the last 2.5 years of days, meaning implied vols 90% of the time have been lower than this - thus a reversal is more likely at these levels. HV is likely in the 90%tile or greater also - Usually a sell-off in volatility precedes buying of UJ.
- See more info on vols here: www.tradingfloor.com
Downside analysis
1. The obvious risk of the Long UJ play are that the 105.5 level doesn't hold, in which case i believe the long squeeze caused, as a result of all long SLs being hit causing a cascade of selling could take us down to 102/3 - however this is easily avoided by keeping tight stops at 104.5-`105 dependent on your risk appetite.
- even with a 150pip SL it still returns us 3x returns with a TP target of 111+
2. The markets may trade risk off in the coming weeks as the macroeconomic envrionment is filled with uncertainty e.g. FOMC, BOJ and UK EU Referendum, in which these events are compounded by the fact that risk markets (spx etc) are currently trading at all time highs, making a reversal in their direction and risk-off tone more likely.
Furthermore other risk-off assets such as Gold and Bonds are trading well.
All of which may combine into a strong risk off environment that fuels the JPY follow the bullish trend with its counterparts (bonds and gold) and enabling UJ to push past the 105 strong hold.
- However, these issues are all displaced by a tight SL as advised at 104.9 (to benefit from the 105 key lvl supporrt potential)

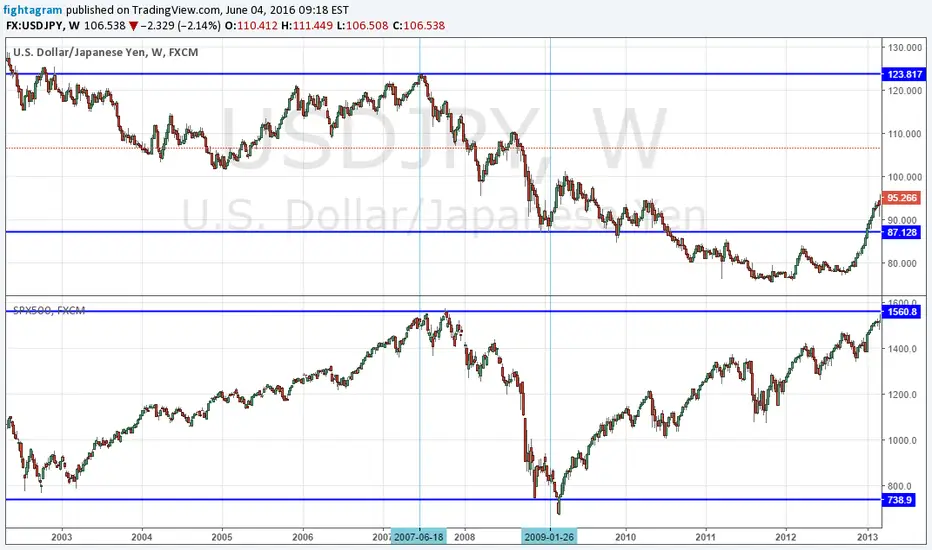
IS YEN REALLY RISK-OFF AND CORRELATED TO SPX (RISK-ON)?Though id post as just one example, perhaps the most obvious, that shows how heavily the JPY is considered a risk-off asset and to show the clearly, since the SPX is a risk-on asset, that the JPY is negatively correlated with the SPX.
In times of market fear/ uncertainty, YEN is sought out, just like bonds and gold, as a safe heaven asset. The theory behind this is that the JPY offers stability through the nation being one of the only developed nation with a net credit balance sheet.
Clearly, in the financial crisis, one with a hypothesis as the above, should see the SPX fall and the YEN risk.. Indeed, the chart shows exacty that, almost 1:1 correlation.
Now, the JPY SPX correlation DOES change, in times of extreme fear or extreme exuberance, the YEN will be proportionately more correlated with the SPX and other risk assets.
.
In "Normal" or non heavily trending markets, the correlation is less obvious - since it is the extremes that cause investors to seek difference assets and change their strategy in masses.
In times of fear, investors move their liquidity to risk-off YEN, hence we see USDJPY fall during the crisis. We also see SPX fall in a correlated manner, this is because investors pull their liquidity OUT of SPX and apply it in some proportion to YEN.
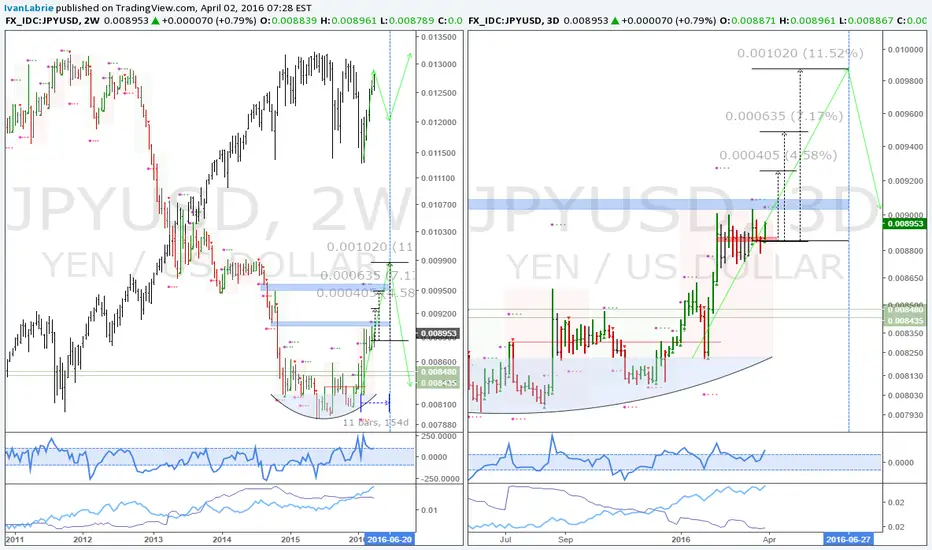
JPYUSD: Long yen, deleveraging in the backgroundIn this chart I analyze the currently active signals in the JPYUSD chart, as an alternative way of approaching USDJPY to prevent biases.
I'm seeing an active 2 week trend, which has until June 27th to complete, but also if you dial down to the 3 day chart, you can see a valid uptrend signal emerging from the recent 'impulsive' leg to the upside.
I'm interested in going long the yen in this zone, and aim ideally, for a retest of the dowtrend mode near 0.009875.
The time at mode signals, tell me price could stop at 0.009256 or 0.009489, so, take heed of these particular levels, for either a retracement or reversal of this trend.
I'd expect the equities to correct the recent advance, in the wake of this yen uptrend continuation, as risk off sentiment takes over once more.
The trade: Go long JPYUSD, or short USDJPY, ideally on a retracement, but if not, you can take it at market price and keep stops 1.2%+ away from this week's close.
Target a 3 to 10% distance from entry, approximately. Holding time, or ETA to reach the targets is before June 27th.
Good luck if taking the trades.
Cheers,
Ivan Labrie.
Dax: Potential monthly uptrend emerging from mode supportWe have seen a very volatile range in the Dax recently, in lower timeframes, but if we use a bird's eye view of the situation, we can see that the previous mode support from this leg's uptrend held and it's about to fire an uptrend signal.
My previous monthly downtrend analysis is currently invalid, and we can expect to get excellent opportunities on the long side here, on the short side in BUXL and the short side in eurusd (and long usdchf).
If you want live updates and more information, make sure to follow me at collective2, where I provide signals for auto trading and via email for a monthly fee.
I'm also providing access to a live trading chatroom free of charge for concordbay.com customers, contact me via skype for more details.
Cheers,
Ivan Labrie
Time at Mode FX
Analyst at Concord Bay dot com

Intermarket analysis: Paradigm shiftI was considering two alternative scenarios for the market. Initially I thought the Euro rally and equities meltdown had more merit, but after close scrutiny and being stopped out and thus having my EURUSD and USDCHF long and short invalidated, I realized that the appetite for risk was evident, had I looked at it without weighing in my risk off rally thesis so heavily.
After I noticed that NZD and AUD could have bottomed, I published bullish charts for AUDUSD and NZDUSD. These, on a correlational basis, conflicted with my Euro rally thesis, which involved equities taking a turn south for the rest of the year, potentially well into 2016, when monetary policy adjustments would have become a concern again.
This also implied that oil would have turned south, which was conflicting with an anti dollar rally of a large scale.
Evidently, someone is heavily buying commodities, with gold leading the pack in terms of relative strength.
The dollar remains weak nevertheless, don't let the Euro meltdown confuse you. On a relative strength basis, my analysis on the XAUUSD/DXY ratio is still valid, and lays a very strong case against broad scale deflationary woes.
The dollar isn't rallying against AUD or NZD, like it has happened in the past. These commodity currencies are offering very clear signs of strength, and tempting longs on evidently imbalanced crosses if you know where to look.
For now, my view is that we will see equities rally, crude not falling or rallying as well, gold and all the commodities commercials are long on rallying, and potentially very interesting trades in eur and jpy crosses. Pairing weak with strong makes for very sharp moves, so keep this in mind and experiment with ratio charts, and studies in correlation by yourself.
If you want live updates and more information, make sure to follow me at collective2, where I provide signals for auto trading and via email for a monthly fee.
I'm also providing access to a live trading chatroom free of charge for concordbay.com customers, contact me via skype for more details.
Cheers,
Ivan Labrie
Time at Mode FX
Analyst at Concord Bay dot com

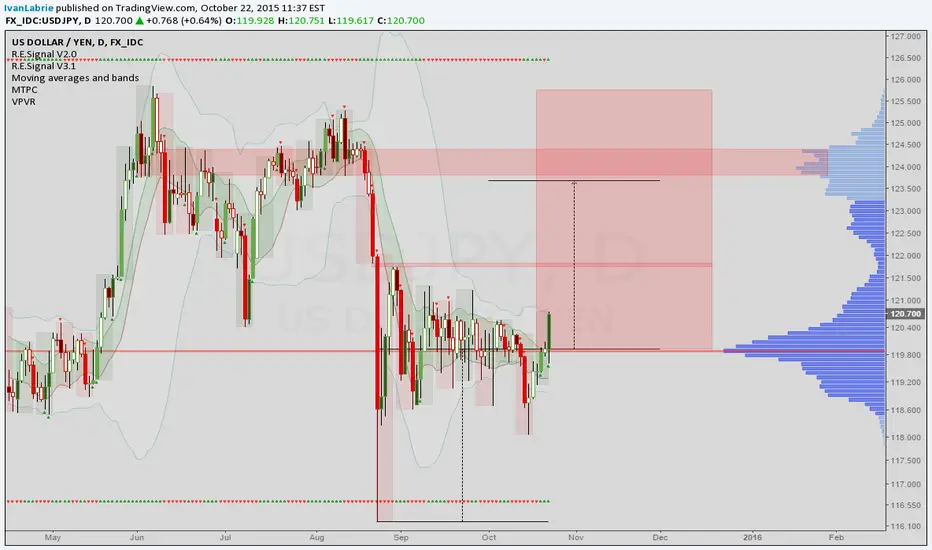
USDJPY: UpdateHere's my updated view on USDJPY.
We have a few interesting resistance levels ahead, but overall, the pair is looking up, receiving a strong boost thanks to Mr. Mario Draghi's magic words, and the Nikkei rally before it.
Low volume resistance at 121.7 may halt the advance, keep that in mind.
I'm in other related trades, I'll try to balance these positions by trading NZDUSD, AUDUSD, and USDCAD.
If you want live updates and more information, make sure to follow me at collective2, where I provide signals for auto trading and via email for a monthly fee.
I'm also providing access to a live trading chatroom free of charge for concordbay.com customers, contact me via skype for more details.
Cheers,
Ivan Labrie
Time at Mode FX
Analyst at Concord Bay dot com
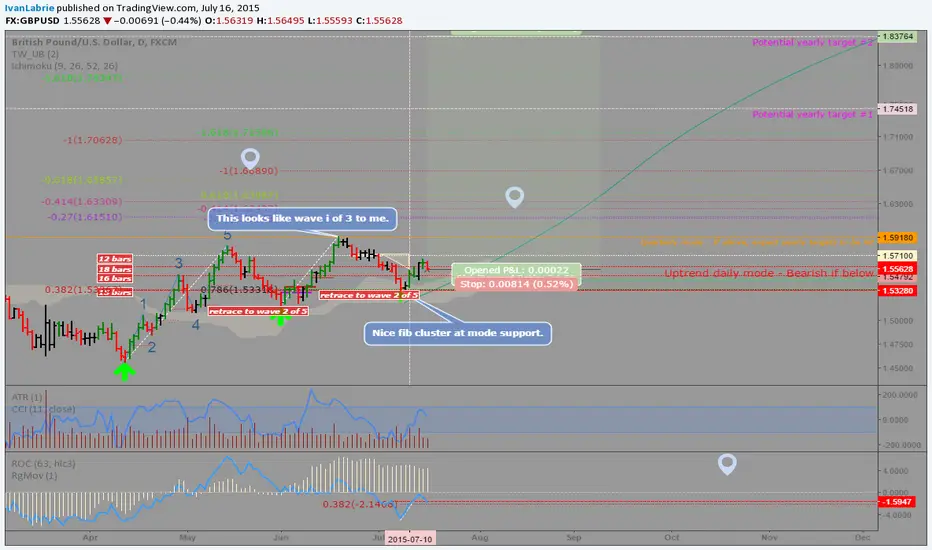
GBPUSD: Still looks like a long to meThis is my second attempt at a long.
I think this pair is trending heavily up, and while I think some usd pairs might head down (like audusd and nzdusd, at least in the short/intermediate term), this pair looks to be headed up.
Once we cross the quarterly mode I'll be confident in hitting the yearly targets #1 and #2, for now I entered a long here, and also shorted audusd (and went long usdjpy, while shorting nzdjpy), thus trading a spread without having to trade gbpnzd or gbpaud, which are less liquid and don't move as predictably (where do you place a stop in that monster rally? Don't ask me...).
Technicals align nicely here, we have a confluence of both my rudimentary EW analysis, and time at mode, with the quarterly ROC trending up, CCI about to get overbought soon, crossing above -100 after finding support at a fibonacci cluster, which was also the previous daily mode. We have the mode in the trend rising, which is bullish, and rgmov forming a new high over a previous resistance, which resembles a wave 1-2 advance in EW terms (Tim West recently posted a chart about EURUSD, performing his EW analysis directly on Rgmov, it can give excellent and more 'predictive' results than trying it on the actual price, do check it out.
Good luck if you take this trade,
Ivan.