RLC
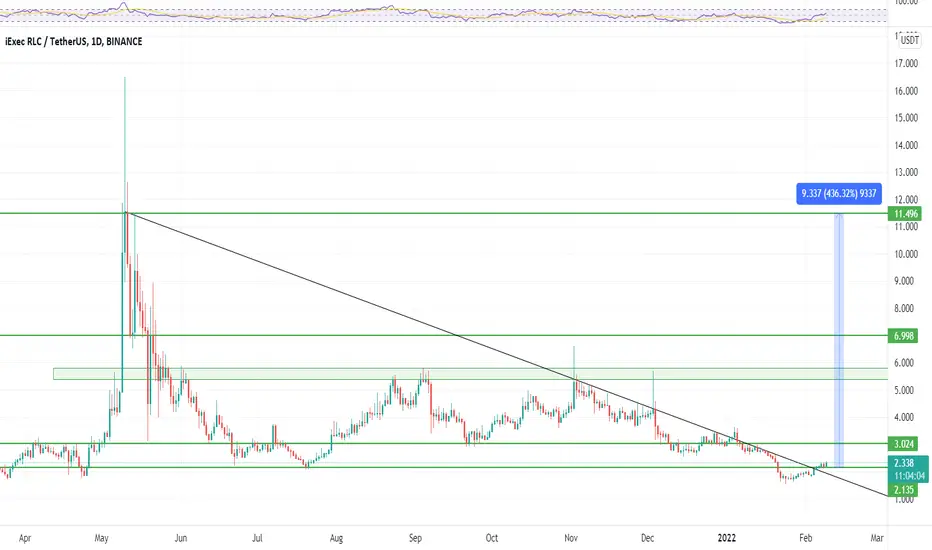
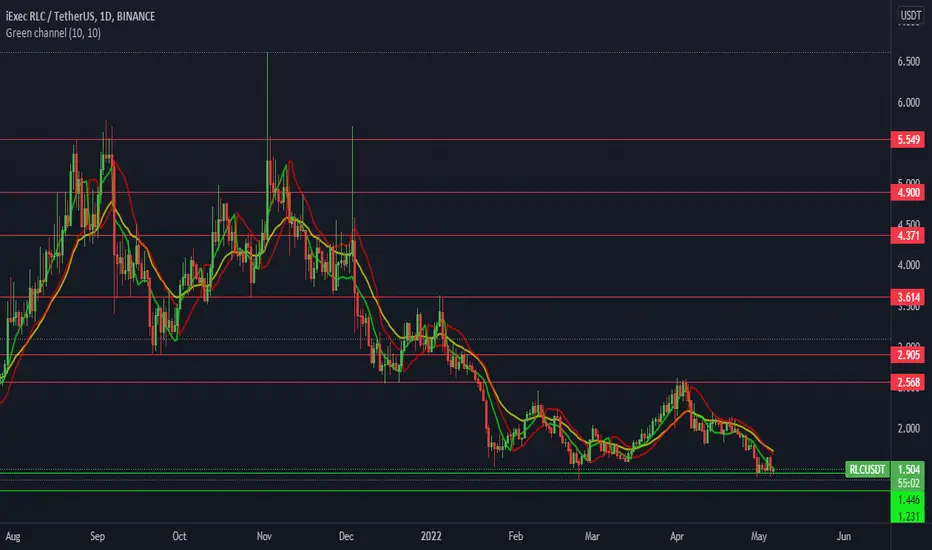
RLCUSDT (IEXEC) Daily tf Range Updated till 01-07-22RLCUSDT (IEXEC) Daily timeframe range. this one actually a bit of interesting alt. its not fundamentally superior compare more to many other higher #mcap assets. but it can offers some rewards to anyone who want to bet with the risk. there are retests which offered some quick reward for scalper there were it didn't, of course i saw this alt been pump and dump by some telegram channels. those things got effects on price action and peoples that holds. it was not easy to chart it either cause of some unusual out of places moves but who to blame as it was when quality of holders are not that high.
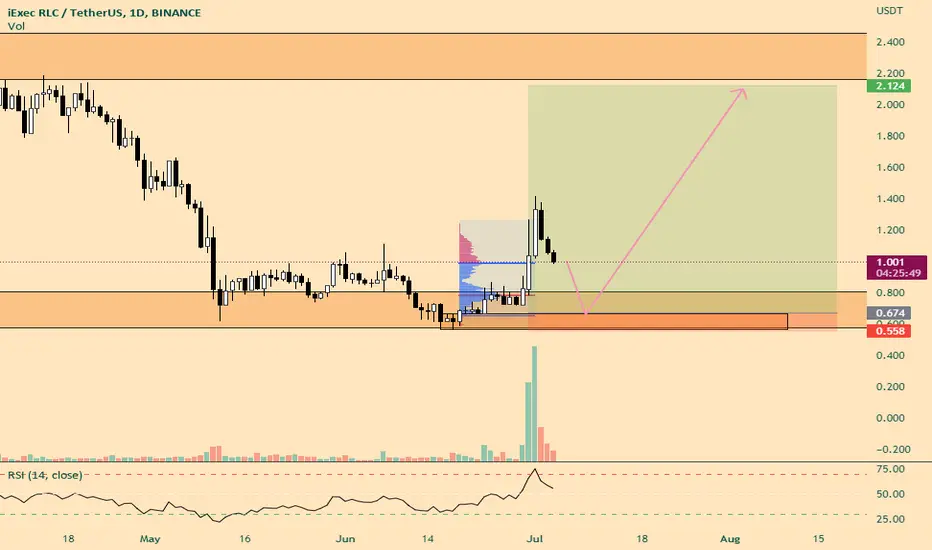
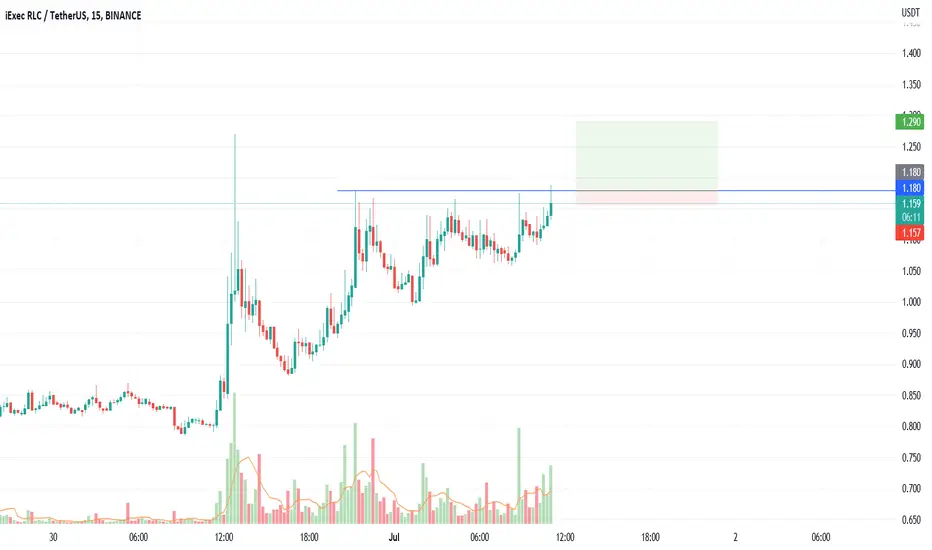
📊 RLC pumped more than 30% today! What's next?Hello, dear TradingView members.
This idea is an RLC analysis.
RLC just pumped more than 30% and got rejected by the upper Bollinger Band.
The rejection wasn't that powerful that's why it's still moving in the short-term ascending channel and we might see a retest any hour now.
There are two support levels on the chart holding the price up, and two resistance levels pushing down on value.
There are two possible scenarios.
Scenario One:
The price will gather more buy volume and after moving near the support level it will pump to the potential target zone.
Scenario Two:
The price will lose strength. Then it will be rejected by the resistance level, and fall on support.
The Speedometer indicator shows Buy volumes on the market for RLC on a 1D interval.
Now have in mind: ANY news about this coin can cause a big pump or dump at this moment!
Let me know if you guys have any questions;
I will be more than happy to help.
Good luck, and thank you.

RLC - will update high✈️Reasons to take long:
⭐️ BTC made a pullback
⭐️ Over VWAP
⭐️ Coin in game
⭐️ Close to local high
⭐️ Pullbacks are getting smaller
⭐️ 4th touch
Will enter when price squeezes to the trendline on 5m timeframe, the base will form and the tape will get faster.
If you don't understand the previous sentence, just use swing stop-loss 3-5%
Fix profit by parts:
2% - 1/3
4% - 1/3, stoploss to breakeven
What's left, hold to the maximum
What do you think of this idea? What is your opinion? Share it in the comments📄🖌
If you like the idea, please give it a like. This is the best "Thank you!" for the author 😊
P.S. Always do your own analysis before a trade. Put a stop loss. Fix profit in parts. Withdraw profits in fiat and reward yourself and your loved ones
RLC USDT Happy trading
HELLO GUYS THIS MY IDEA ABOUT RLC Usdt is nice to see strong volume area....
Where is lot of contract accumulated...
I thing that the Seller from this area will be defend this SHORT position...
and when the price come back to this area, strong SELLER will be push down the market again...
DOWNTREND + Support from the past + Strong volume area is my mainly reason for this short trade....
THANKS
TURTLE TRADER🐢

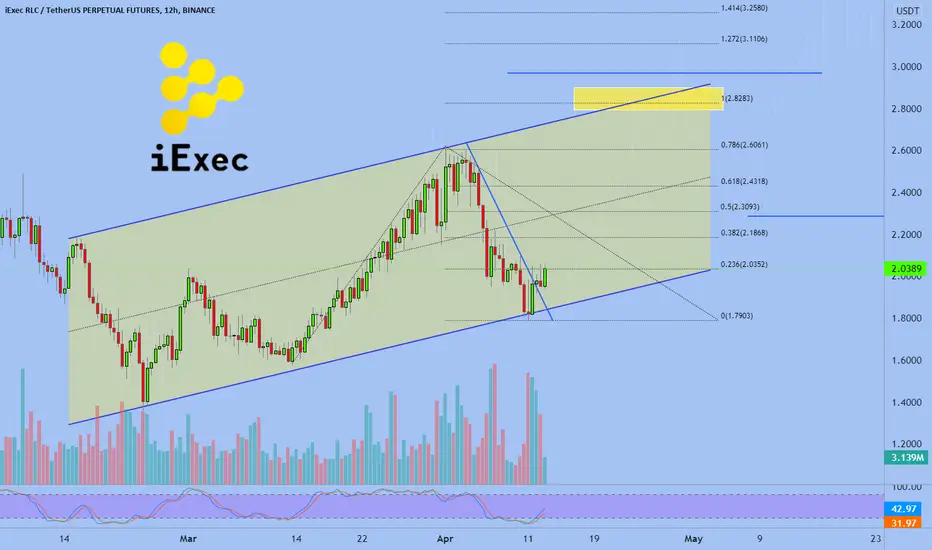
RLC/USDT Medium-term work Secondary trend. Triangle areaTimeframe 1 day. Secondary trend. The main trend is clearly upward, which formed a channel. The price is at its lower zone (the green line of the main trend). The coin has been in an uptrend since its inception. Not a belief scam, a test of technology, and what will come out of it is another question... To understand the trends, see the linked trading idea of the main trend of this cryptocurrency.
Coin in the coenmarket: iExec RLC
The chart shows the secondary downtrend of this cryptocurrency. This trend has formed a triangle. The price is clamping down. A decoupling is coming soon.
RLC/USDT Uptrend. Channel. Triangle.

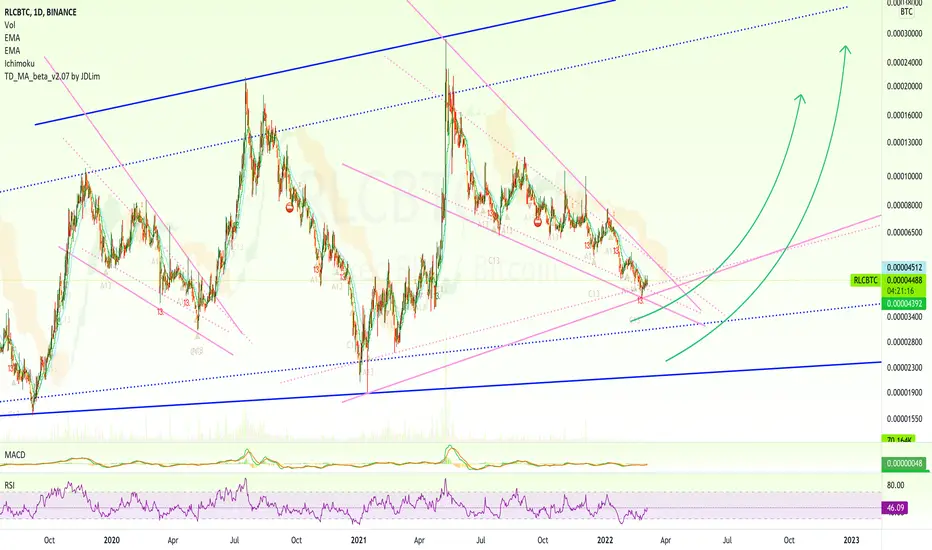
RLC/USDT Uptrend. Channel. Triangle.Timeframe 1 week. The coin has been in an uptrend since the beginning of its existence. This trend has formed an uptrend with a large % step. Not a faith scam.
Coin in the coenmarket: iExec RLC
Liquidity is medium. on some exchanges is low, that's why big price movements are possible (stick pumping, also super squeeze to "zero" on 13 03 2020).
Notice what a breakdown in percentage of channel resistance was when pumping more than +2000%. It may well happen again if a secondary uptrend develops (after the breakdown of the triangle).
At the moment:
The primary trend is pronounced uptrend.
The secondary downtrend, which has formed a triangle, the price is clamped. Decoupling soon.
Secondary trend. Triangle area. Medium-term work. Timeframe 1 day.
RLC/USDT Medium-term work Secondary trend. Triangle area
Public trading idea of learning/trading in a pair to bitcoin.
RLC/BTC Main Trend. Timeframe.1 week. How to work on pamp?
Under the trade idea I have fixed my past work on this coin for the last 1.5 years.

RLC iExec LONG SET-UPs 20220630Signal: Blue -> Green * n
Two set-ups
Risk Reward: 2
RLC , iExec, RLCUSD , RLCUSDT ,RLCUSDTP, BITCOIN ,CRYPTO,CRYPTOCURRENCY
DISCLAIMER
This is only a personal opinion and does NOT serve as investing NOR trading advice.
Please make your own decisions and be responsible for your own investing and trading Activities.

RLCUSDT🔥Let's analyze the RLCUSDT chart
I expect a retest of the countertrend to the 0.670 zone, this will be a potential LONG entry point!
Sample deal plan:
Sample deal plan:
💡Entry $0.670
🔝Take profit 0.720$
✖️Stop-loss $0.640
✅Don't forget to visit the channel there is a lot of useful information about trading.
✅Write your comments what you think about this coin.


RLC/USDT is at DCA priceAs per my analysis, RLC is at a good price to accumulate.
All the targets are mentioned. #NFA and #DYOR
RLC roadmap forming cup & handle big time frameOn Big time frame, we can see a similar setup to my old Zil chart of big time frame cup & handle.
Once 2nd alt-season starts we will see a big jump for all coins.


RLC what do you see here in this chart?What do you see here in this chart?
Each time we hit this low, what happens to the market overall?

iExec RLCWe see an uptrend for iExec RLC. The price of the token has rebounded from the support line. It may roll back to the previous low, and trade sideways for some time. Further, we will set the targets by the trend-based Fib extension.
Best regards,
EXCAVO
iExecRLC Reversal CandleThis Doji here, marked purple, works as a reversal candle.
Anywhere we find a Doji it can signal indecision entering the market.
Once we have the Doji at support, followed by a bullish candle... This confirms that change is coming.
One normally looks for a multiple candles for confirmation but the break and close above EMA10 and EMA50 should be enough to support this candle.
One can easily open a position here with very low risk and high potential rewards.
This is not financial advice.
Namaste.

RLC in 2022 bullishCup & Handle
Weekly frame! Bullish
T1: $11
T2: $47
This is a long-term chart but I think this year


RLC/USDT BUYING SET-UP RLC Back to retest on support after can't break psychology resistance at $2
Potential back to try resistance to breakout🚀
Target mentioned in the chart
Stoploss : $1.75
Risk : 5%
RLC UndervaluedRLC is severely undervalued and the TA suggests a mini break out here, as it cracks resistance from the wedge formation, lets see if we can get a decent swing here.
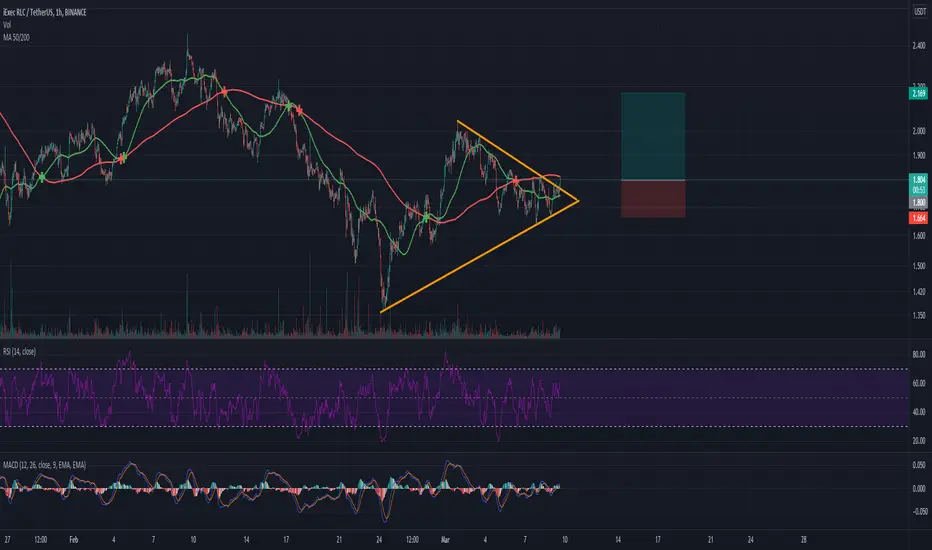
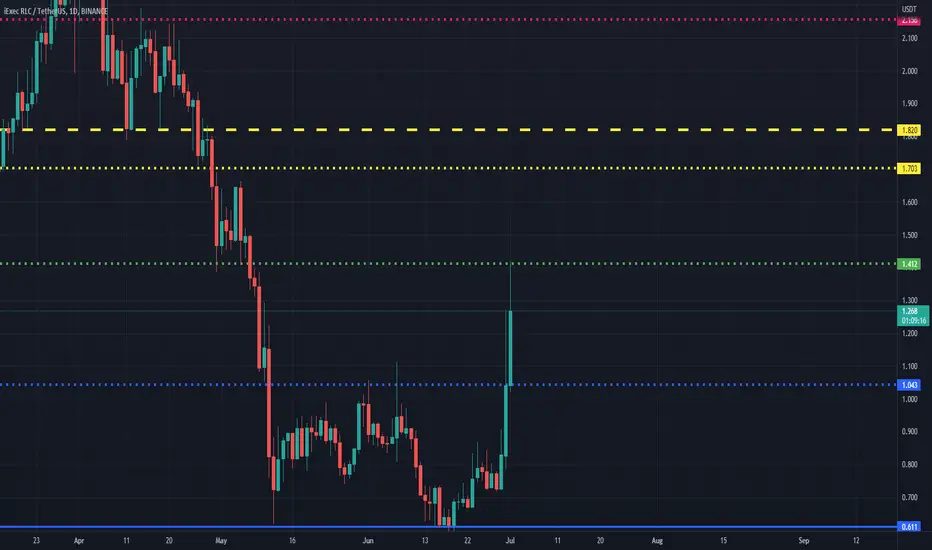
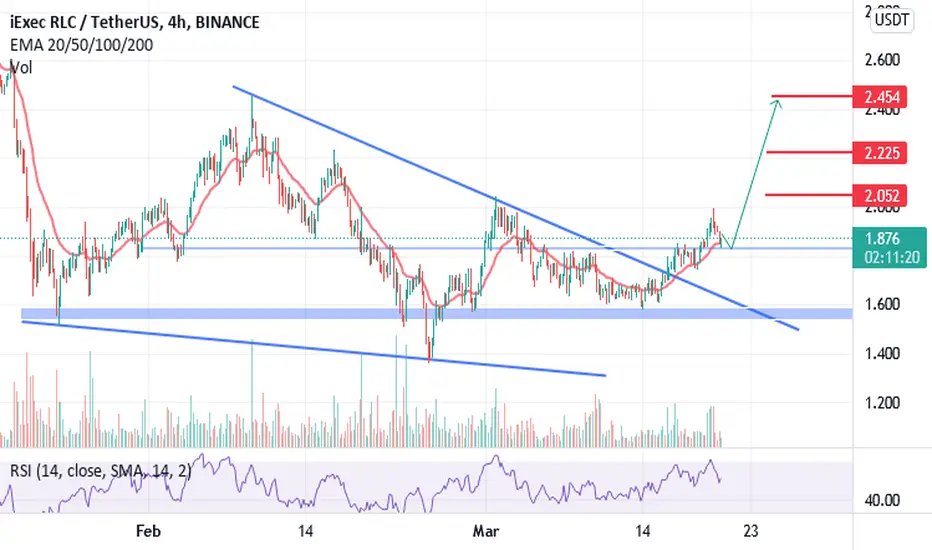
🆓iExec RLC (RLC) Mar-07 #RLC $RLC
After RLC broke out of the $1.6 zone, buying pressure came back strongly and RLC rallied to the $2 zone shortly after. This is a sign that the $1.6 zone is still a good support for RLC. If we don't lose this zone, in the near future RLC can rise back to the 2.5$ zone
📈RED PLAN
♻️Condition : If 1-Day closes ABOVE 1.6$ zone
🔴Buy : 1.6
🔴Sell : 1.9 - 2.2 - 2.5
📉BLUE PLAN
♻️Condition : If 1-Day closes BELOW 1.6$ zone
🔵Sell : 1.6
🔵Buy : 1.3
❓Details
🚫Stoploss for Long : 10%
🚫Stoploss for Short : 5%
📈Red Arrow : Main Direction as RED PLAN
📉Blue Arrow : Back-Up Direction as BLUE PLAN
🟩Green zone : Support zone as BUY section
🟥Red zone : Resistance zone as SELL section

iExecRLC | This Is What I See Long-Term (Simplicity)This is a long-term chart.
This is what I see happening in the long-run.
We can easily appreciate the cycles on this chart.
Simply a wave up, a wave down; wave up, wave down...
At the same time we have Higher Highs (HH) and Higher Lows (HL).
We are in a down wave, the next wave should be up.
Namaste.