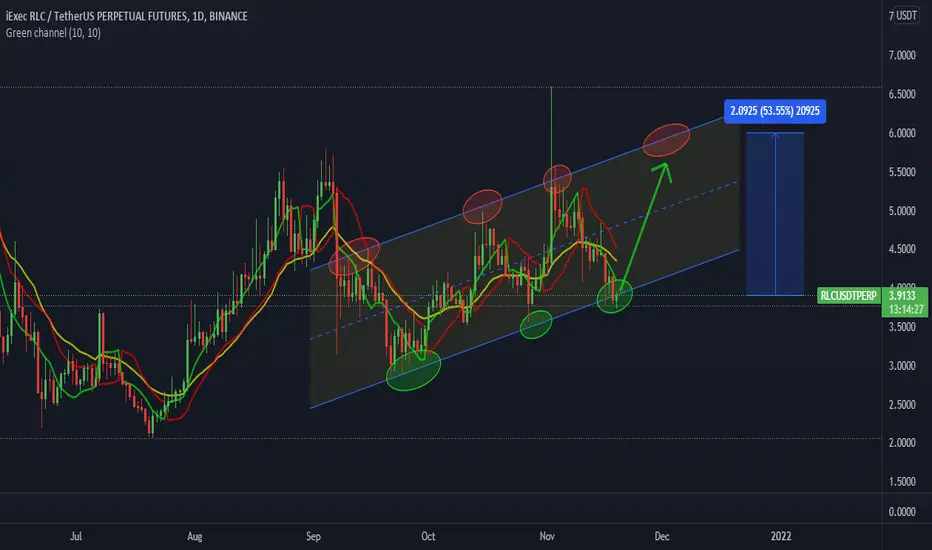
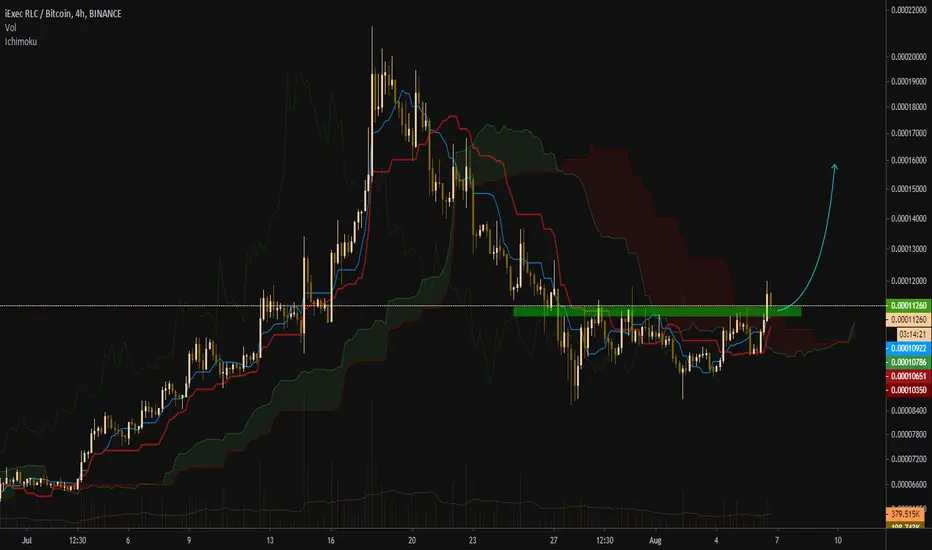
RLC iExec LONG SET-UPs 20220630Signal: Blue -> Green * n
Two set-ups
Risk Reward: 2
RLC , iExec, RLCUSD , RLCUSDT ,RLCUSDTP, BITCOIN ,CRYPTO,CRYPTOCURRENCY
DISCLAIMER
This is only a personal opinion and does NOT serve as investing NOR trading advice.
Please make your own decisions and be responsible for your own investing and trading Activities.
Rlcbtclong


Rlc/usdt is on breakout level,Accumulate some amount in this level for a Goog return in short time frame

RLC/USDT 100% Buy Setup & BullishAs per my analysis, RLC detects its bottom and creating a 100% buy setup. it is good opportunity for those who want to book more than 50% profit with in few days.
Chart is simple and clear.
#DYOR
#NFA
RLC is about to EXPLODE!!!!!!Rlc/btc hast just crossed the 200 daily Moving average .As you can see every single time we break it we had a least pump of 100% this time could just be similar unless btc dumps promptly .With btc dominance heading into lows more money is going to flood in altcoins and rlc is about to do something big .however its for the best to wait for btc to settle down then buy in a position.
Make sure to like and follow
No financial advice do your own research. cheers!

RLCBTC LONGRLC hase been stablised abov sma100 and hase potentian to grow for 25% more . the first target could be the crosiing value at sma200
I also see the 5th eliot wave in 24h time frame forming in RLCUSDT wich can grow the price

RLC breakout confirmed, Ready for moonRLC successfully breakout and hold above the resistance zone. RLC updated its roadmap on 4 March and added new partnership and development events. RLC is a decentralized cloud computing project and providing orcales. We have seen how Oracle coins pumping like BAND and LINK. RLC will be next.
Buy Zone: 3350-3365
Target: 3640-3900-4150-4580-5100

RLC still have roomrsi turning bullish and macd golden cross happening
gonna hold small bag for +150%
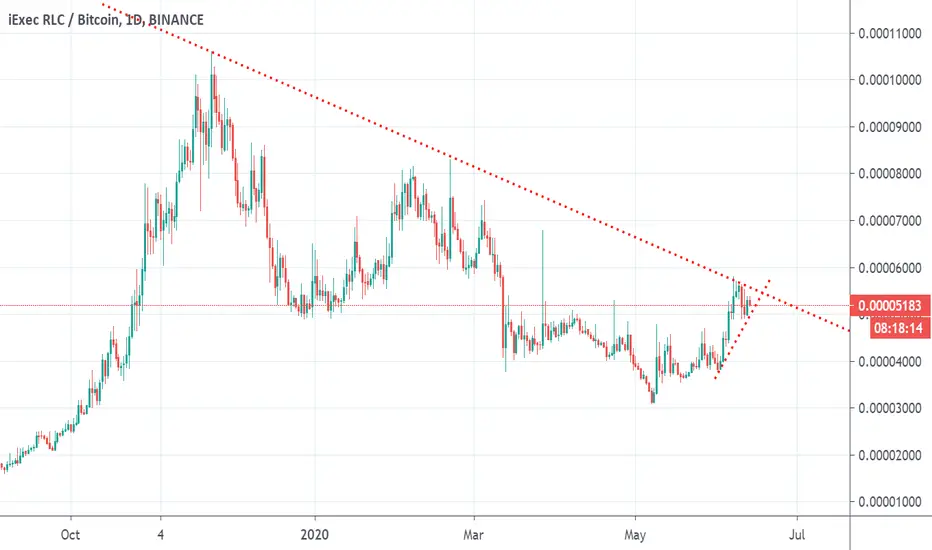
RLCBTCBuy it below 2820 sat.
Target on the chart.
if the trend line is broken exit otherwise it should hit the targets easily.


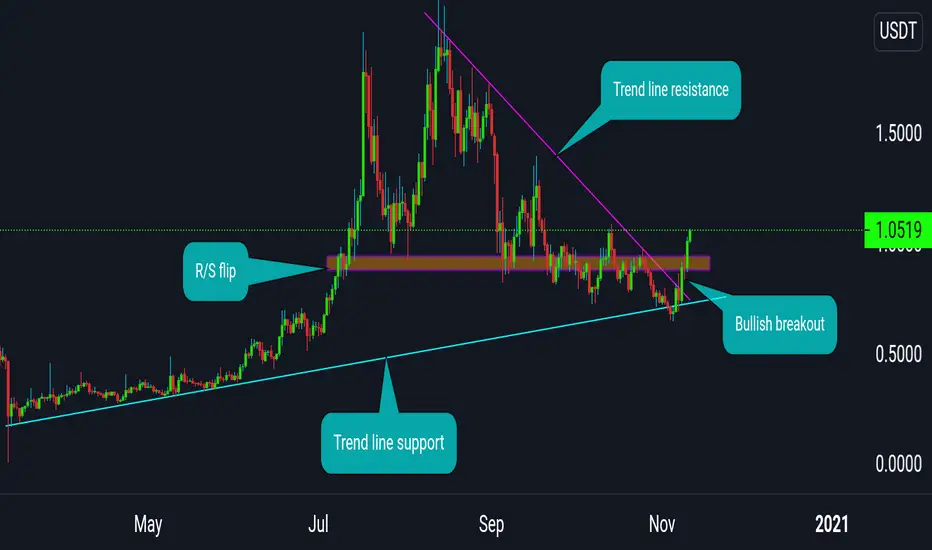
RLC/USDT looking bullish Rlc / usdt
Analysis
Became back above trend support
Break trendline resistance
Bullish green candels
Break local resistance between 0.87-0.935
As long as RLC above this local support we can expect big pumps like before
Please have a plan before trading and use stoploss
Good luck and happy trading


Here I buy iExec RLC and RLC will go upHere I buy iExec RLC and iExec RLC will go up. The price is testing the major resistance, so now I buy and the shark attack will start on this one. And iExec RLC will go up. I'm buying everything! See you up there


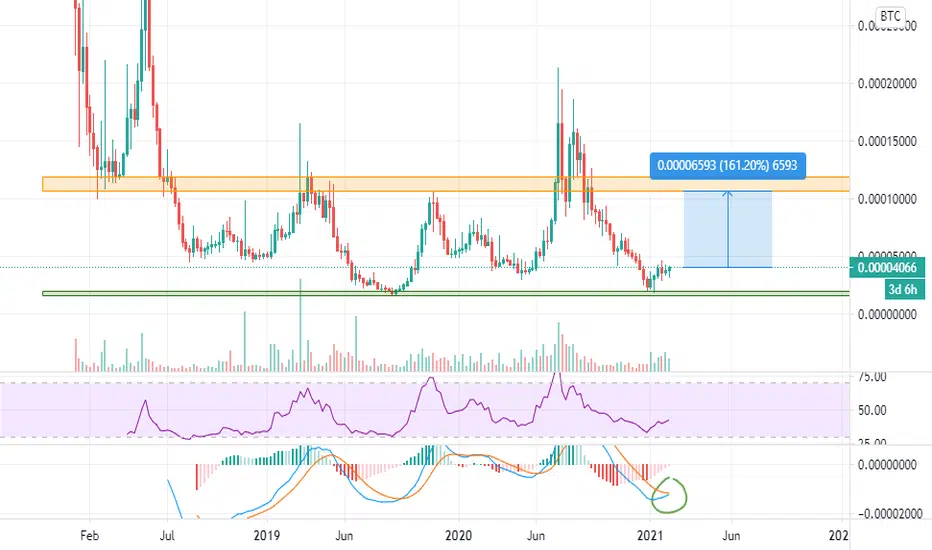
RLC-BTC ready for a 50%-90% pump!?>>> Weekly closed above 21 MA.
>>> Breakout from falling wedge with daily candle close.
>>> Broken resistance level (4550-4900) and flipped into support.
>>> A daily close above 200 MA will makes this bullish .
>>> 1st Resistance: 7780-8300 (50%)
>>> Main resistance: 9800-10600 (90%)

RLC/BTC (Two Bullish Patterns?)RLC/BTC
-3D TF is forming a potential bullish descending channel
-we can also see on the left side history
-if the pattern breaks to the upside
-there is a chance of an inverse H&S is likely in play
-now, to trade this descending channel
-we wait for the break of the trendline resistance
-to confirm the market direction and our bias decision
-the pattern target is the swing top up to 10633

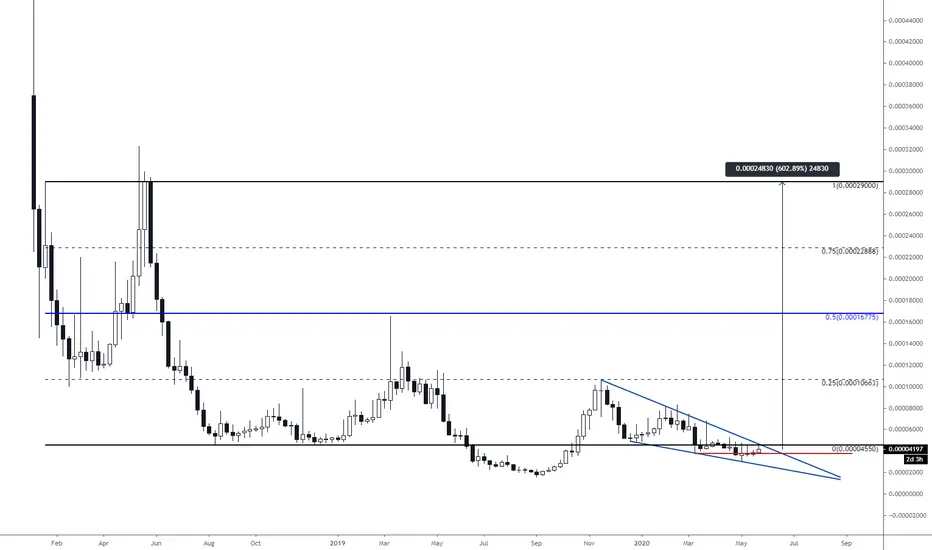
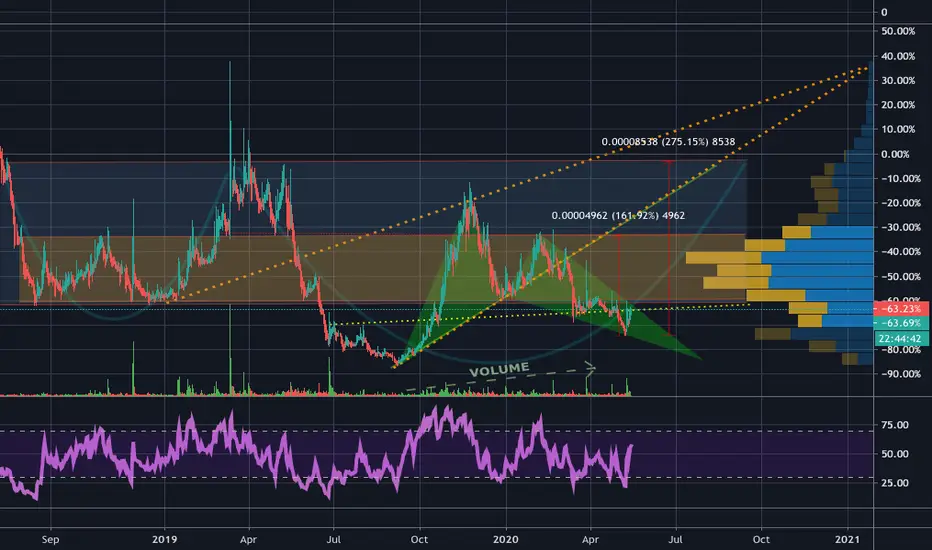
RLC - Go long for 600% profitsRLC is looking amazingly bullish on higher time frame charts.
Bullish falling wedge into high timeframe support. Target is range high at 29000 sats