WeBull Look Ahead $BULLRecently took a look at WeBull and I believe there is a huge arbitrage opportunity from NASDAQ:HOOD to $Bull.
Although RobinHood is building something much much bigger than anticipated, including banking, I think WeBull can take some of $HOODS market share depending on their direction.
-Webull's total revenues grew 32% year-over-year to $117 million in the first quarter of 2025, according to SEC filings
-Customer assets increased 45% year-over-year, reaching $12.6 billion at the end of Q1 2025, according to Webull
-The number of registered users grew by 17% year-over-year, according to Webull
-Partnership with prediction market Kalshi will grow profits for WeBull exponentially.
www.nasdaq.com
This Might be the best price to get in today depending on WeBull's Success.
Robinhood

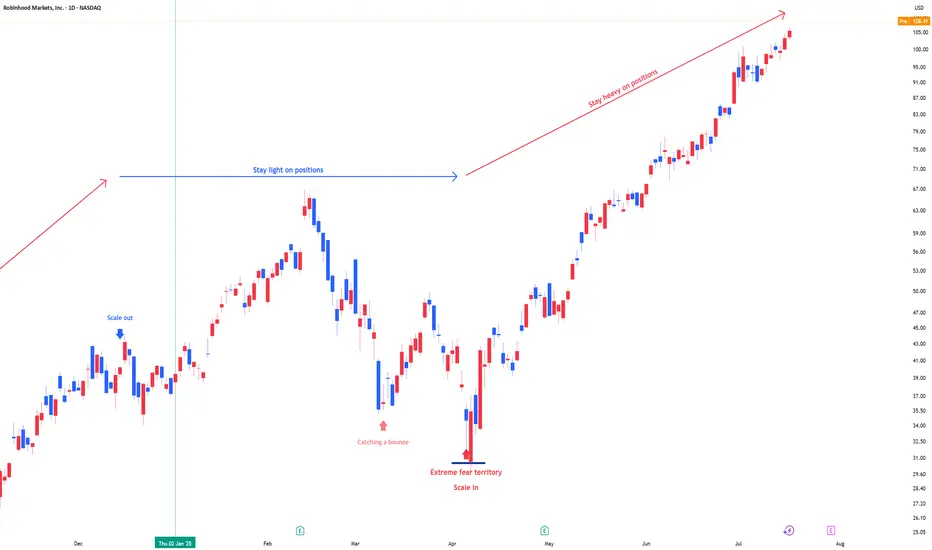
RobinHood Markets: Stay heavy on positionsHOOD position size is adjusted in line with US market signals for underweight or overweight allocations. During panic phases, 2x leverage ETFs are on the table
Stay heavy on positions.
HOOD - Get Great PricingNASDAQ:HOOD and I have had a mixed relationship over the years. I have had my biggest win on the HOOD brokerage (5,000% options trade, $1200 into 60k) and at the same time I was present for the Derogatory removal of the GME button (of which I had sold before they took that button).
After many years and brokerages, I find myself returning to HOOD but this time much more experience... To my surprise, I love the platform, and I still recommend it for new traders for the ease and UI. Honestly, unless you are dealing with BIG Volume or Hot-Keying out of Low float Penny stocks, It will suit you just fine.
Now Let's Talk HOOD.
In this MASSIVE range we are looking at High $67, and a Low of $35. Thats a 47% drop!
Although we have recovered a bit, Many are eager to find a way to get in the range. Here I have put together 2 scenarios to help you play your position with confidence.
Better Price = Better psychology
Whether we are shopping at grocery store, or if we are buying a car. Getting a good deal feels better. But how do you feel when you know you overpaid?
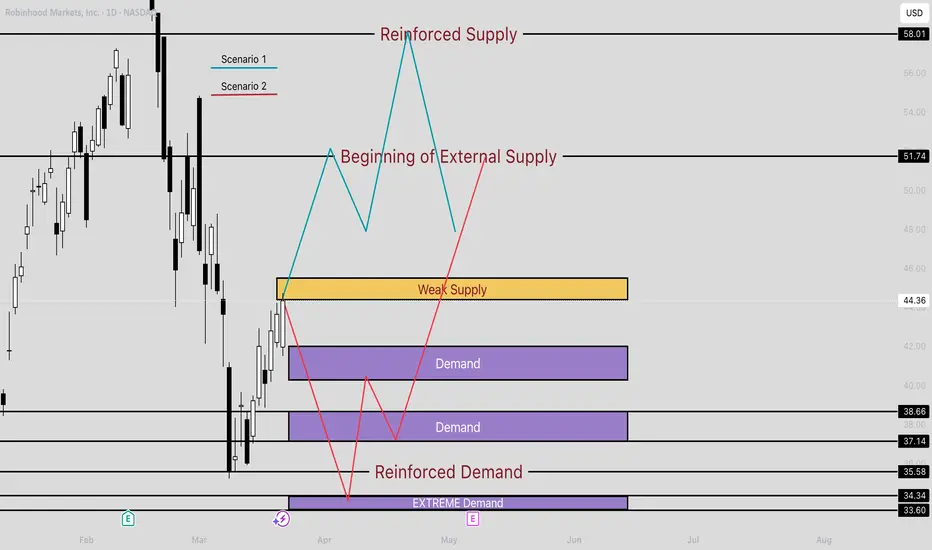
TLDR: The best deals are the lowest purple zone "Extreme Demand" if you are Long, "Reinforced Supply" (at the top) if you are looking to get short or take profit.
Under the HOOD
Currently Robinghood is running into a little bit of a supply zone labelled "Weak Supply"
This is a new player, and we don't yet know how just how big this player is. So far they have absorbed some of that buying pressure coming in, but I would not be surprised if they we overtaken or even gapped above come Monday. This brings us to our first Scenario
Scenario 1: Blue line
With the break above "weak supply", there is headroom all the way until 51.74. This is where we will see some supply initially and maybe a small rejection.
Why would it not reject back down to a demand area like 41? Great question.
If this overtakes that "Weak Supply" zone, this will make a strong case that there is momentum behind the wheels here. I think there will be a new player reinforcing this buying if this happens all the way to the Finale at $58.01. From here I would consider taking some profits, maybe partials, or looking for some Puts.
Scenario 2: Red line
Getting Rejected by "Weak supply" would be evidence that this move was fluff. Those two demand zones may try to hold a bit, but with the lack of buying interest in the
$45 area, this won't make those buyers feel confident.
This is different story when comparing to the "Extreme Demand" zone (lowest purple zone). Buyers here have PROVEN that this is something they are very interested and they are not done accumulating yet. So from this location buyers feel confident that they are getting a good price*( see fn. )
From here this should drive demand up again, crushing shorts, and sending another nice squeeze to test that supply at 51.71
WHEW! if you made it this far, I appreciate your time!
Upvote/Follow if you enjoyed this idea, there are many more to come!
Happy trading!
* (This is a good price, because buyers are showing that it is. Although, if it did come down here, this would be the 4th test of this area. I still think there will be strong demand here, but this isn't the best tests. 2nd and 3rd were stronger.)
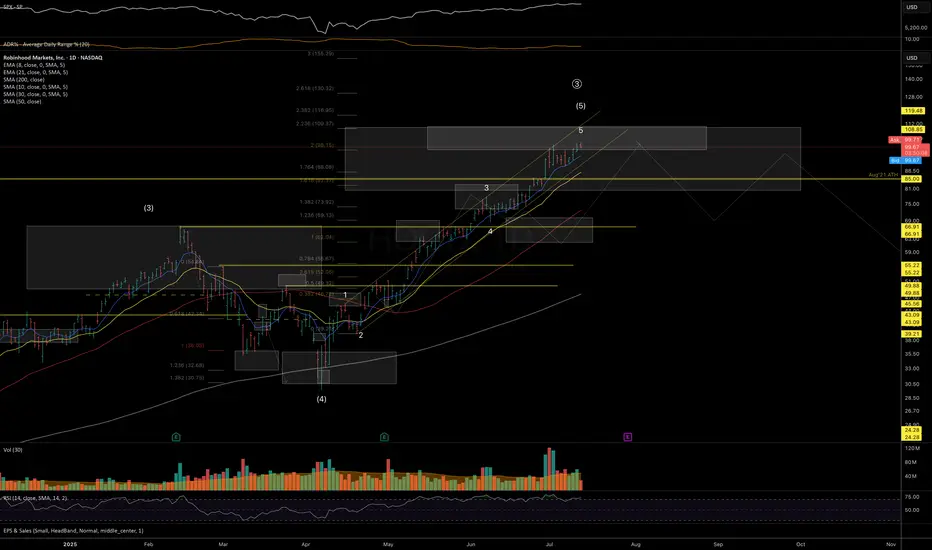
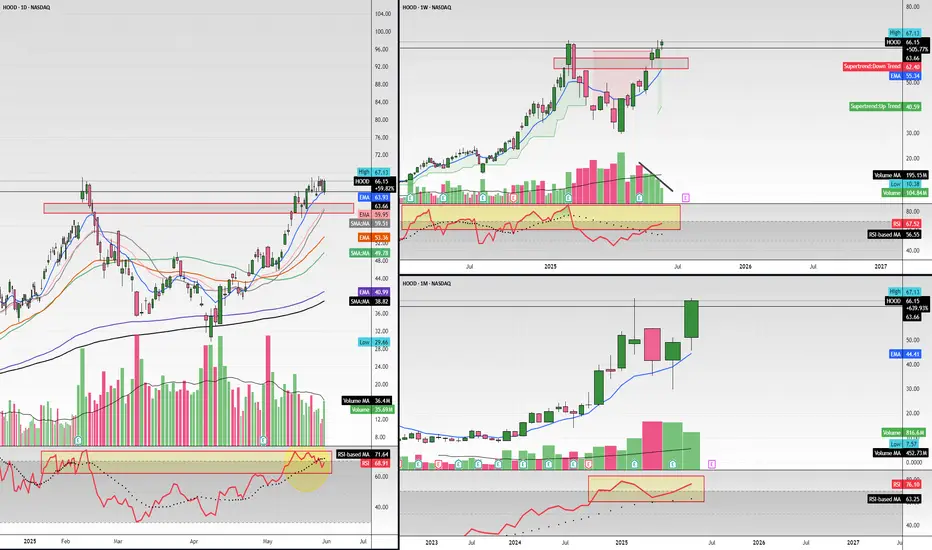
HOOD — In Key Macro Resistance ZonePrice has reached a major resistance zone, with the 110 level marking an ideal spot where downside pressure may begin to dominate and a mid-term top could start forming. Macro support for the macro-uptrend structure is at the 80–65 area.
Hedging near current levels may be prudent - especially ahead of earnings and while volatility remains relatively cheap.
Weekly view
Daily view:
Thank you for your attention and I wish you successful trading decisions!
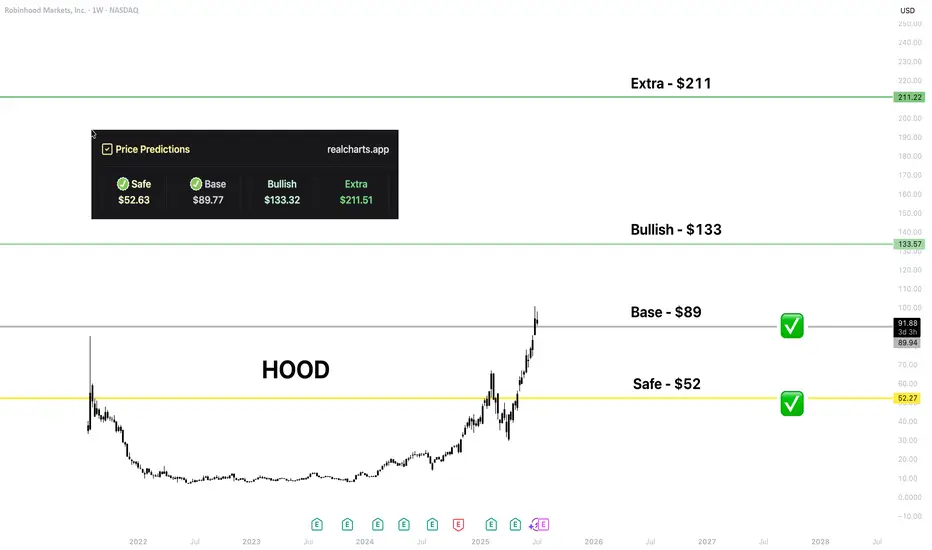
HOOD | Price PredictionI love that NASDAQ:HOOD has made a huge step in crypto integration.
That level is from my platform. I hope HOOD holders would be happy to get every level; time will show!
Insiders are selling Roblox ! Heres the levels you need to knowIn this video I lay out a solid plan for a move to the downside for Roblox after a 100% move to the upside since April of this year .
I demonstrate why I believe we will take a 30% retracement and provide confluent evidence to support this theory.
There are some fundamental reasons that I also did include alongside the technical analysis which is not my regular style but important given the context.
Tools used in the video 0.382 Fib , Standard Fib pull, Trend based fib and pivots .

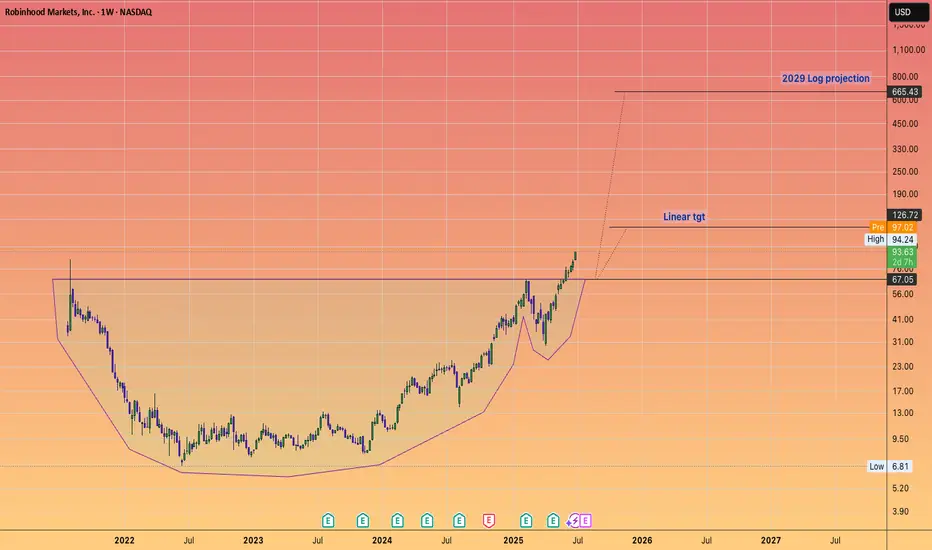
VLAD impaling WALL ST!I believe Robinhood will achieve over One Trillion dollars in assets in very short order.
Giant Cup and Handle is your technical setup.
(I have covered hood at the low)
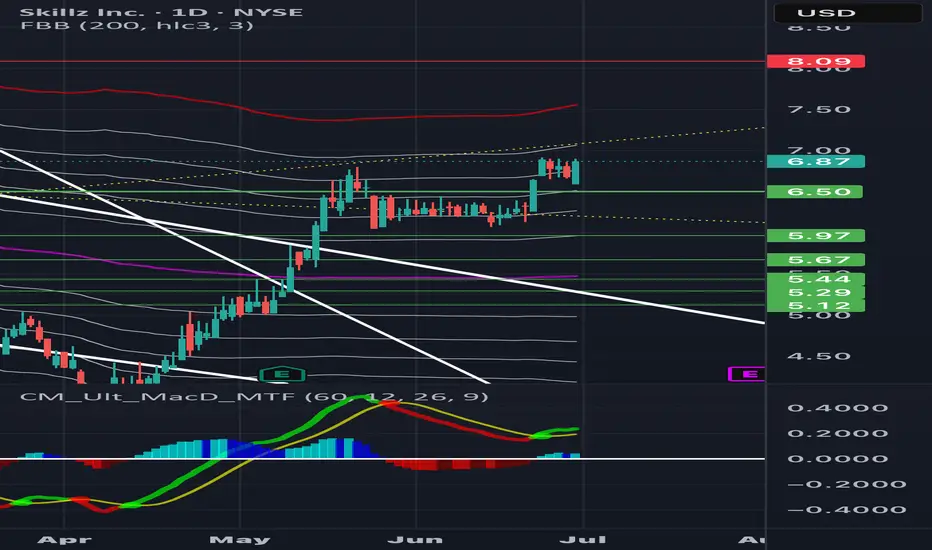
Sklz 7.55-8.09 new floor ?!Big volume, i think july 18 calls are micely valued for 7$
Based on chart purely, i think the set up is there for the move north.
Big volume spike on 4hr looking like a nice green week. SKLZ ANS PARADISE TO THE MOON. 10$ by december
Not financial advice but i think its a nice price.
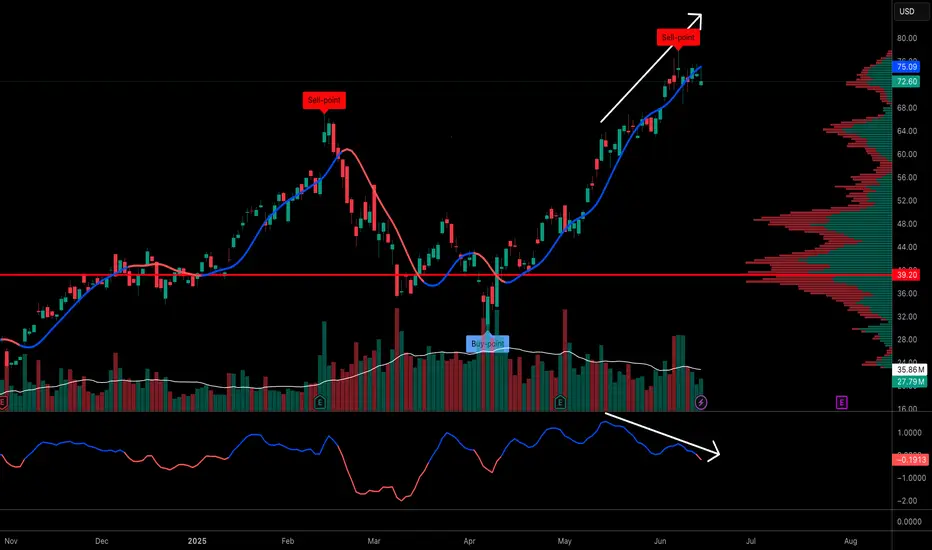
Time to take profits on Robinhood, it's extremely overboughtit's just about time for profit taking with summer here. Aiming for around $45-50 prior resistance turns to support, to buy back in at the 0.618 golden fib level as well.
Trump’s $1,000 baby accounts: what it means for markets President Trump’s “Trump Accounts” proposal would give every American newborn a $1,000 investment account placed in a stock market index fund, managed by the child’s guardians. The plan is part of the Big Beautiful Bill and has support from CEOs including Nvidia’s Jensen Huang, who called it “a seed fund for America’s next generation.”
If passed, the plan could drive consistent inflows into U.S. equity markets and benefit platforms like Robinhood, Vanguard, and BlackRock. Robinhood’s CEO will attend the White House event announcing the plan.
Robinhood shares are trading near multi-year highs, boosted by strong earnings and the acquisition of crypto exchange Bitstamp.
Shares also rallied recently on hopes the company would be added to the S&P 500, an inclusion that typically attracts passive fund inflows. While it wasn’t selected in the latest rebalancing, continued growth keeps it on watch for future inclusion.

HOOD Swing Trade Plan – 2025-06-06🚀 HOOD Swing Trade Plan – 2025-06-06
Bias: Bullish (High Momentum + Catalyst)
Timeframe: 5–10 days
Catalyst: S&P 500 inclusion speculation, crypto rally, retail momentum
Trade Type: High-conviction naked call option
🧠 Model Summary Table
Model Direction Strike Entry Price Target(s) Stop Confidence
Grok Strongly Bullish $80 $3.90 +100% -50% 85%
Claude Moderately Bullish $78 $4.67 +50–150% -40% 75%
Llama Moderately Bullish $80 ~$3.85 $5.00+ < $75 or -50% 80%
Gemini Strongly Bullish $80 ~$3.88 $5.00 / $7.00+ < $75 or -50% 70%
DeepSeek Moderately Bearish $70 PUT $1.70 $2.50 / $3.40 > $79.17 or -50% 75%
✅ Consensus: Strong bullish trend supported by technicals and macro catalysts
⚠️ Bearish Divergence: DeepSeek warns of exhaustion risk
📈 Technical & Sentiment Summary
Price Action: Trading above all EMAs; price extended above upper Bollinger Bands
RSI: Extreme overbought across daily timeframes (RSI > 80)
MACD: Strongly positive on all models (15m, daily, weekly)
Sentiment: Positive S&P 500 inclusion buzz, retail FOMO, and crypto tailwinds
VIX: Falling → favorable for long calls
Max Pain: $66 (could cause pull later in expiry week)
✅ Final Trade Setup
Parameter Value
Instrument HOOD
Direction CALL (LONG)
Strike $80.00
Expiry 2025-06-20
Entry Price $3.90
Profit Target $5.85 (50% gain)
Stop Loss $1.95 (50% loss) or HOOD < $75
Size 1 contract
Entry Timing At market open
Confidence 75%
💡 Rationale: Aligns with dominant trend and event-driven momentum. Best R/R with defined risk on extreme FOMO move.
⚠️ Risks & Trade Watchouts
RSI overbought → any market pullback could hit stop quickly
S&P inclusion may trigger “sell the news” reaction
Theta decay risk intensifies late next week
Max pain at $66 could drag prices if momentum fades mid-week

RobinHood - Urgent News - Afterhours SelloffOn June 6, 2025, S&P Dow Jones Indices announced no changes to the S&P 500 index in its quarterly rebalance, marking the first such instance since March 2022. This decision notably excluded Robinhood Markets Inc., despite speculation that it might be included due to its market capitalization exceeding $20.5 billion and recent strong performance. Following the announcement, Robinhood's stock declined over 5% in after-hours trading
The next S&P500 quarterly rebalancing is set for September 2025....perhaps the next leg higher needs to wait until them
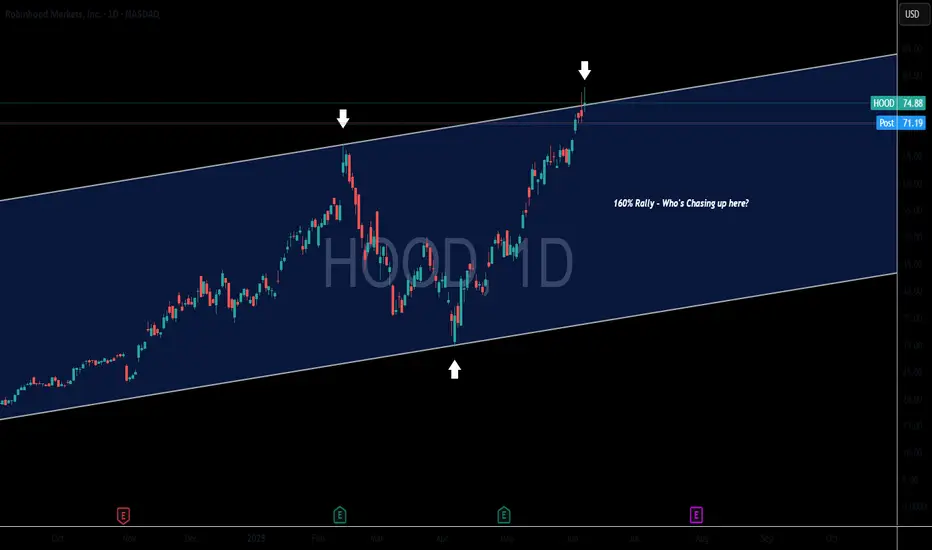
As of June 6, market close, Robinhood's stock is trading at $74.88, with a market capitalization of approximately $36.85 billion. The company has experienced significant growth, with a 365% increase in stock price over the past 12 months and a 50% surge to start 2025. Analysts project continued revenue and earnings growth, with an average one-year price target of $51.19 per share
We issued put option alerts to our members and shorted this live stream on Friday afternoon.

Why is ROBINHOOD dropping in afterhours? Robinhood's stock (HOOD) is dropping in after-hours trading due to several factors:
1. Regulatory Scrutiny: The company is facing increased attention from regulators, particularly regarding its expansion into unconventional financial offerings like sports betting-related features.
2. Analyst Downgrade: Wolfe Research recently downgraded Robinhood's stock from "Buy" to "Hold," citing valuation concerns and suggesting that the stock's upside potential has already been priced in.
3. Competitive Pressure: Traditional banks and fintech startups are ramping up their offerings, making it harder for Robinhood to maintain its market dominance.
4 Investor Uncertainty: Some investors are skeptical about Robinhood's new ventures, such as its push into banking services and prediction markets, which blur the lines between trading and gambling.
5. Technical Resistance: A clear parallel channel is bringing Hood back to planet earth. This stock has had a 160% run with minimal pullback, profit taking is highly likely.
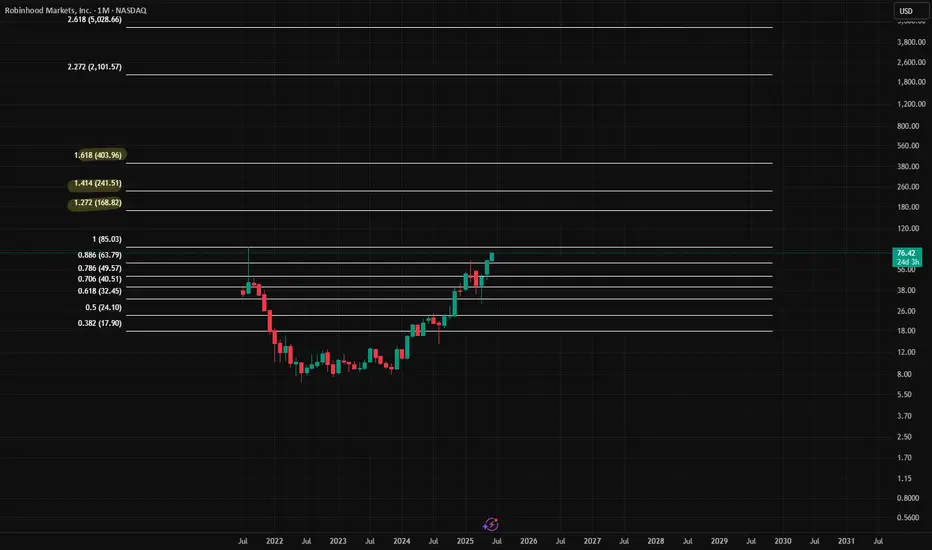
$hood is challenging AH!If hood manages to break previous ATH, it will gap up to the 1.272. I seea big target of the next golden ratio at 1.618.
HOOD Weekly Options Outlook — June 3, 2025📈 HOOD Weekly Options Outlook — June 3, 2025
🚨 AI Model Consensus: Moderately Bullish Into June 6 Expiry
🧠 Model Summary
🔹 Grok (xAI)
Bias: Moderately Bullish
Setup: Near 10 EMA, RSI oversold (34.7), strong 5-min EMA alignment.
Trade: Buy $72C @ $0.78 → PT +50%, SL −20%
🔹 Claude (Anthropic)
Bias: Moderately Bearish
Setup: Price below M5 10 EMA, high sell volume; RSI overbought daily.
Trade: Buy $69P @ $2.63 → PT +50%, SL −30%
🔹 Llama (Meta)
Bias: Moderately Bullish
Setup: RSI oversold (5-min), MACD mixed; Daily RSI high.
Trade: Buy $73C @ $0.60 → PT $0.90, SL $0.30
🔹 Gemini (Google)
Bias: Moderately Bullish
Setup: RSI oversold intraday; resistance near $73.15
Trade: Buy $74C @ $0.44 → PT $0.80–0.88, SL $0.22 or below $71
🔹 DeepSeek
Bias: Moderately Bullish
Setup: Oversold bounce potential in strong trend
Trade: Buy $73C @ $0.60 → PT $0.90–1.20, SL $0.30
✅ Consensus Summary
📈 Daily uptrend remains strong across all models
📉 Short-term RSI is oversold → bounce setup likely
📰 Bullish news + falling VIX = supportive backdrop
🧲 Max Pain @ $65 = caution for Friday pin
4 out of 5 models favor bullish call plays
🎯 Recommended Trade Setup
💡 Strategy: Bullish Naked Weekly Call
🔘 Ticker: HOOD
📈 Direction: CALL
🎯 Strike: $73
💵 Entry: $0.60 (limit order suggested)
🎯 Profit Target: $0.90 (+50%)
🛑 Stop Loss: $0.30 (−50%)
📏 Size: 1 contract
📅 Expiry: 2025-06-06
⏰ Entry Timing: Market Open
📈 Confidence: 70%
⚠️ Risk Factors to Watch
📉 Daily RSI >79 = potential for broader pullback
🔄 Max Pain @ $65 could act as drag near expiration
📉 Break below $71.10 invalidates bullish thesis
⌛ Theta decay accelerates after Wednesday

$HOOD great product but short term pull back here $58-$60Hello, I have multiple time frames up here: Daily, Weekly, and Monthly. I love Robinhood NASDAQ:HOOD as a broker, product and revolutionary company in the financial space. This is a great long term hold equity wise in my opinion but right now I am looking to short this name for a necessary pullback into $58-$60. It's overbought on the big time frames as you can see highlighted, it is possible it can break out of course but I believe with declining weekly volume this name will resort to some pullback. Also, Bitcoin can have some downside as well which will bring this name down with it. This ticker is volatile and can move 5-8% in either direction in just one session. I am looking for $60p about 3 weeks out, 6/20 date.
WSL
OptionsMastery: Looking for a breakout on HOOD!🔉Sound on!🔉
📣Make sure to watch fullscreen!📣
Thank you as always for watching my videos. I hope that you learned something very educational! Please feel free to like, share, and comment on this post. Remember only risk what you are willing to lose. Trading is very risky but it can change your life!

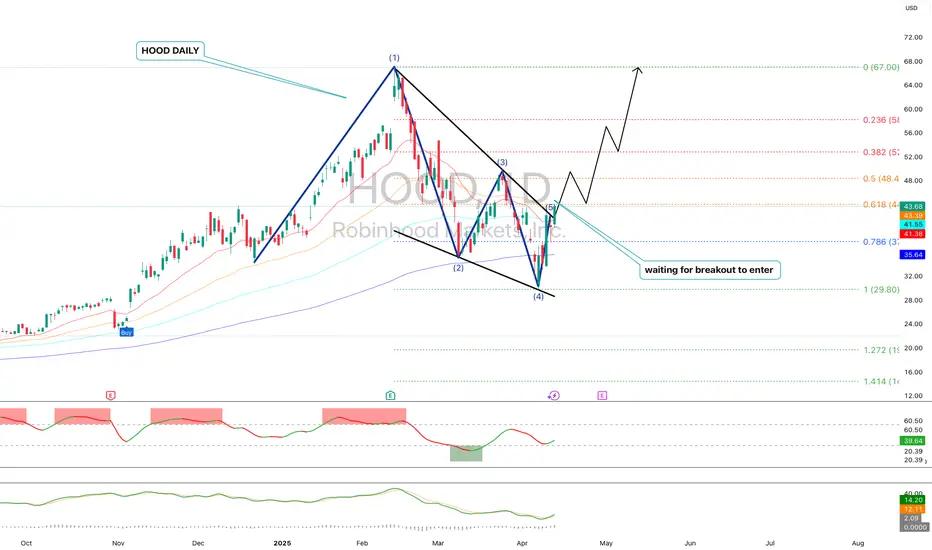
HOOD daily chart: breakout or fakeout? Key zone approaching.Robinhood's stock has formed a falling wedge pattern on the daily chart, indicating a potential bullish reversal. The price has broken above the 0.618 Fibonacci level at $44.00, suggesting further upside potential. Next targets are $48.40, $52.79, $58.22, and $67.00. RSI and MACD indicators confirm bullish momentum.
Fundamental Factors:
Robinhood continues to show revenue and profit growth, supporting positive investor sentiment. The company is expanding its services and attracting new users, strengthening its market position.
Scenarios:
Main scenario: continued rise to $48.40, then to $52.79 and higher.
Alternative scenario: pullback to $39.71 with potential decline to $36.00.
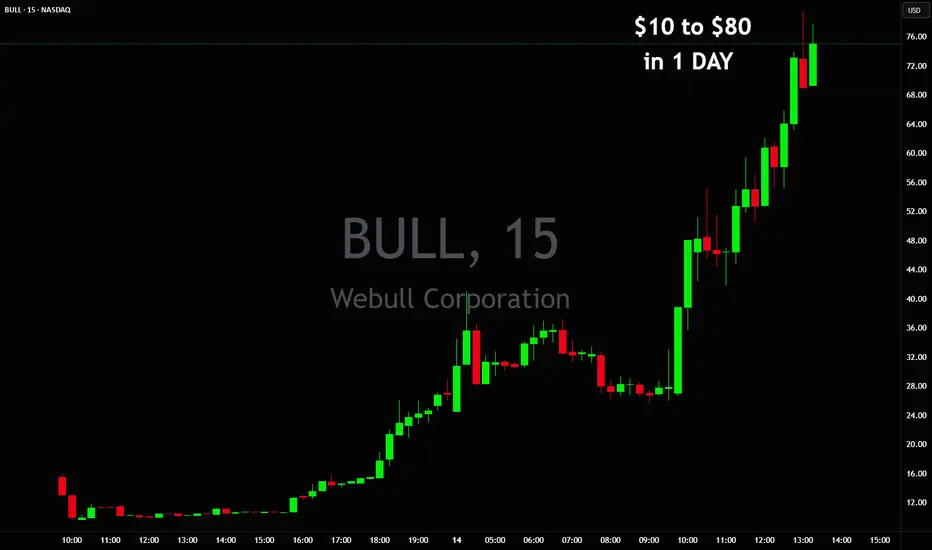
$10 to $80 in 1 day $BULL$10 to $80 in 1 day 💣 How do you know market is in a bubble?
When NASDAQ:HOOD valuation is so high their competitor NASDAQ:BULL decides to do IPO to catch some of the makert delusion going on and they fit right into all of it with their value going from $260 Million to $2 Billion in a day
why Robinhood’s stock ($HOOD) could be considered bullish:Analyst Upgrades : Robinhood has received positive upgrades from analysts, with a target price suggesting a significant upside. The company's growth in digital wealth management, AI-powered investing, and new banking features contributes to these bullish forecasts.
Strategic Investments : High-profile investors, such as Cathie Wood’s ARK Invest, have increased their stake in Robinhood, signaling strong confidence in its future growth potential.
Product Diversification: The company continues to expand its services, with new offerings like Robinhood Strategies, an affordable robo-advisor, which is expected to attract a broader customer base seeking wealth management solutions.
Positive Analyst Sentiment: Robinhood has an average "Buy" recommendation from analysts, reflecting general market optimism and the stock's positive outlook over the next 12 months.
Strong Earnings Growth: Robinhood's robust revenue growth rate (over 58% in the last 12 months) reflects its expanding market share and the potential for continued financial success.
Analyst Price Targets: Multiple analysts have set a price target for Robinhood with significant upside potential, indicating that there is room for further price appreciation in the coming year.
Market Positioning: Following political shifts, Robinhood's stock has benefited from increased interest in cryptocurrency trading and favorable market conditions, showing how external factors can favor its performance.
Technological Advancements: Robinhood’s investment in AI tools like Robinhood Cortex enhances its platform’s value proposition, improving user experience and engagement, which could lead to increased retention and growth.
Diversified Revenue Streams: Robinhood’s move into banking, offering high-yield savings accounts, allows the company to tap into new revenue streams, reducing its reliance on traditional brokerage commissions.
Favorable Market Sentiment: Robinhood is seen as part of a broader trend of stocks benefiting from shifts in market sentiment, particularly around the "Trump trade," showing how political and economic cycles can impact stock performance positively.
These factors together suggest a promising outlook for Robinhood’s stock, positioning it for continued growth and potential upside.

Robinhood’s Moment of Truth! Breakout, Retest, and Go? Hi,
Robinhood is one of the potential candidates to be included in the S&P 500 index. The new grouping will take place in 21. March
From a technical perspective, this is one of the possible zones where, after a short pause, we saw a breakout and now the price has come back to retest the consolidation area.
Of course, fundamentals play a big role here, but historically, a similar setup has worked well last year.
So, the zone is set—let’s see if this move repeats itself. Technically, the key range is $35 - $44.
Cheers,
Vaido

Magnificent Seven & Hot Stocks: A Technical OverviewHello,
The past few days and weeks have brought a lot of movement in the stock market, and things seem a bit more redish than before. However, these kinds of moments also bring good opportunities—if you know where to look.
That’s why I decided to take a closer look at the some stocks from Magnificent Seven, scan some of the top market cap stocks, and give a short overview of what’s happening and what to watch.
Since technical analysis helps bring clarity in uncertain times, I will go over some key levels and liquidity zones that could present good opportunities. I will also cover a few stocks that are currently making headlines and generating a lot of interest in the investment world—such as Robinhood (HOOD) and Palantir (PLTR).
Let’s see what the market has to offer.
Microsoft (MSFT)
Microsoft has not made any major moves in the past few weeks, but selling pressure has started to build up, and the stock is now trading at its lowest levels in the past six months.
The most interesting and strongest support area is between $290 and $300. This is a level worth keeping an eye on.
--------------
Amazon (AMZN)
Yesterday, I got an alert from TradingView that AMZN has dropped into an interesting price zone after a small correction. If you don’t already use alerts, I highly recommend setting them up—keeping track of every stock manually is nearly impossible.
The $175–$210 zone is technically solid. Yes, it’s a wide range but there are different strategies you can use here.
Amazon (AMZN) – What to do?
If you don’t own AMZN yet, this could be a good spot to start building a position slowly. Buy a little in the upper part, a little in the middle, and a little in the lower part of this zone to get a balanced entry.
If you already own AMZN, I’d rather wait and aim for the middle of the range if you want to add more. If the stock takes off from here, you already have a position, so there’s no real FOMO. No need to rush.
Of course, this is just a technical view—you should still analyze the fundamentals and your investment thesis. The technicals have spoken and now it’s time to listen to the fundamentals. That way, you get the full picture and can react accordingly.
--------------
Alphabet (GOOG)
GOOG failed to break through the psychological $200 level. It has tested this level multiple times since the start of the year, but the result has been red candles.
If you already own the stock and are considering adding more, or if you are thinking about an entry, the $140–$160 zone is worth watching. At the moment, I don’t see a more logical technical entry.
--------------
Meta Platforms (META)
META has dropped 12% from its all-time high in just a few weeks. The stock has now slowly come to, what I call, a "picking zone" (if you have a better name for it, let me know! :D)—meaning a price range where those who make regular buys might want to pay attention.
Right now, the key levels to watch are ~$612 and ~$500, with $500 being the stronger level. The price has consolidated there a bit longer than around $612, and it also acts as a psychological support level.
--------------
Berkshire Hathaway (BRK.B)
Berkshire has reached what I consider a profit-taking zone. If your fingers are itching and your wallet is waiting for a top-up, then why not? This doesn’t mean selling everything, but it could be a good spot for a partial exit—especially if you need capital for something else.
Why is this a logical profit-taking point?
Looking at previous price behavior around round numbers, we can see a pattern that works every time and your money can be “stuck” for years.
When a stock approaches a big round number for the first time, it tends to:
Consolidate – move sideways for a long time.
Get a strong correction – like Berkshire has done before.
Let’s make the round number concept clearer.
Imagine a stock price starts moving up from $30 and eventually reaches $1000.
Within this range, the key round numbers for me are: $50, $100, $200, $500, and $1000. These are levels where major market reactions often occur or levels that I trust the most as a criterion.
Let’s take Berkshire for example, touching these numbers for the first time:
$50 → 50% drop, took 5 years to recover.
$100 → Another 50% drop, also took 5 years to break higher.
$200 → Multi-year consolidation, 20% drop.
$500 → And now we’re here—your choice!
In a long-term portfolio, there are essentially two types of sales:
The investment thesis is no longer valid
Capital is needed for another purpose
If neither of these conditions is met, there’s no real reason to sell. However, if you need capital within the next six months, this could be a good point to do so. Historically, we’ve seen a pattern where the stock either undergoes a correction or remains stagnant for an extended period.
That makes it a perfect candidate for profit-taking—and if a correction does happen, there’s always the opportunity to buy back at lower prices.
At the moment, buying this stock could mean it stays within this price range for a few years, so I wouldn’t rush into new purchases.
--------------
Tesla (TSLA)
Historically, Tesla has followed technical analysis well due to its high volatility. It reflects market psychology very clearly, leaving visible footprints on the chart...
-----
I also cover these topics in-depth over on my Substack channel, where I break down the full picture and share my insights on the rest. If you want the complete breakdown and my take on what’s next, head over to my Substack (ENG).
🔗 Find the link in my BIO under the Website icon or simply copy and paste it directly.
See you there! 👀
Cheers,
Vaido

RobinHood - A bounce looks imminent!A bounce looks imminent on NASDAQ:HOOD
- At previous S/R Zone ✅
- At volume shelf ✅
- At green support beam ✅
I see a snapback higher to $56 🎯
Not financial advice
