From Stonks to Bonds: ES->ZNThis is another relatively simple idea. As we are at the end of July we can start to take a closer look at monthly charts.
1. August has finished down (open to close) 60% of the time (12 of the last 20 years).
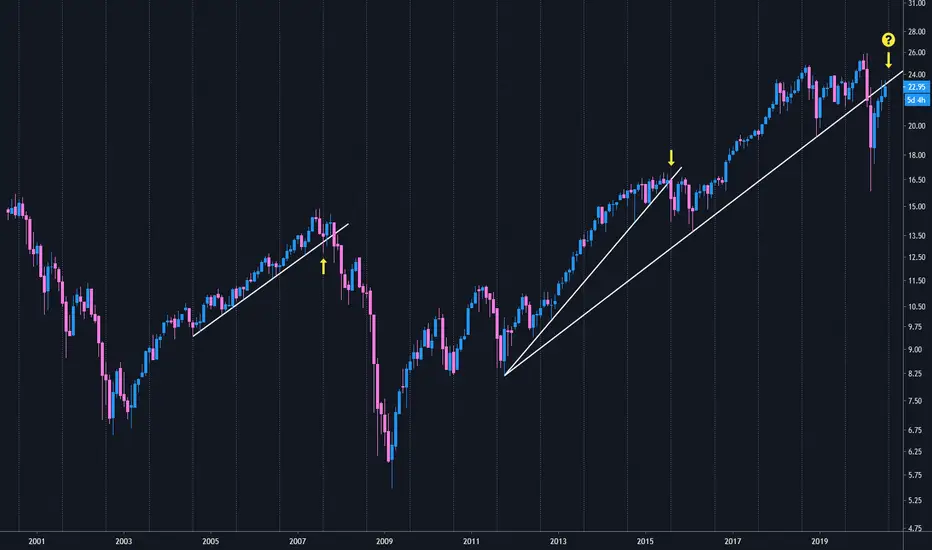
2. Coming into major multiyear trend lines, August seems to have been pivotal... literally.
- August 2007 dropped and pierced support but closed above the trend line providing the last bounce before breaking the uptrend a few months later in November 2007.
- August 2015 opened below the trend line, tried to stay above but ultimately collapsed.
- August 2020? Well here we are in the last week of July retracing the break of the trend line from back in February 2020. With point 1 above and where we currently are in relation to this trend line, this will be important to watch this week. A close at or below the trend line is bearish and this ought to sell off for the next few months. A close above will indicate a bit more of a neutral to bearish stance.
So what exactly does this all mean?
- Simply put a rotation from stocks to bonds.
How to interpret this:
- When this chart goes up, the e-mini SP500 futures will outperform the 10 year note futures.
- When this chart goes down, the 10 year note futures will outperform the e-mini SP500 futures.
Outperforming isn't what you think...
How one of these can outperform the other is:
a. One goes up more than the other.
a. One goes up while the other stays flat.
c. One goes down less than the other - aka one sucks less than the other.
d. One goes up and the other goes down (typically unlikely but still possible).
How to play this:
In order to accurately play the situation described above, there would be a simultaneous short position in ES1! and a long position in ZN1! in equal weight (notional value of the contracts).
In relation to outperforming:
a. The ZN1! long will make more than the ES1! short would lose.
b. Same thing as 'a'.
c. The ES1! short would make more than the ZN1! long would lose.
d. The best scenario, ES1! short makes money at the same time the ZN1! long makes money.
Rotation
Study of Sector Rotation During 2020 Market CrashFor Growth Investors, there were a few shocking days over the past months where the indexes went up but our portfolios went sideways or down. There's no worse feeling than having the market go up and have your portfolio go down.
The cause was sector rotations as investors moved into "discounted" stocks that were hit the worst during the market crash of 2020 and hopes were they would recover sharply. This chart is a visual history of the last several months and confirmation of the rotations occurrences.
I'm using Select Sector SPDR ETFs: XLK, XLY, XLV, XLC, XLB, XLP, XLRE, XLU, XLI, XLF, XLE. The base chart is a composite price index of all the ETFs listed. The other lines are % change comparison of each ETF starting just before the market made all-time highs and then turning downward.
Please post in the comments if you see other insights in the chart.
Here's hoping for a continued recovery and a safer world over the rest of 2020.

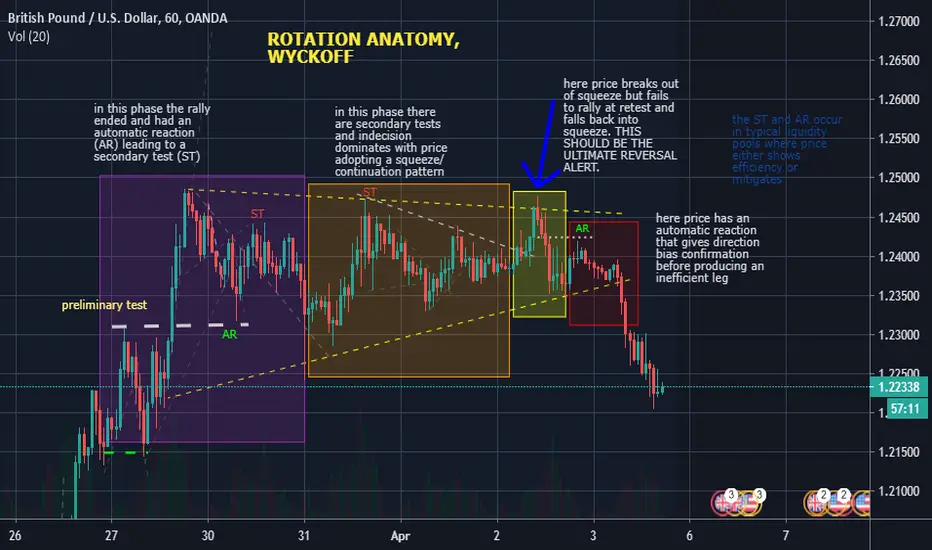
CRYPTO MARKET UPDATE - Bitcoin and Altcoins - Follow the money! In the stock market, the rotation of capital mirrors the business cycle, as managers favor specific sectors according to the economic conditions. For this reason, when we analyze the stock market we compare the main indexes (S&P, Nasdaq, Dow, Russell). Capitals rotates in the crypto ecosystem too. It’s possible to analyze the crypto market using the same technqiues that have been successfully applied on the stock markets for decades. Here we see four charts: Bitcoin (the largest capitalization asset), Large Cap Index, Mid Cap Crypto Index, Micro Caps. Let’s follow the Wyckoff Story .
1. BITCOIN: INSTITUTIONS TAKE PROFIT. MONEY ROTATES INTO MID CAPS AND MICRO CAPS.
2.MICRO CAPS AND MID CAPS START TO OUTPERFORM. INCREASING VOLUME ON MICRO CAPS INDEX IS A SIGN OF INSTITUTIONAL INTEREST
3.MID CAPS SHOW SELLING NEAR THE OVERBOUGHT LINE. ON THE MICRO CAPS INDEX SUPPLY IS QUICKLY ABSORBED ON THE WAY UP: OUTPERFORMANCE.
4.CLIMACTIC MOVE ON THE MICRO CAPS INDEX. BITCOIN AND LARGE CAPS INDEXES (LAGGARDS) FALLS TO THE OVERSOLD LINE, BUT VOLUME IS RELATIVELY LOW.
WE ARE CURRENTLY CONSOLIDATING. BITCOIN NEEDS TO PRESERVE THE $8K LEVEL.
Complete Wyckoff Crypto Report vol. 25 available for free here:
www.wyckoffanalytics.com
WyckoffAnalytics course starts in July:
Trading the Crypto Market with the Wyckoff Method
www.wyckoffanalytics.com
You can join us live for the webinars or listen to recordings of all the sessions.

Trader/Investors must understand this process.......!Kindly comment with " Yes " for agree and "No" for disagree with this post:
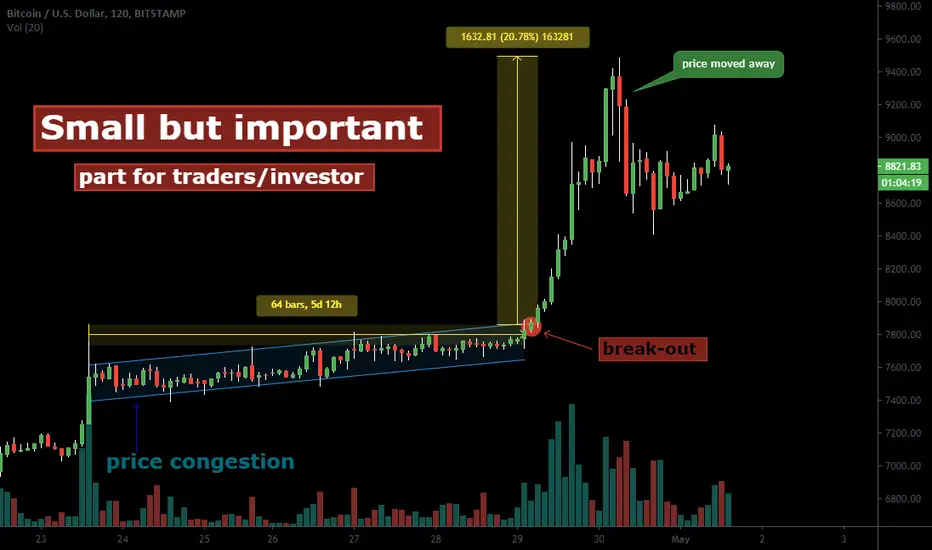
Before the break-out, I've informed that " Breakout will give truck of Money. ..!". Exactly, we seen this statement was TRUE, didn't it? (End of idea link is added about this idea)
Let's talk step by step was happened here.
The Width of congestion area was equal to height of the price surged.
From my personal experience and the survey/observation I'm talking about this is almost the same area as price congestion in size of width and height after the price break. Let's try to explain in another words:
Horizontal width of congestion size = Vertical price move after break-out. (Generally, i noted that price moved away so far after breakout whenever congestion area is much longer.)
--> Let's talk little more deeper about CONGESTION area:
In the congestion area, accumulation or distribution process process. We will talk about accumulation only because, this was happened here.
Accumulation : smart money, money makers, huge fund-management, landlord of global investors whatever you called them they grab/connecting instrument(stocks, currency,etc) from retail investors in very slow motion because, they can smell insider upcoming news. After the completing this accumulation, news clear and price start to go away from the breakout area.
later i will try to explain you more deeper about it practically. Yes, obviously we can smell the process accumulation/distribution.
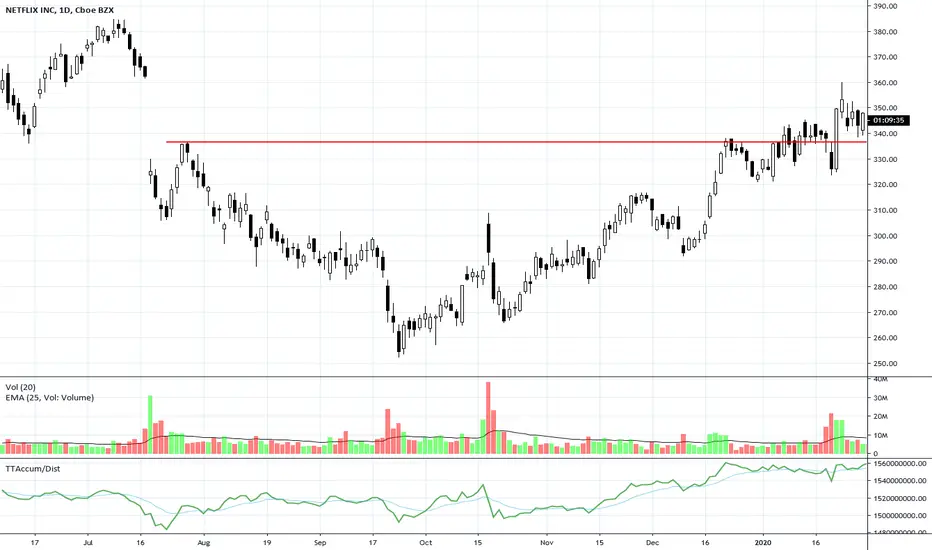
NFLX Working on an Intermediate BottomNFLX has moved into the completion of bottom area, but is struggling to hold on to that completion level. Some rotation is present from large lots. NFLX did not have a strong pre-earnings run.
ISRG Topping RiskISRG dropped sharply from its recent new all time high. The stock is struggling with heavier large lot rotation action at this level. Volume is too low and Balance of Power shows heavy rotation.

ADBE Correction BouncesCorporate buybacks struggle against heavier rotation by Dark Pools. ADBE steps downward to bounce at support levels.

AMD Forms Slip-Slide DowntrendOnce again, AMD has failed to break to a new higher high. Heavy Dark Pool Quiet Rotation™ is thwarting upside action at this time.

KLAC Compression Pattern Ahead of Earnings SeasonKLAC has hit a new all-time high and is now in a tight compression, even as Dark Pool Quiet Rotation™ continues.

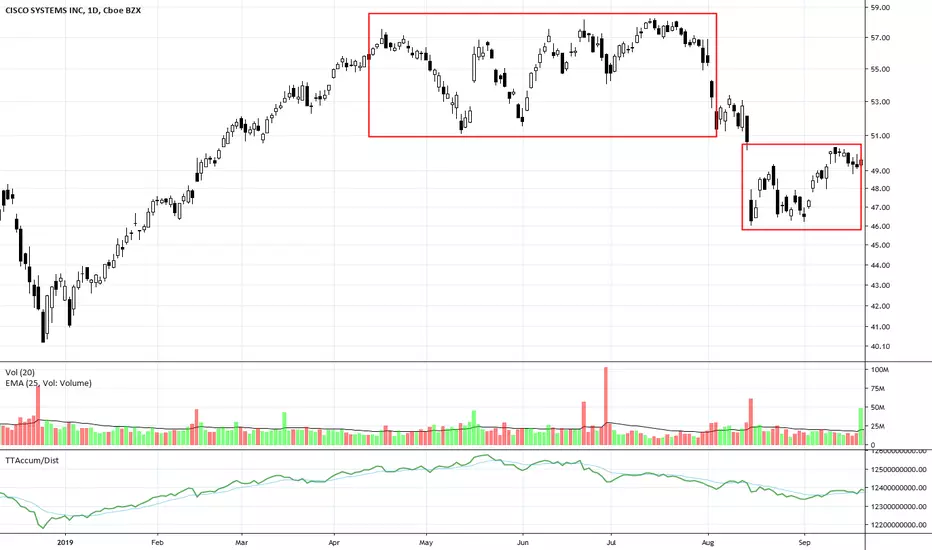
CSCO Stalls at Resistance with Rising RotationCSCO had heavier Dark Pool Quiet Rotation™ in recent weeks. A High Frequency Traders Gap Down on Spiking Volume occurred earlier. The stock is holding near the gap down area.
GOOG HFT Gap Followed by RotationHigh Frequency Traders’ huge flood of pre-open market orders gapped GOOG up. This was immediately followed by a surge of Dark Pool Quiet Rotation™. Dark Pools are using Buybacks and High Frequency Trader gaps to sell, in order to lower their inventory of stock.

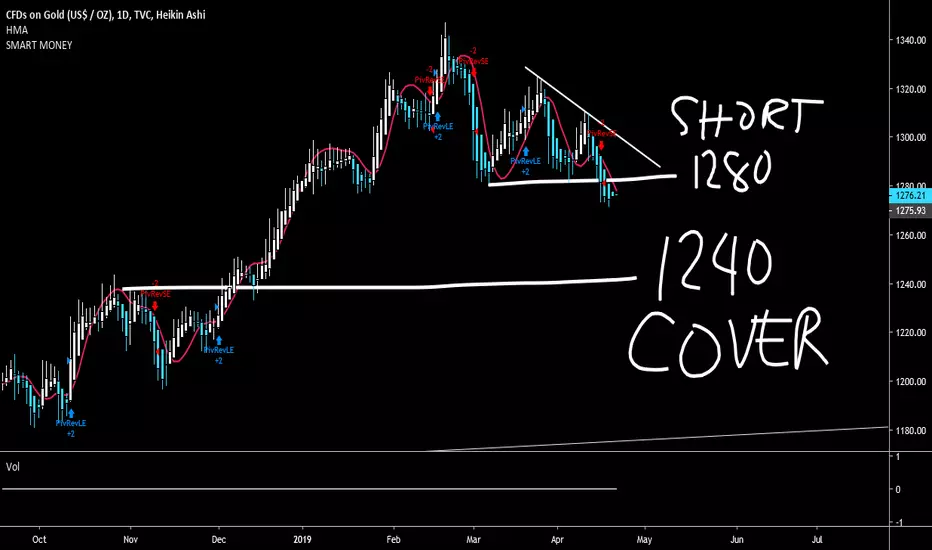
GOLD: 1276 do nothing for nowrecent campaign of GOLD suggest a SELL on STRENGTH or SHORT
a bit of (for a lack of better word) desperation as SAFE HAVEN
believers of this issue may just migrate to other asset class
like COPPER as the next METAL to OPERATE
or the DIGITIZED version BTC or BITGOLD
JPM: Dark Pool rotation against buybacks ahead of earningsJPM kicks off the official earnings season this week with a report due out Friday. All attention will be drawn to these early banking industry reports that will set the tone for the entire 1st quarter earnings season. The stock has had buyback activity recently while some Dark Pools lowered their holdings. The chart shows patterns of Dark Pool rotation.

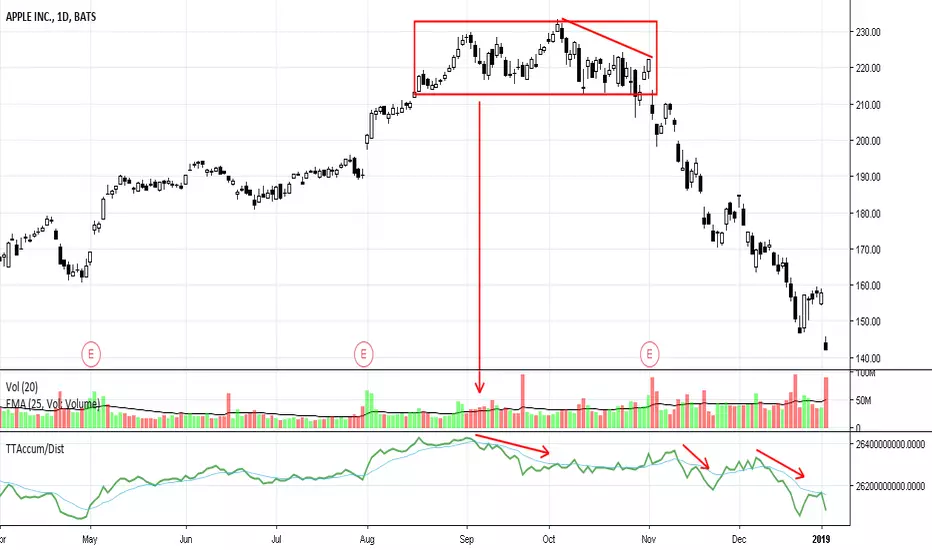
AAPL Technical Pattern: Dark Pool Rotation AFTER Earnings SeasonOne of many things I strive to teach my students is to watch what happens to a stock immediately AFTER an earnings season. This is the telltale activity of the Dark Pools who prepare for the next earnings season weeks ahead of those reports. So when AAPL started showing signs of large-lot rotation in September and into December, that was your cue that this big bellwether had slammed into a Market Saturation Phase hard, very hard.
CEO Tim Cook warned this morning that quarter 4 of 2018 is going to have significantly lower revenues. AAPL has been making minor enhancements to its iPhone for years and running on fumes without any new exciting products coming through. And NO, the Augmented Reality it has hurriedly rushed to promote is not true AR and will not likely help the Market Decline Phase. It could take a long time to recover with no new technology emerging from this company for this year or longer.
CRM: Risk for Topping Due to RotationSalesforce.com has had a great run up from the 2015-2016 correction. CRM stock is now showing an extreme Angle of Ascent on the weekly chart and has risk of a potential topping action. Support is weak at the bounce area at this time. The stock shows steady rotation patterns as the final peak high developed. Rotation is the lowering of inventories of a stock by Dark Pools.

Bearish rotation after a false breakA false break of the yearly high is a sign of weakness. After the running the stops and testing the break out point, it is possible for the Dollar to make another high making a big MM like crown formation. But a high probability scenario is for it to test the major fib retracement level before coming down hard.

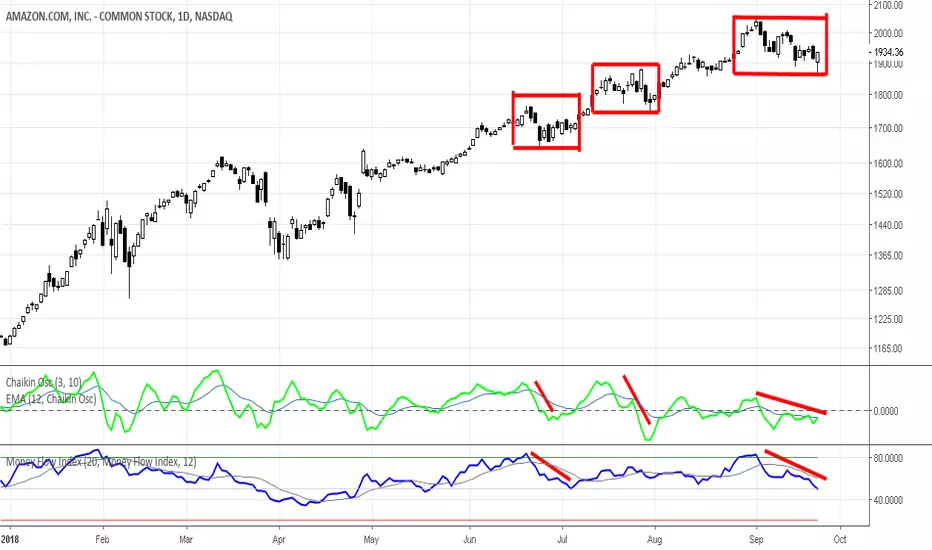
Institutional Rotation in AMZN Chart PatternsRotation has been underway most of the summer months in the AMZN chart. Rotation is the slow, methodical selling of shares held in inventory for the Trusts of Derivative Developers and the Charters of Mutual Funds. The largest institutions are lowering their risk, expecting the tariffs imposed on Chinese imports to impact AMZN with either rising prices and costs or lower sales and revenues, or both. The rotation is NOT disturbing the price trend, as is their intent.
Martha Stokes, C.M.T.
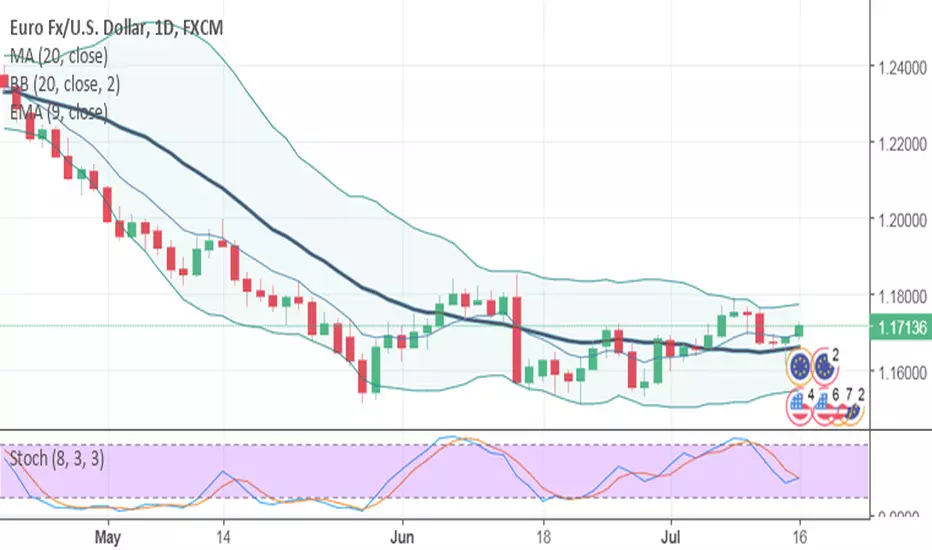
Rotational Trading Plan For The EUR/USDThe Euro has gained ground against the USD for the last two sessions. Of course, the downtrend of 2018 is still massive, with the EUR/USD struggling to gain any bullish momentum.
In such a tight market, playing a rotational strategy is a good way to rack a few pips. A buy from above daily support at 1.1657 is a positive entry to the bull. A modest profit target of 10-12 pips is ideal, using a 1:1 risk vs reward ratio.
This trade idea will remain valid for the next 48 hours.
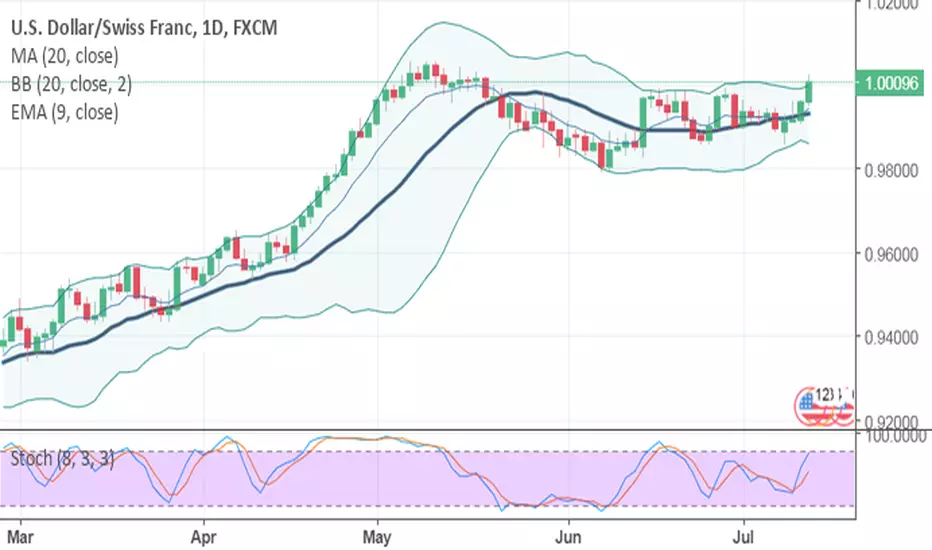
Shorting The Triple Top/Yearly High In The USD/CHFToday’s session has brought serious bullish heat to the USD/CHF. Price has steamrolled through the Triple Top Pattern (.9985-.9990) and appears poised to challenge yearly highs. A short from the Triple Top Pattern/Yearly High (1.0056) is a likely profitable trade.
Here it is:
1)Entry: Sell 1.0049
2)Stop Loss: 1.0077
3)Profit Target: 1.0021
4)Risk Vs Reward Ratio: 1/1
BTC rotation not finished - WAITHello!
There is no time for the uptrend market. There are good news around the BTC, but the rotation is not complete. Then I expect a few months of gradual growth before the hype comes.
Be patient.

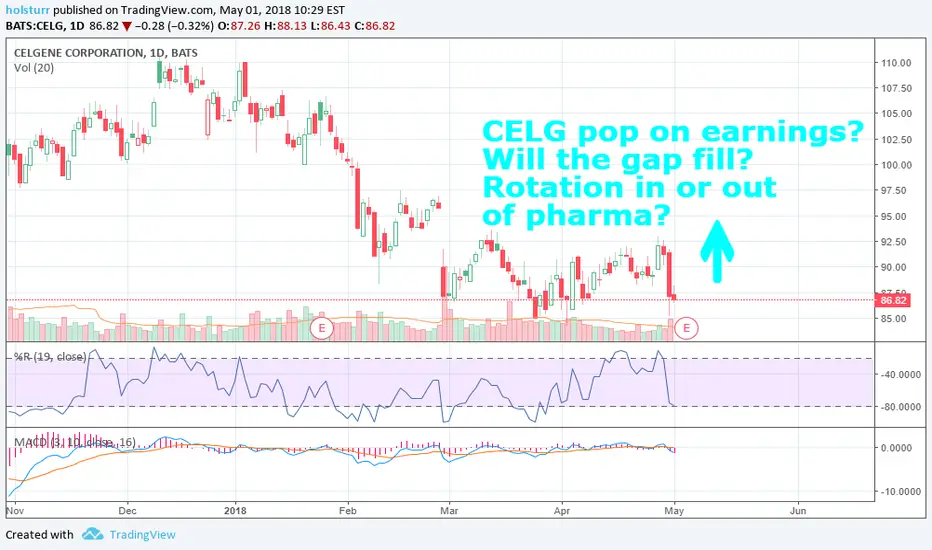
CELG Q1 2018 Earnings on 5/4 - Are Traders Rotating In or Out?What a tumultuous market.
Celgene reports earnings on 5/4. Earnings play aside, are traders and investors rotating into or out of pharmaceuticals?
The market doesn't know what to do with itself right now. With a Fed meeting taking place over the next couple days, Caterpillar's CFO claiming we've seen a "high water mark" with Q1 earnings, rate concerns, trade concerns, and historic geopolitical uncertainty (especially regarding Iran's nuclear program), some traders claim we've already seen April and May's strongly anticipated earnings rally.
If that's true, 1. what a squishy rally, and 2. where do we go from here?
Thanks in advance for lending me your attention!
Pharmaceuticals are a wild card among the classical winners (usually, financials, materials, and energy) and losers (REITs, utilities, etc.) in a late-cycle rotation.
It can be argued a lot of Wall Street cash has sought the arguably greener pastures of cryptocurrencies. But could we see prices move upward along the right side of the chart in pharmaceutical companies?
CELG reports earnings on 5/4. Celgene took a dive on 4/30 on troubling news about a drug in its development pipeline.
Did that drop make Celgene a bargain buy?
CELG's drop on bad news has put it at technical support. The uncertainty of its earnings report and the market overall has it arguably priced cheap. Is Celgene a cheap buy in this market with a possible earnings surprise on 5/4 and upside potential with a rotation into pharma?
Please like, follow, and share, and maybe we can have fun and do great things together.
Thanks again!
See it on the site: holsturr.com/category/markets/charts/
** For speculative and research purposes only - good luck! **
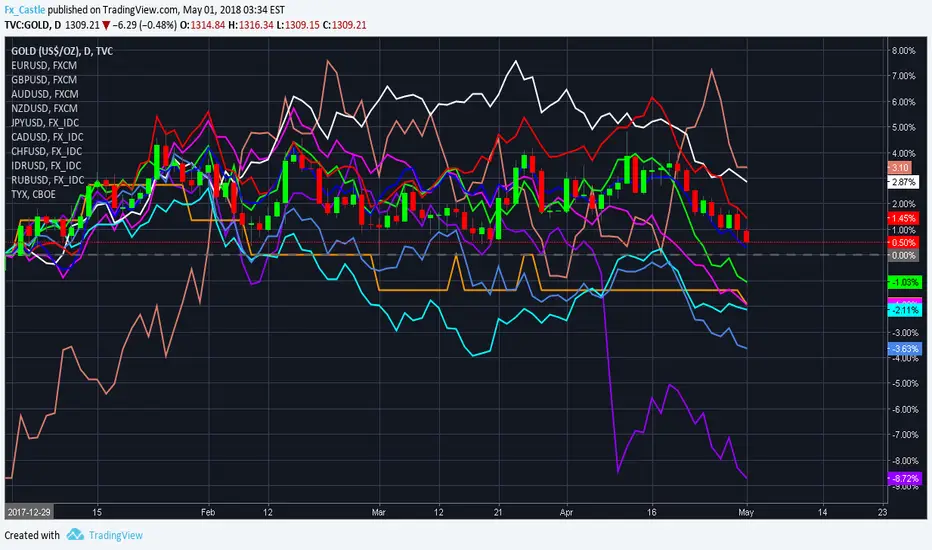
Market GrowthAll of them going down except TYX (USA 30 years bond yield) its mean money rotation from east to west. its gona be deflation for a moment. Just wait before hyper inflation.