4H GAME, BULLISHHi traders!
This is continuation of my last analysis on GAME , where I said:
"I'm waiting to buy at 0.001005 few Game and 2-3x more at approximately 0.000764 maybe little bit sooner since the 1D trendline can reverse the price move before testing 0.000764."
Right at the beginning one thing to remember:
===============> Don't forget to place your limit orders - it'll cost you money <================
So Game didn't do exactly what I expected, but all price levels are already tested.
The move was just a little bit faster.
========================> What's going to be MY next move? <=======================
1) I'm bullish right now
we have really beautiful risk/reward ration (if things don't mess up)
trendline still holds
2) I'll be careful - You need to be careful
if the price gets under support zone (yellow rectangle), it won't be funny
by "gets", I don't mean spike, I mean close and create one whole candle below support zone
3) From my experience - When it seems 100% obvious, it will mess up
I believe there is a chance we will "spike test" middle of rotation at 0.000628
if this happens, we would be in a huuuge loss in case our SL is set according the rule "close and whole candle below"
And this is exactly why you have to do also your own research. When things mess up, I will know what to do. I did the analysis and I know what to expect. If part of your strategy is wait until someone posts update on trading view, WOW! That's the worst trade ever made.
Anyway, my solution for risk management(possible, not all at once):
open 1/3 now, 1/3 at support zone, 1/3 at middle of rotation
open full position now with SL below support zone and 2nd position at middle of rotation
open full position with SL according to "close and whole candle below", use lower TF to define this since the moves can be really fast
Potentials are already set, price levels don't run away, they are still here:
1. 0.001005 (low RRR, close smallest portion of position)
2. 0.001146
3. 0.001298
4. 0.001491
Those are all potential temporary reversals of trend, except 0.001298 this one seems really strong (maybe not temporary).
Some pictures of puppies:
If you don't understand, this means that support zone around middle of rotation is STRONG.
Rotation

EURAUD - Rotation FrameworkHi,
I am explaining the Two Peaks Rotation Framework to my Students.
Great Opportunities were available in this Rotation to Bearish.
Thank you
Girolamo Aloe

$BTU Long IdeaCurrently the 50DMA sits at about 4.14, looking for a decent pullback into that range as close as possible, from there i need to see a rally from 4.40-4.45 to really start scaling in.

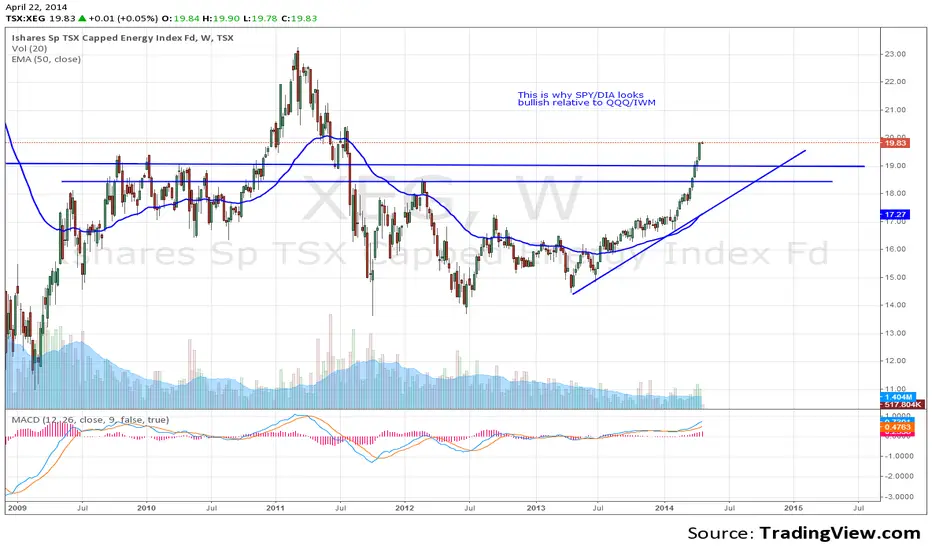
WHY SPY/DIA looks more bullish XEG is represents the capped energy index of TSX and SPX companies, so its not exactly a true representation for SPY/DIA looking the way it does. But, you get the general Idea.- investors are flocking to other sectors and dividend paying stocks.
Im bullish energy sector as i think is undervalued and forgotten for most of 2013, but i think ive missed much of the recent bullish move. I'm still long term Bullish, but we could use a pull back here. Maybe the 18.50 ish is level would be a good long entry. If tomorrow XEG sells off from here then SPY/DIA will not look as bullish anymore, at least in the short term.