Roundingbottom
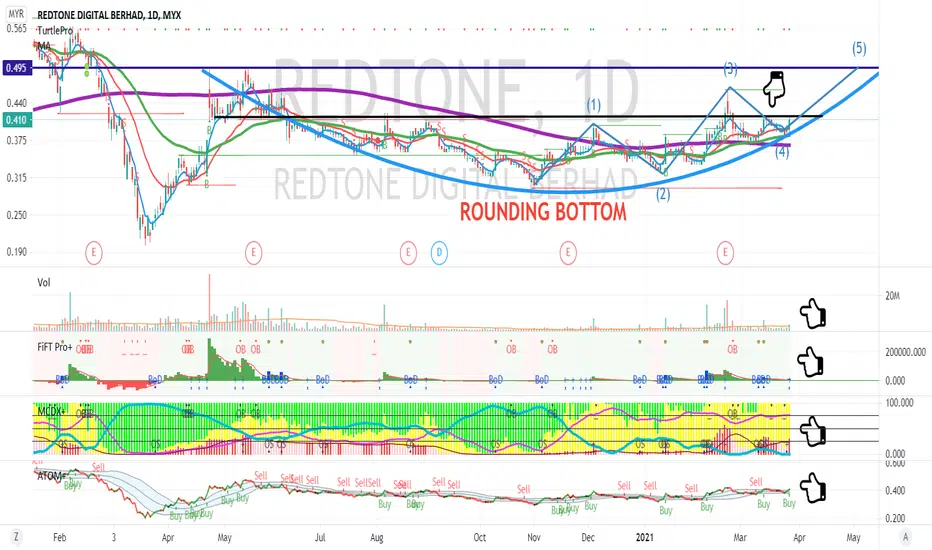
DSONIC BREAKOUT FROM ROUNDING BOTTOMMYX:DSONIC
TURTLE PRO EMA 20 CROSSED UP EMA50 (UPTREND)
SLOW TURTLE BUY ON BREAKOUT WITH VOLUME
FiFT +VE (STRONG BULL)
MCDX+ BANKER SPIKE UP
BANKER 75%
ATOM BUY STAY ABOVE RIVER + SQUEEZE & EXPANDING

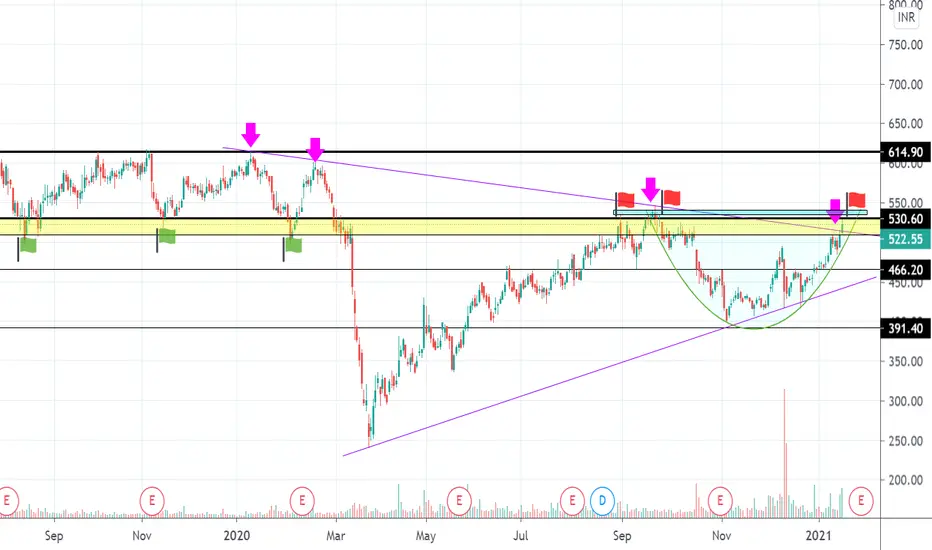
Multibagger Stock -Jagran Prakashan-- BREAKAWAY-GAP preceded by a valid ROUNDED-BOTTOM pattern formation by more than a year.
-- One-year Accumulation
-- Volume on the gapup day is a lifetime high.
-- Weekly gapup (very rare)
-- Bullish Engulfing pattern
-- Risk : Reward = 1:4
-- Resistance at every level (so be careful)
LTP - 60
Target - 75
Stop loss - 57

$AMC Rounding bottom in playThese are one of our favorite plays. Cup & Handle patterns
Please click a like if you like what you see on our chart.

NTPC - On verge of weekly Trendline BreakoutNtpc on verge of breaking weekly trendline resistance and looks like cup and handle too. one can enter at cmp or wait for 108.15 breakout...Target on chart...
Weekly chart

MAYBULK Rounding bottomMYX:MAYBULK
Rounding bottom
Slow Turtle Buy on Breakout
FiFT Spike up +ve
MCDX+ Banker spike up, 50% banker
Atom stay above river + starting expand

Southern Energy Corp $Maxmf Rounding bottomTSXV Chart with bullish rounding bottom
I love these plays!

$MAXMF What a GEM! $SOUSouthern Energy 2021 bounce back time! Multiple plays here and patience pays.
#oilandgas #Engergy #lightoil #naturalgas #acquissitions #OTC #TSXV #Roundingbottom
#Maxmf #Sou.V
This ones going to be a fun ride up

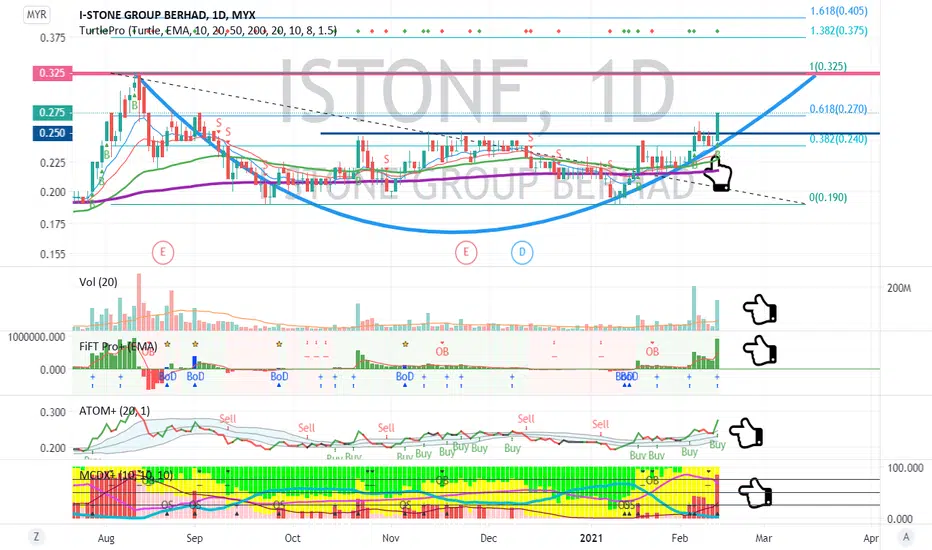
Istone Rounding Bottom MYX:ISTONE
Rounding Bottom
Slow Turtle Buy on Breakout
FiFT Spike +VE
MCDX+ Banker 80%
Atom At highway now !!!
SL below 0.24
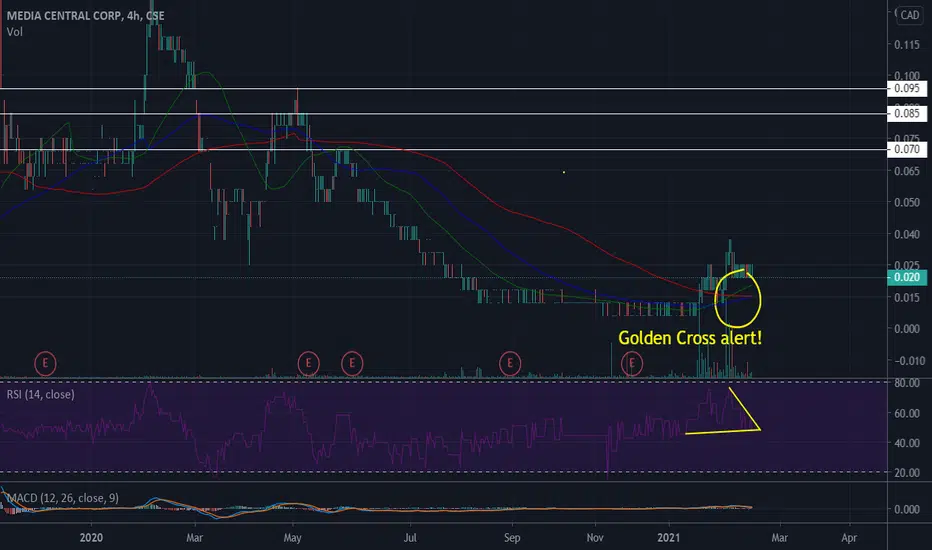
FLYY Golden Cross AlertWatch for the break out on the RSI. #Goldencross is very bullish and volume comes in fast and price can go parabolic. This ones been consolidating slowly and is due for its continuous uptrend. #roundingbottom
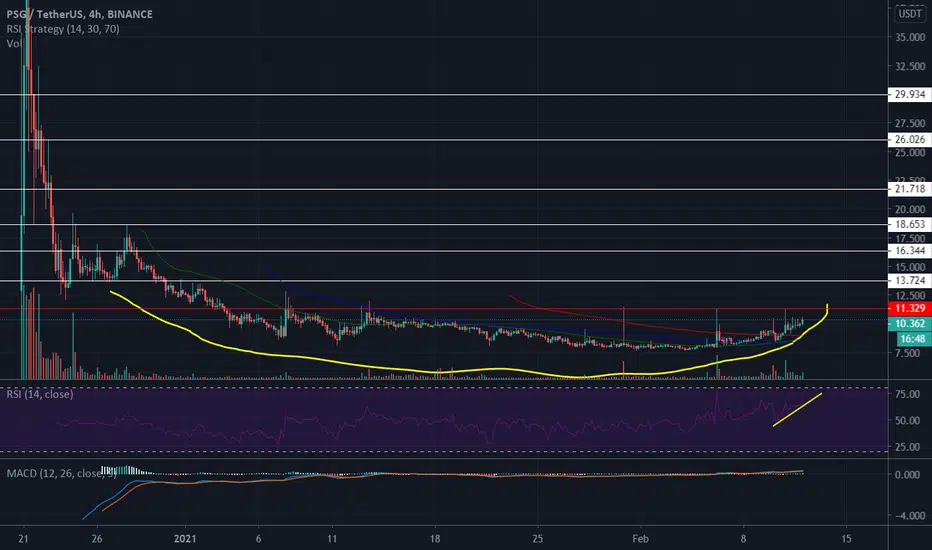
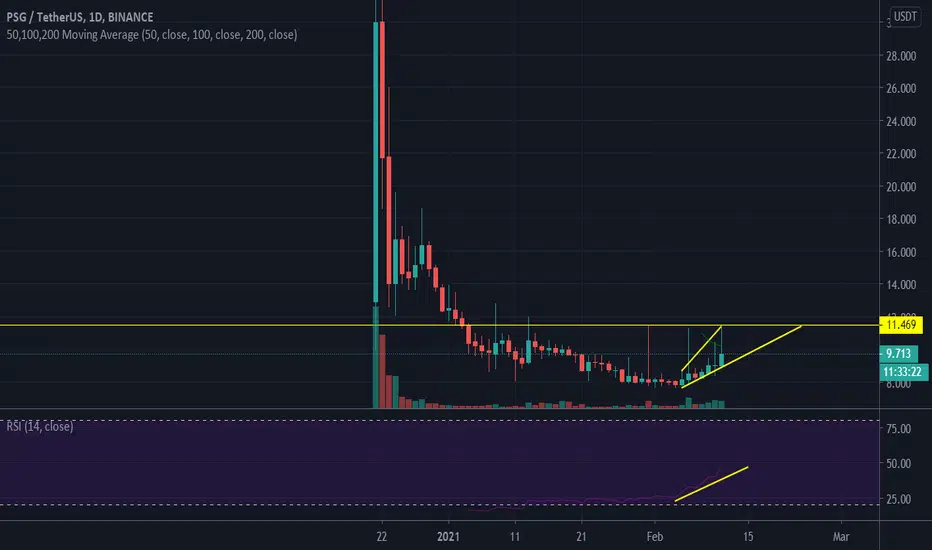
PSG USDT Rounding BottomPSGUSDT Rounding bottom is setting up beautifully. This is a mid to long term hold for us taking profits along the way.
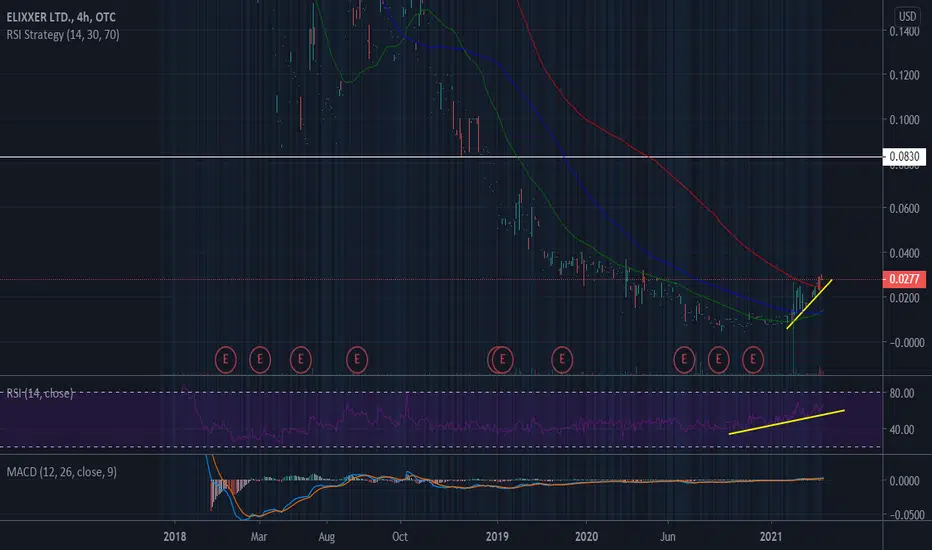
$ELIXF Ascending ChannelMid Term and Long Term hold on $ELIXF will reward you greatly
Not a race but once volume kicks in ..... Hold on!
PSG #USDT - Buy the breakoutPSG creating a rounded bottom with bullish momentum and is currently in an ascending channel
We will see a $30 token once again.
#PSG/USDT #PSG/BTC #ascendingchannel #buythebreakout #BTC #USDT
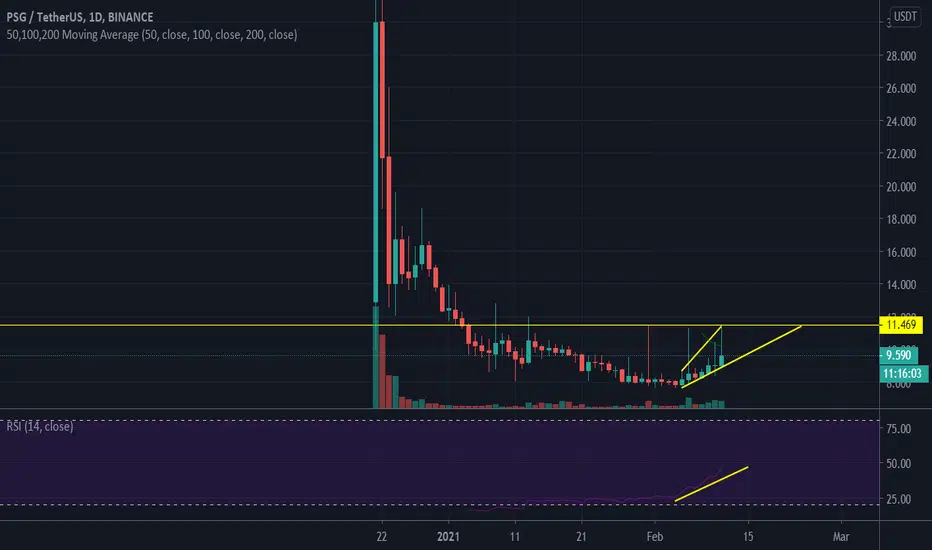
$PSGUSTD #BTCHuge opportunity on #PSG. Rounding bottom with #bullish momentum. Will see $30 again!
Nice rounding bottom forming a cup. Currently in an ascending channel waiting for a breakout
#PSGUSDT #PSGBTC #Blockchain #USDT #BTC #Fantoken
$FLYY Golden Cross Alert Golden Cross Alert
Volume will move in and price will go parabolic
#CSE #TSX #roundingbottom #goldencross #stocktowatch #stocksignal
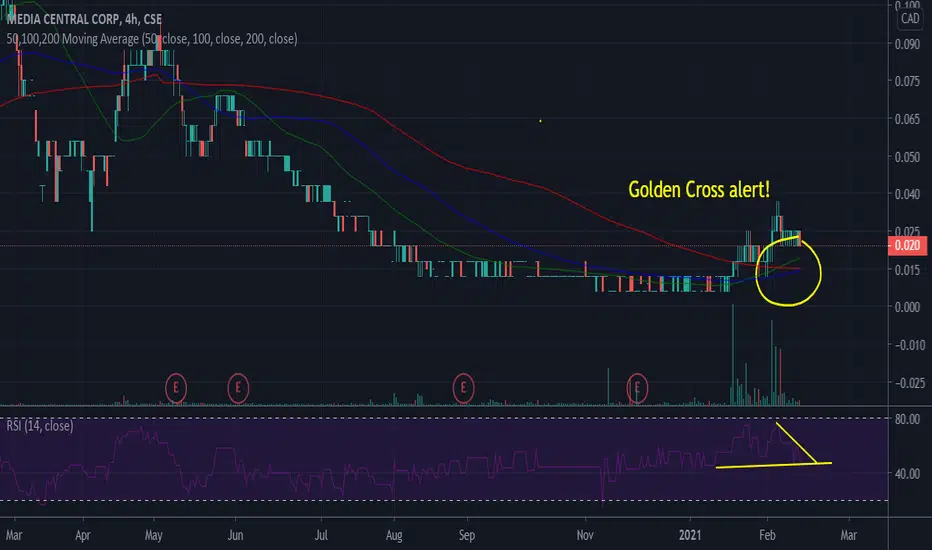
$FLYY Rounding bottomJust look at that volume the past few days.....Going to break out. Patience!
#cse #volume #roundingbottom #uptrending

Ada rounding up!Ada seems to want to form a pattern that also appears in other Altcoins.
Waiting for the confirmation of the take-off line may be the best strategy to enter the possible rush.
For now you can also settle for the pattern I have drawn or try your luck with some more risk.
In any case, the choice how taking action with your money is up to you... because my opinion can never be an invite to invest or risk your capital but only what i think.
The best of luck!


ISGEC - Weekly chart - Rounding BottomThis analysis is done purely on basis of price action and chart patterns.
The analysis is done on weekly TF hence it can take couple of days to couple of weeks to reach the target.
Logic, SL and Target is shown in image itself.
Also important levels are marked in the chart and one can see how price has respected those levels.
To understand how rounding bottom gives huge moves on breakout on all timeframes, check the analysis of HDFCAMC (15 minTF), DHANUKA (Weekly).
Also, check the chart of PAGE INDUSTRIES (Monthly) for more understanding.
Rounding Bottom in PAGE INDUSTRIES
This analysis is for study purpose. ISGEC is a Heavy Engineering Company having two segments i.e. manufacturing of machinery & EPC.
Traders must do their own study before entering into any trade. Traders should trade with their own risk capacity and money management.
Feel Free to comment for any query or suggestion regarding this stock or Price Action Analysis/Chart Study


Multiple patterns on UPL chartsUPL price has given a breakout of symmetrical triangle pattern on friday. Also at strong S&R level now and forming a rounding bottom pattern as well. Closing above this resistance can go higher, next resistance can be the initial target. Price levels mentioned in charts..
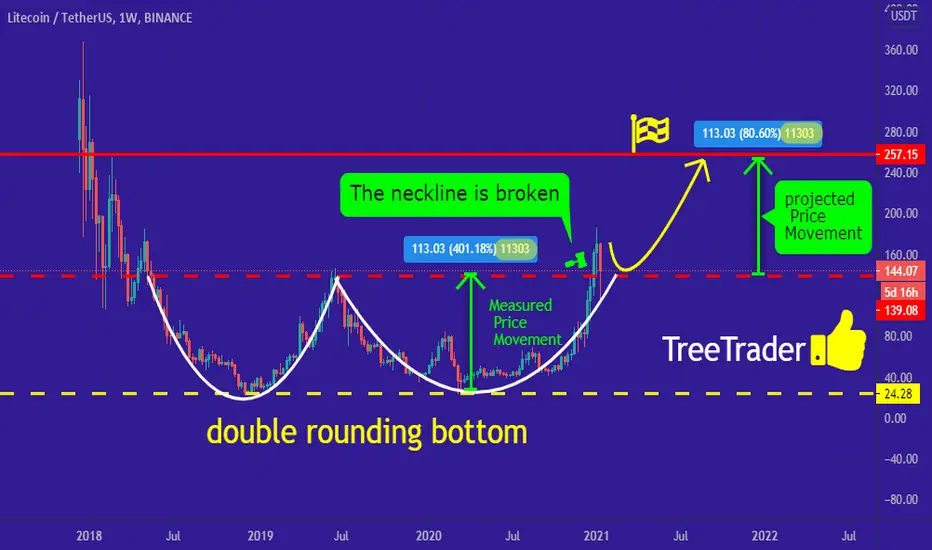
we shall see a pump in LTC/USDTHi every one
LTC/USDT
chart is speaking it self!!
the LTC/USDT has formed a double rounding bottom in weekly time frame which means that we should see a good amount of increase in the the price!
and also the neckline is broken so this means that this signal is much stronger!
Traders, if you liked this idea or have your opinion on it, write in the comments, We will be glad.
Things can change...
The markets are always changing and even with all these signals, the market changes tend to be strong and fast
Thank you for seeing idea .
Have a nice day and Good luck.
BRITANNIA - Falling Wedge + Rounding Bottom -Short Term/IntradayThis analysis is purely based on price action and Chart Patterns.
The analysis is on 30min TF hence target can be achieved in intraday trade or in couple of days.
Trade logic with SL and Target is explained in image itself.
One can Zoom out or scroll the chart to see how price reacted the levels previously.
Don't chase the price.
Always plan your trade & trade your plan
Keep trailing SL accordingly once entered into the trade.
This analysis is purely for education purpose. Kindly do your own study before entering into any trade .
Feel Free to comment for any suggestion or query regarding price action analysis.
To check how stocks move after forming rounding bottom, check the images linked below
PAGE INDUSTRIES (Monthly)
CERA SANITARYWARE (Monthly)
Also you can check the ideas linked below for more understanding.
