Deep Dive Into Relative Strength Index (RSI)The Relative Strength Index (RSI) is a momentum oscillator developed by J. Welles Wilder Jr. that measures the speed and magnitude of price changes.
Introduction
In the world of trading, timing is everything — and few indicators have stood the test of time like the Relative Strength Index (RSI). Introduced by J. Welles Wilder in 1978, the RSI is a momentum oscillator that helps traders evaluate the strength and speed of price movements. Whether you're trading stocks, forex, or crypto, understanding how RSI is calculated and how to interpret its signals can give you a critical edge.
In this article, we’ll break down exactly how the RSI works, explore its formula, and dive into practical ways you can incorporate it into your trading strategies. From spotting potential reversals to identifying overbought and oversold conditions, the RSI remains a cornerstone of technical analysis — but only if you know how to use it properly.
Let’s explore the mechanics and the mindset behind this powerful indicator.
What Is RSI and How Is It Calculated?
The Relative Strength Index (RSI) is a momentum oscillator that measures the speed and change of price movements over a defined period. It outputs a value between 0 and 100, which helps traders determine whether an asset is overbought or oversold.
The default RSI setting uses a 14-period lookback window and is calculated with the following steps:
🔷Calculate the average gain and loss over the last 14 periods:
Average Gain = Sum of all gains over the past 14 periods / 14
Average Loss = Sum of all losses over the past 14 periods / 14
🔷Compute the Relative Strength (RS):
RS = Average Gain / Average Loss
🔷Apply the RSI formula:
RSI=100−(100/(1+RS))
The result is a single number between 0 and 100 that indicates the asset's momentum.
How to Use RSI in Trading Strategies
⚡️Overbought and Oversold Conditions Strategy
RSI > 70 typically signals that an asset may be overbought and due for a pullback.
RSI < 30 suggests the asset might be oversold, potentially primed for a bounce.
However, these levels aren’t absolute sell or buy signals. In strong trends, RSI can stay overbought or oversold for extended periods.
📈Long Trading Strategy Example:
1. Identify the major trend, to find the long trades it shall be uptrend. On the screen below you can see 1D time frame for BITMART:BTCUSDT.P .
2. Move to lower time frame (in our case 4h) and find the moment when RSI falls below 30. This is our oversold condition and we are going to look for long trade.
3. Find the local support zone and open long trade.
4. Take profit when price reaches resistance level next to the previous swing high
5. Don’t forget to put initial stop loss when enter position. The best stop loss which will give you 3:1 risk to reward ratio.
📉Short Trading Strategy Example
1. Identify the major trend, to find the short trades it shall be downtrend. On the screen below you can see 1D time frame for BITMART:ETHUSDT.P .
2. Move to lower time frame (in our case 4h) and find the moment when RSI grows above 70. This is our overbought condition and we are going to look for short trade.
3. Find the local resistance zone and open short trade.
4. Take profit when price reaches support level next to the previous swing low
5. Don’t forget to put initial stop loss when enter position. The best stop loss which will give you 3:1 risk to reward ratio.
⚡️RSI Breakout Strategy
RSI is breaking through 60 indicating bullish momentum shift if the long-term trend is bullish can be the potential long signal
RSI is breaking down 40 indicating bearish momentum shift if the long-term trend is bearish can be the potential short signal
This strategy works great only on the trending market, don’t use it on the range bounded market to avoid whiplashes.
📈Long trading strategy example:
1. Make sure that long-term trend is bullish. Use 200 period EMA as its approximation. If price remains above it we can look for potential long trade setup.
2. If RSI crossed above the level 60 open long trade.
3. Put the initial stop-loss under the signal candle’s low.
4. Take profit when price reached 3:1 risk-to-reward ratio.
📉Short trading strategy example
1. Make sure that long-term trend is bearish. Use 200 period EMA as it’s approximation. If price remains below it we can look for potential short trade setup.
2. If RSI crossed below the level 40 open short trade.
3. Put the initial stop-loss above the signal candle’s high.
4. Take profit when price reached 3:1 risk-to-reward ratio. In our case we received very fast and profitable trade
⚡️RSI Divergence Strategy
RSI can be used also as a trend reversal indicator if we are looking for divergences. This is very reliable sign of current trend weakness and great opportunity open trade against the trend. Usually it’s not recommended, but in case if divergence can be applicable.
Bullish divergence is the situation when price created the lower low, while RSI made the lower low. Usually, it indicates that current downtrend is weakening and we can look for long trades
Bearish divergence is the situation when price created the higher high, while RSI made the lower high. Usually, it indicates that current uptrend is weakening and we can look for short trades
😎Important hint: it’s rarely covered in textbooks about technical analysis, but in our opinion it’s better to used divergences when RSI was able to cross level 50 between two lows/highs.
📈Long trading strategy example
1. Find at the chart situation, when the price made the lower low
2. At the same time RSI shall set the higher low
3. RSI shall break level 50 between these lows indicating shift to the bullish momentum
4. If price failed to set the clean breakdown open long trade on the candle which set the lower low. Put stop loss under it’s low
5. Take profit at 3:1 RR. When you master this concept, you will be able to have much more RR trades, even 10:1. This is possible because when trend finish you have the highest potential upside
📉Short trading strategy example
1. Find at the chart situation, when the price made the higher high
2. At the same time RSI shall set the lower high
3. RSI shall break level 50 between these highs indicating shift to the bearish momentum
4. If price failed to set the clean breakout open short trade on the candle which set the higher high. Put stop loss above it’s high
5. Take profit at 3:1 RR. When you master this concept, you will be able to have much more RR trades, even 10:1. This is possible because when trend finish you have the highest potential upside
Conclusion
The Relative Strength Index (RSI) remains one of the most powerful and flexible tools in a trader’s technical arsenal — but its real value lies in how you use it.
We’ve explored three key RSI strategies:
✅ Overbought/Oversold setups offer simple entry signals in ranging markets, where price tends to revert to the mean.
✅ Breakout strategies unlock RSI’s momentum-tracking potential, helping you ride strong directional moves with confidence.
✅ Divergence detection reveals hidden shifts in market sentiment, giving you an early warning of possible reversals or trend continuations.
Each approach has its strengths — and its risks — but together, they offer a complete framework for using RSI across different market conditions
🔑 Key Takeaways:
RSI is not just a “buy low, sell high” tool — it’s a multi-dimensional indicator that adapts to trends, momentum, and market structure.
The best RSI signals come from confluence: combining RSI with price action, support/resistance, volume, or trend filters like moving averages.
Patience and discipline are essential — RSI signals are only effective when paired with proper risk management and confirmation.
By mastering RSI beyond the basics, you'll be better equipped to make timely, confident, and informed trading decisions — whether you're entering a pullback, chasing a breakout, or spotting the early signs of reversal.
Rsi_divergence
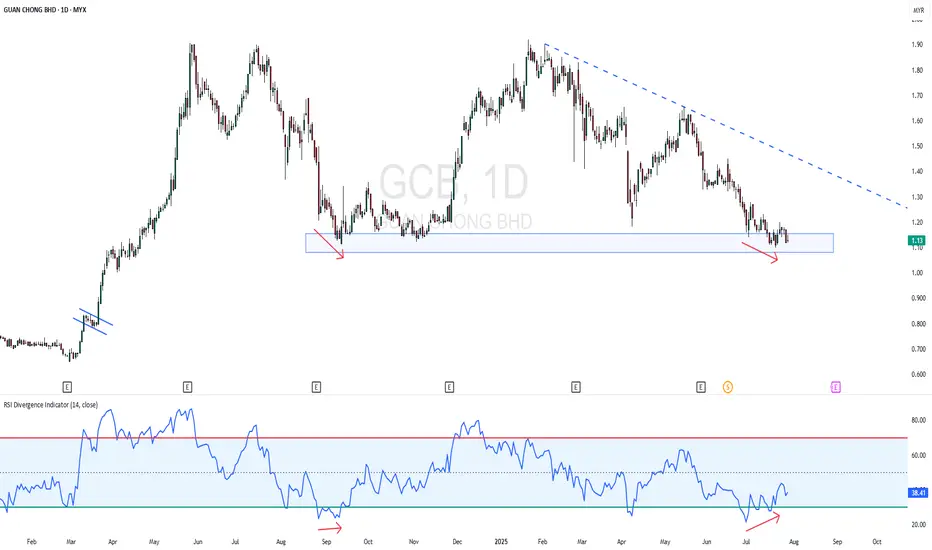
GCB - Near 52 Week LowGCB - CURRENT PRICE : RM1.13
GCB is in a downtrend as the highs and lows both getting low. The stock is near 52 Week Low. However, the stock may rebound higher for short term as there is a bullish divergence in RSI. Price is making lower low while RSI making higher low. Rising in RSI reading indicating there is slightly bullish momentum picking up. Aggressive trader may anticipate for buying with tight stop loss level.
ENTRY PRICE : RM1.13
TARGET : RM1.20 (+6.30%)
SUPPORT : RM1.10 (-2.65)
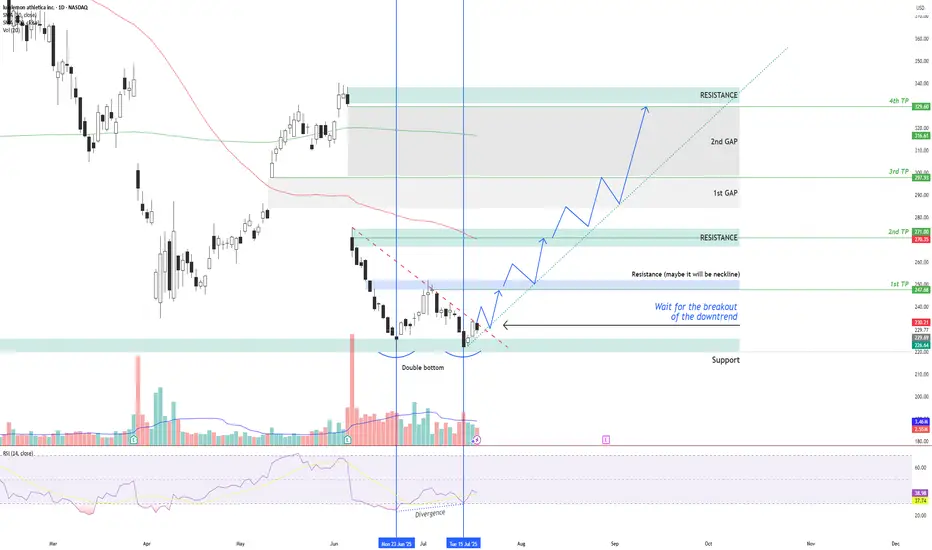
LULU – Double Bottom + RSI Divergence: Multi-Target Setup After LULU NASDAQ:LULU is showing signs of a potential bullish reversal after forming a double bottom structure around the $220 support zone , along with a bullish divergence on the RSI indicator.
Two vertical lines highlight the divergence: while price made a lower low, RSI formed a higher low – indicating a possible momentum shift in favor of buyers.
Currently, price is moving just below a descending trendline, which has been acting as dynamic resistance. The first condition for a long setup is a confirmed breakout above this trendline followed by a successful retest. If that happens, an entry can be considered .
📌 Entry Plan:
Entry: After a breakout and retest of the descending trendline.
1st TP: ~$247 — This level coincides with a local resistance zone, which may act as a neckline of the double bottom.
If price breaks above $247 and retests, it confirms bullish continuation.
📈 Target Structure:
2nd TP: ~$271 — next major resistance zone.
3rd TP: ~$297 — aligns with the first major gap zone.
4th TP: ~$329 — final gap resistance from previous sell-off levels.
This structure allows for scaling into the trade in stages — each breakout and retest offers a new confirmation and extension to the next target zone.
Volume analysis, price action, and RSI momentum all support the probability of a trend reversal — but confirmation is key.
Not financial advice. Always conduct your own research and risk management.
Currently in a Consolidation Zone.ANL Closed at 8.06 (24-06-2025)
Currently in a Consolidation Zone.
6.90 - 7.0 seems to be an Important Support
Level.
Bullish Divergence on Bigger tf.
Immediate Resistance is around 10.50 & then
around 13 - 13.50

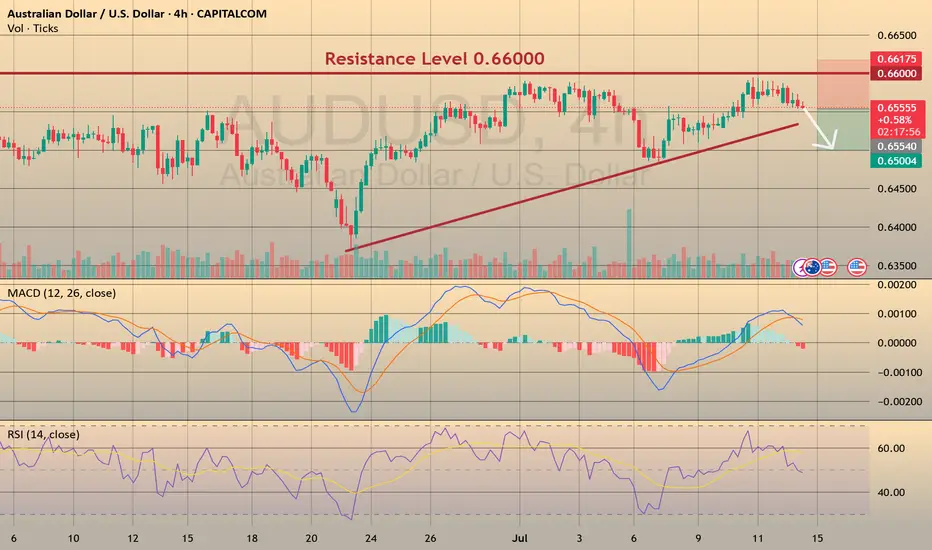
AUDUSD: Short Setup Ahead of Key Data OANDA:AUDUSD
AUDUSD is hovering near a rising trendline, with price action compressing and signaling a potential downside break in the coming sessions.
Just above, the 0.65900 resistance zone has capped recent rallies, and the pair’s failure to clear this level strengthens the case for a reversal.
Later today, we will see Westpac Consumer Confidence data for Australia, which could act as a catalyst for a sharp move. A weaker-than-expected print would likely pressure the Aussie further.
📋 Entry Checklist:
✅ Testing rising trendline, signaling potential breakdown
✅ Strong resistance at 0.65900 holding rallies
✅ Key consumer sentiment data could trigger volatility
📈 Trade Plan:
🔻 Sell Entry: 0.65600
❌ Stop Loss: 0.66200
✅ Take Profit: 0.65000
(Tap 👉 Trade Now 👈 on mobile to copy SL & TP easily)
📰 Fundamental Snapshot:
The Reserve Bank of Australia (RBA) surprised markets by holding rates steady at 3.85%, diverging from expectations of a potential cut. The RBA remains cautious amid persistent inflation risks driven by high labor costs and weak productivity, suggesting rates may stay restrictive longer.
Governor Michele Bullock highlighted that inflation could remain above forecasts, while Deputy Governor Andrew Hauser emphasized monitoring global uncertainties, including U.S. tariff developments, reflecting the RBA’s sensitivity to external headwinds impacting growth and trade.
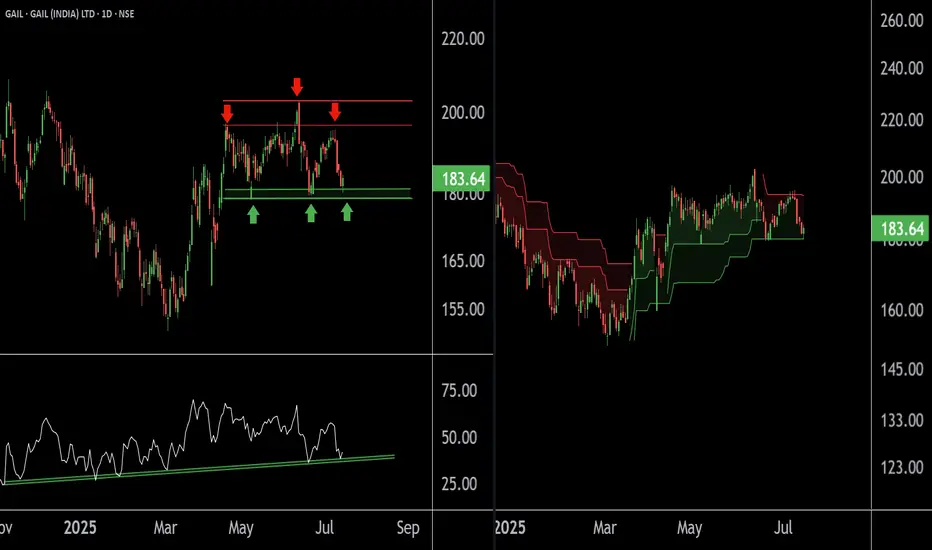
GAIL at Best Support zone !! There are two chart of Gail on Daily timeframe.
On the first chart Gail is moving in well defined parallel channel with support near at 178-180 zone.
Daily RSI is also taking support and bouncing back, indicating a revival in short-term momentum and strengthening the overall bullish setup.
On the second chart , the stock is bouncing from the supertrend support around ₹180, reinforcing bullish sentiment. However, on the shorter timeframe, the supertrend indicator is acting as resistance near ₹192, which needs to be breached for further upside continuation.
Thank You !!
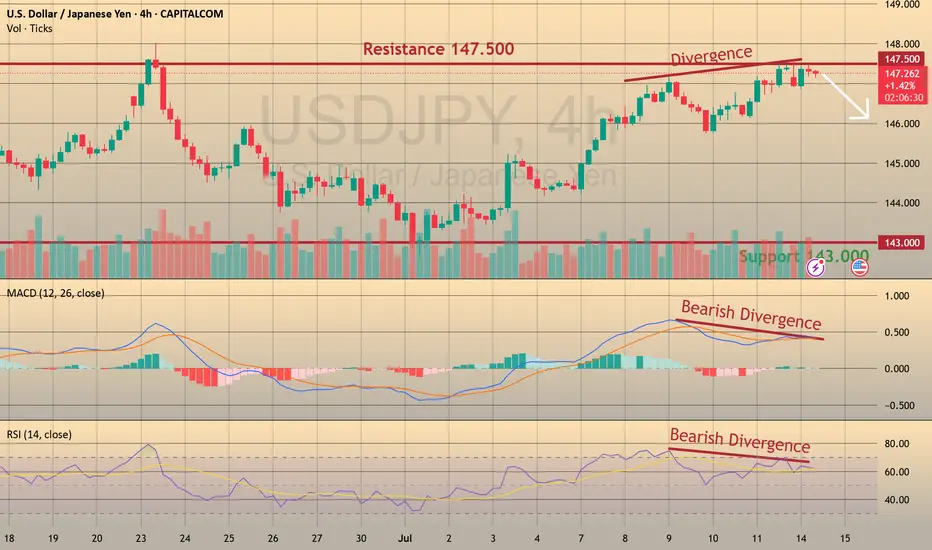
USDJPY: Bearish Divergence – Eyeing Shorts to 143 CAPITALCOM:USDJPY
We’re seeing strong bearish divergence in USDJPY near the 148 resistance zone, shifting our focus to short opportunities with a medium-term target at 142.
📈 Trading Plan:
🔻 SELL Stop: 147.040
❌ Stop Loss: 149.220
✅ Take Profit: 143.000
(Click 👉 Trade Now 👈 on your mobile to copy SL & TP easily)
🔍 Why am I short here?
✅ Technical: Clear bearish divergence on the H4 (RSI & MACD), indicating potential reversal signals.
✅ Resistance Zone: Price is testing the key 148 resistance, providing an ideal risk-reward location for shorts.
✅ Macro Event: Ahead of tomorrow’s US CPI release, a conservative trade structure is maintained to manage volatility risks.
📰 Fundamental Snapshot:
Japan’s economy shows signs of stabilization:
Core machinery orders fell only 0.6% MoM in May to ¥913.5B, much better than April’s -9.1% and forecasts of -1.5%.
Despite the headline decline, it indicates resilience in Japan’s capital spending, supporting the JPY’s medium-term outlook amid global trade and growth risks.
Trade cautiously!
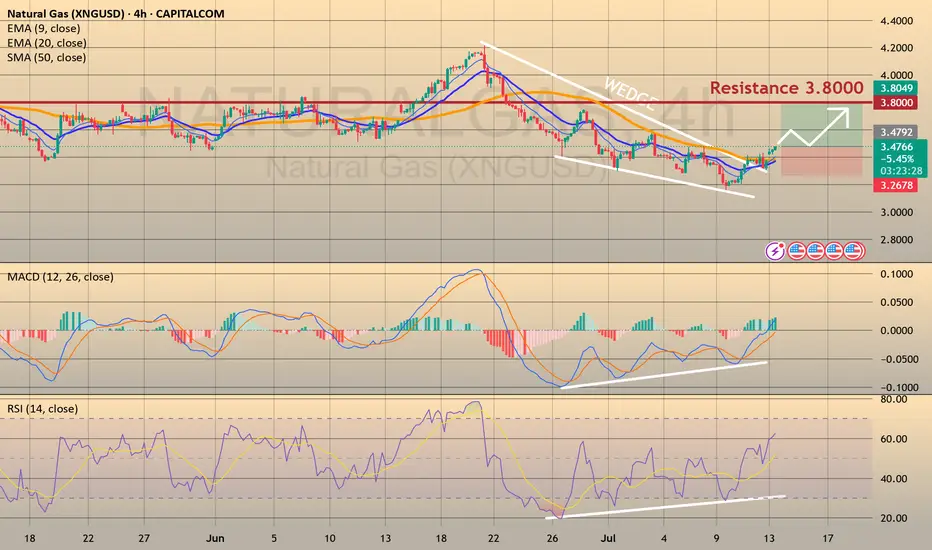
NATURAL GAS - REBOUND FROM THE MAJOR TRENDLINE AND ANOTHER LONG CAPITALCOM:NATURALGAS
Last week on Wednesday and Thursday we observed the false breakout of the major trendline. Eventually, Thursday ended up bullish, gaining 4.8% day-to-day. On Friday the asset has been trading majorly sideways, retesting the major trendline (pic 1). Technically, looks like the divergence on RSI, MACD and Momentum works out as well as the bullish wedge (pic 2). Fundamentally, we still have warm temperature weather forecasts in the U.S. and bullish Thursday's EIA report. Additionally, today the market opened with a bullish gap and continues to grow, which is a good signal for the buyers.
Considering major levels here, I decided to open long positions:
🔼 a market buy order at 3.4556 with
❌a stop loss at 3.2995 and
🤑a take profit at 3.7927
At 3.6000 would be reasonable to reduce long position on a half. Thank you for the attention!
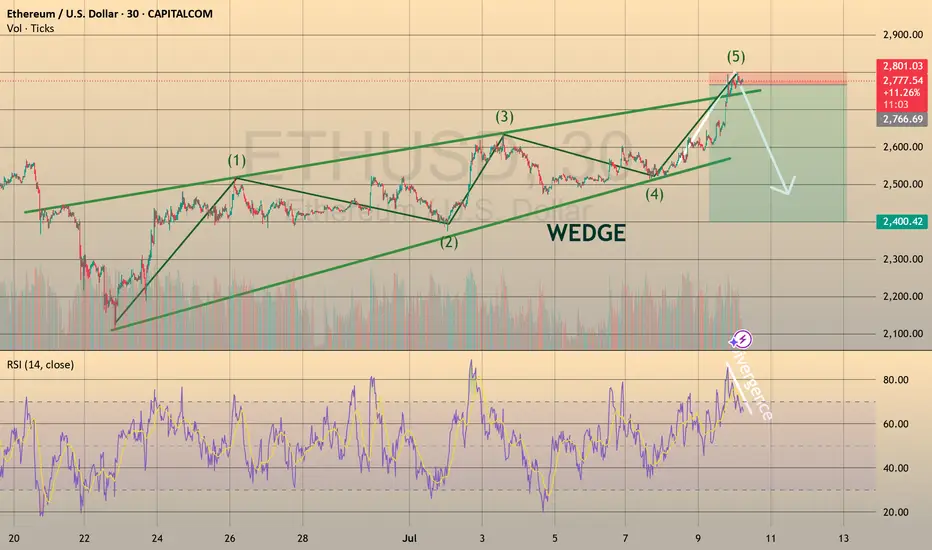
TRADING IDEA - ETHUSD SHORT
ETHUSD rose towards 2,700.00 level and reached the take profit. And even went further towards 2,800.00 resistance level despite my 2,700.00 retest predict! (pic 1)
So, congrats to everyone, who stayed long here, we took the cash!💵
I am preparing for the next trade. Here is the plan: if the price rises once again towards 2,800.0 resistance level and retests it, I will open the short position with
🔽 a pending sell stop order at 2796.84 with
❌a stop loss at 2818.86 and
🤑a take profit at 2740.05
Additionally, the RSI shows divergence on 30-m timeframe.
I suppose this to be quick trade. Will see how it will work out.
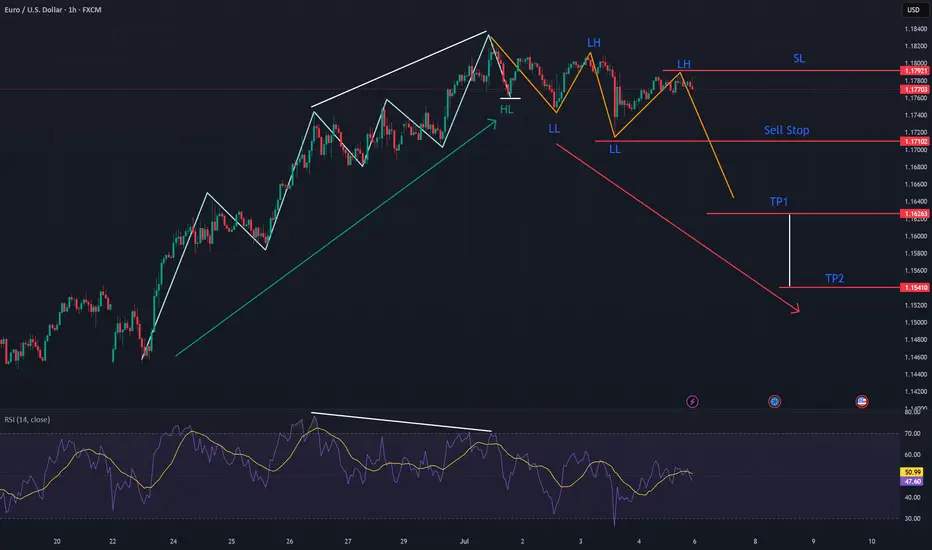
EURUSD: Potential Trend Reversal BrewingEURUSD is exhibiting clear signs of a potential trend reversal, having recently broken its previous Higher Low and subsequently establishing a sequence of Lower Highs and Lower Lows. This shift in market structure from bullish to bearish is a strong indicator of weakening upside momentum. Further confirming this outlook, the RSI is displaying a notable bearish divergence, where price registers higher highs while the RSI prints lower highs, signaling diminishing bullish strength at these elevated price levels. Considering this confluence of technical factors, a potential short setup is present.
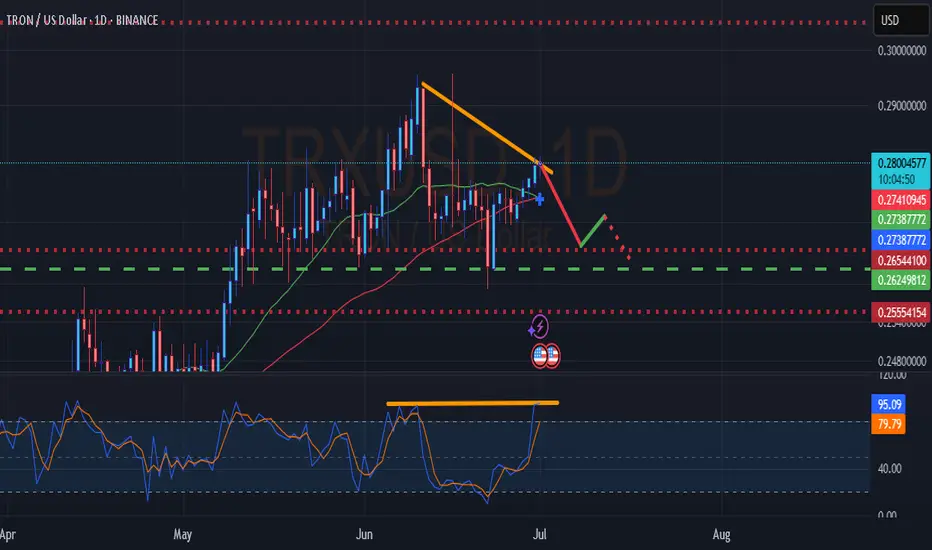
TRX USD Hidden Bearish DivergenceGood day all. TRX puts in hidden bearish divergence. Time to be cautious. Not financial advice. Good luck with your trade.
Strong Bullish Divergence. Closed at 8.17 (03-06-2025)
Strong Bullish Divergence.
But 8.45 is an Important Resistance
that needs to sustain on Weekly basis
at least.
Crossing & sustaining 10 would lead it
towards 14 - 15.
On the flip side, 6.50 - 7.0 may act
as a Strong Support level.

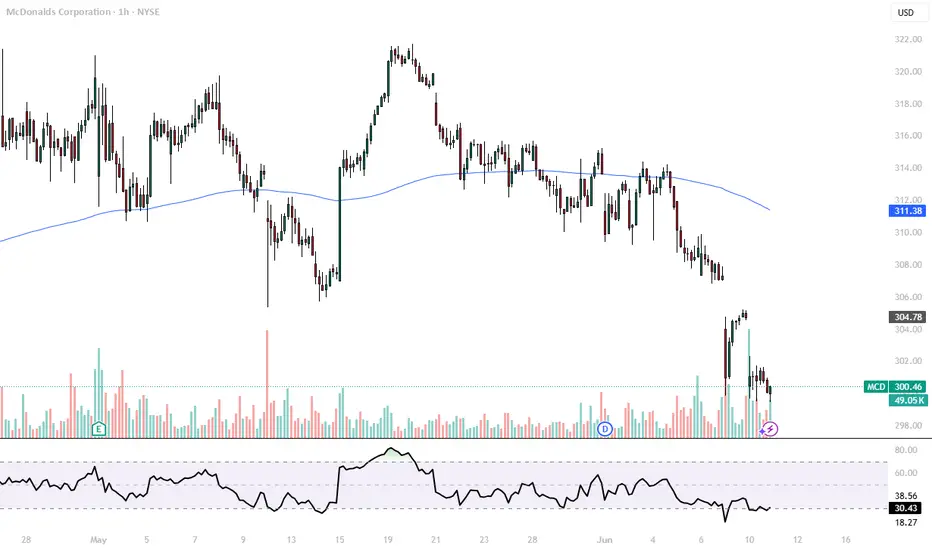
McDonald 1H Long PositionMy self-built strategy has sent me a signal for a long position. I bought a tranche of NYSE:MCD long and will be targeting the upper gaps as my profit targets. The first station will be around $306, and the second target lies between $318 and $319. Currently, the 1H chart is forming a nice divergence and had a huge volume spike, and my strategy indicates a high probability setup for this chart.
Given the current market volatility, I’ll be keeping a close eye on my open position to be able to react quickly if needed.
Trent Ltd: Breakout or Fakeout?Trent Ltd: Breakout or Fakeout? Someone’s positioning — the question is which side.
Trent Ltd remains one of the more resilient players in India’s retail landscape. While broader consumer sentiment remains mixed, the company continues expanding its footprint, especially through its Westside stores and fashion vertical. Recent earnings have been stable, and institutional interest appears to be creeping back in — confirmed by a steady rise in volume.
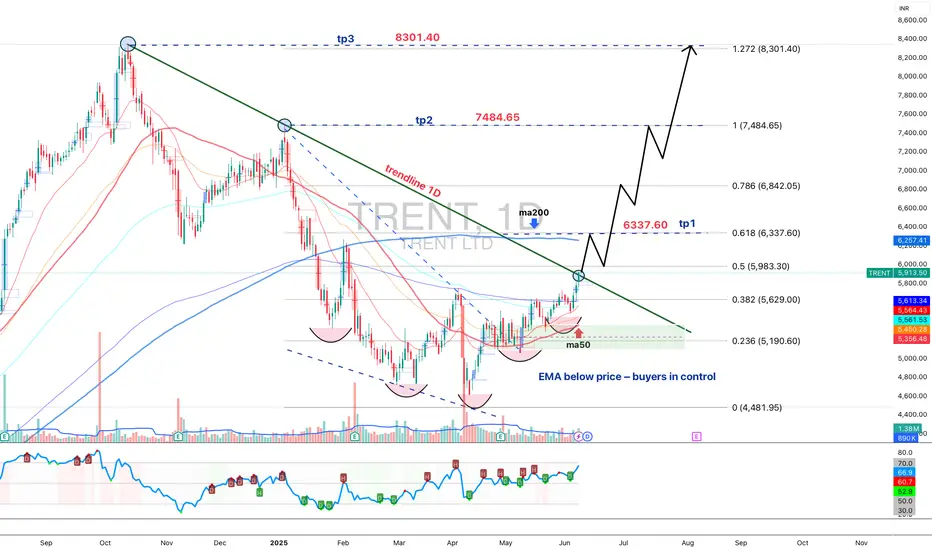
Technically, we’re at a decision point. Price is testing a major descending trendline drawn from the all-time highs. So far, no breakout — but signs of accumulation are building. All major EMAs (50/100/200) are below the price, putting buyers firmly in control. Volume is rising on bullish candles, with no signs of distribution. RSI is holding above 50, climbing steadily, and showing a healthy impulse without overheating — plenty of room left for upside.
The key setup: wait for a confirmed breakout above the trendline, then a retest, and only after that consider entering. Targets, based on Fibonacci levels, line up cleanly:
tp1: 6337.60 (0.618)
tp2: 7484.65 (1.0)
tp3: 8301.40 (1.272)
Until then — this is a watching game, not a trading one. Momentum is building, the structure is clean — but confirmation is king.
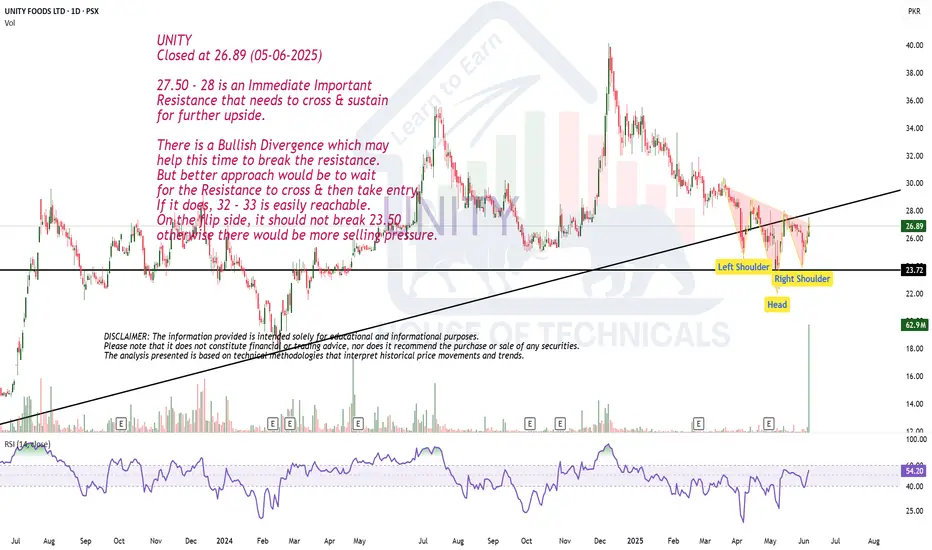
Bullish Divergence
Closed at 26.89 (05-06-2025)
27.50 - 28 is an Immediate Important
Resistance that needs to cross & sustain
for further upside.
There is a Bullish Divergence which may
help this time to break the resistance.
But better approach would be to wait
for the Resistance to cross & then take entry.
If it does, 32 - 33 is easily reachable.
On the flip side, it should not break 23.50
otherwise there would be more selling pressure.
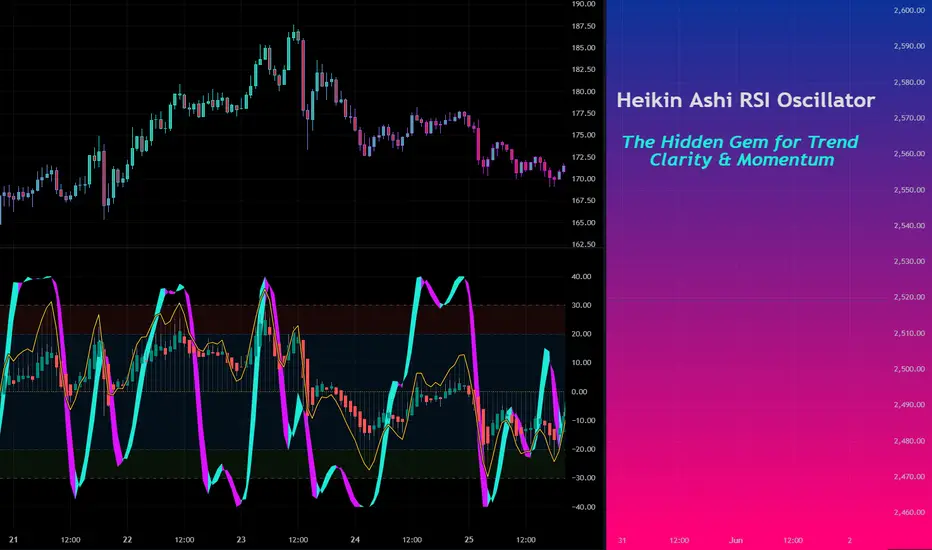
HA-RSI + Stochastic Ribbon: The Hidden Gem for Trend & MomentumNavigating volatile markets requires more than just raw price action. The Heikin Ashi RSI Oscillator blends the power of smoothed candlesticks with momentum insights to give traders a clearer picture of trend strength and reversals.
At Xuantify , we use the Heikin Ashi RSI Oscillator as a hybrid momentum and trend tool. While the indicator calculations are based on Heikin Ashi values to smooth out noise and better capture trend dynamics, the chart itself displays standard candlesticks (real price data) . This ensures that all signals are aligned with actual market structure, making it easier to execute trades with confidence and clarity.
This dual-layer approach gives us the best of both worlds: clarity from smoothing and precision from real price action. MEXC:SOLUSDT.P
🧠 How We Use It at Xuantify
At Xuantify , we integrate the Heikin Ashi RSI Oscillator into our multi-layered strategy framework. It acts as a trend confirmation filter and a momentum divergence detector , helping us avoid false breakouts and time entries with greater precision. We pair it with volume and volatility metrics to validate signals and reduce noise. Note the Stochastic Ribbon Overlay as shown in the chart, very accurate for momentum.
⭐ Key Features
Heikin Ashi Smoothing : Filters out market noise for clearer trend visualization.
RSI-Based Oscillation : Measures momentum shifts with precision.
Color-Coded Bars : Instantly identify bullish/bearish momentum.
Dynamic Signal Zones : Customizable overbought/oversold thresholds.
Stochastic Ribbon Overlay : A powerful multi-line stochastic system that enhances momentum analysis and trend continuation signals.
💡 Benefits Compared to Other Indicators
Less Whipsaw : Heikin Ashi smoothing reduces false signals common in traditional RSI.
Dual Insight : Combines trend and momentum in one visual.
Better Divergence Detection : Easier to spot hidden and regular divergences.
Visual Simplicity : Clean, intuitive design for faster decision-making.
⚙️ Settings That Matter
RSI Length : Default is 14, but we often test 10 or 21 for different timeframes.
Smoothing Type : EMA vs. SMA – EMA reacts faster, SMA is smoother.
Overbought/Oversold Levels : 70/30 is standard, but 80/20 can reduce noise in trending markets.
📊 Enhancing Signal Accuracy
Combine with Volume Oscillators to confirm momentum strength.
Use Price Action Zones to validate oscillator signals.
Look for Divergences between price and oscillator for early reversal clues.
🧩 Best Combinations with This Indicator
MACD : For cross-confirmation of momentum shifts.
Bollinger Bands : To identify volatility squeezes and breakouts.
Support/Resistance Levels : For contextual trade entries and exits.
⚠️ What to Watch Out For
Lag in Strong Trends : Like all smoothed indicators, it may react slightly late.
Over-Optimization : Avoid curve-fitting settings to past data.
Standalone Use : Best used in conjunction with other tools, not in isolation.
🚀 Final Thoughts
The Heikin Ashi RSI Oscillator is a powerful hybrid tool that simplifies complex market behavior into actionable insights. At Xuantify, it’s a core part of our strategy toolkit, helping us stay ahead of the curve with clarity and confidence.
🔔 Follow us for more educational insights and strategy breakdowns!
We regularly share deep dives into indicators, trading psychology, and backtested strategies. Stay tuned and level up your trading game with us!
Bearish Divergence has started appearing on Monthly tf.SAZEW
Closed at 1203.28 (27-05-2025)
Bearish Divergence has started appearing
on Monthly tf. (Stay Cautious). It may
drag the price further down.
Support Zone seems to be around 1142 - 1190
& then around 1050 - 1060

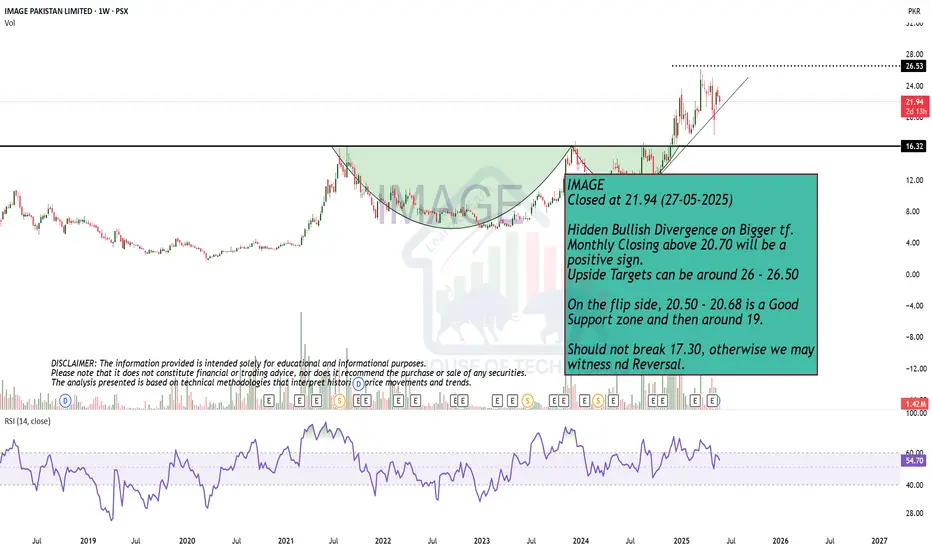
Hidden Bullish Divergence on Bigger tf.IMAGE
Closed at 21.94 (27-05-2025)
Hidden Bullish Divergence on Bigger tf.
Monthly Closing above 20.70 will be a
positive sign.
Upside Targets can be around 26 - 26.50
On the flip side, 20.50 - 20.68 is a Good
Support zone and then around 19.
Should not break 17.30, otherwise we may
witness nd Reversal.
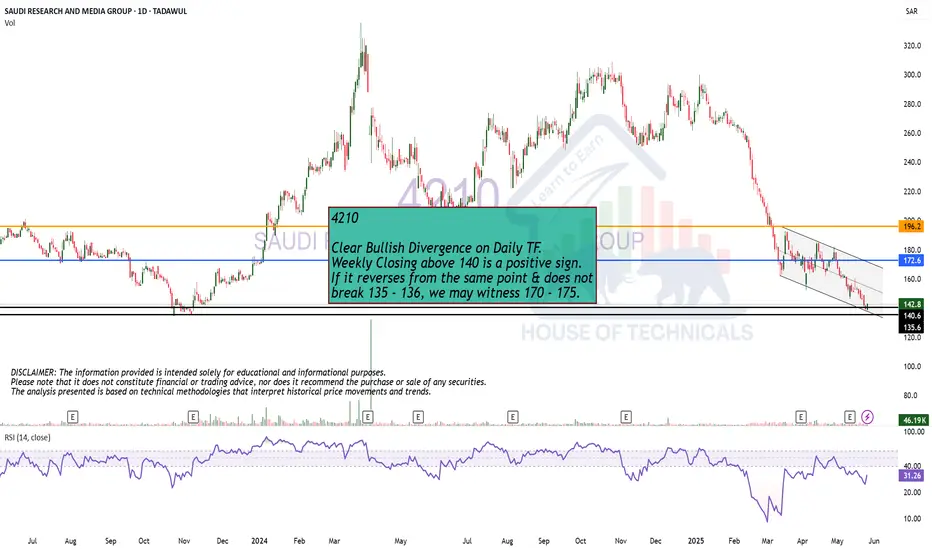
Clear Bullish Divergence on Daily TF.
Clear Bullish Divergence on Daily TF.
Weekly Closing above 140 is a positive sign.
If it reverses from the same point & does not
break 135 - 136, we may witness 170 - 175.
Equity Research Flash – BEML Ltd.CMP: ₹3,242.10 | Breakout From Falling Trendline
BEML has decisively broken out of a falling trendline and is now sustaining above a key consolidation zone. With strong bullish candles, a rising RSI, and healthy volume spike, the stock signals bullish momentum. Immediate resistance lies at ₹3,420–₹3,480. Sustained move above could target ₹3,750+. 20/50 EMA crossover supports the upward trend. Traders may consider entries on dips with SL near ₹3,080.
For educational purposes only

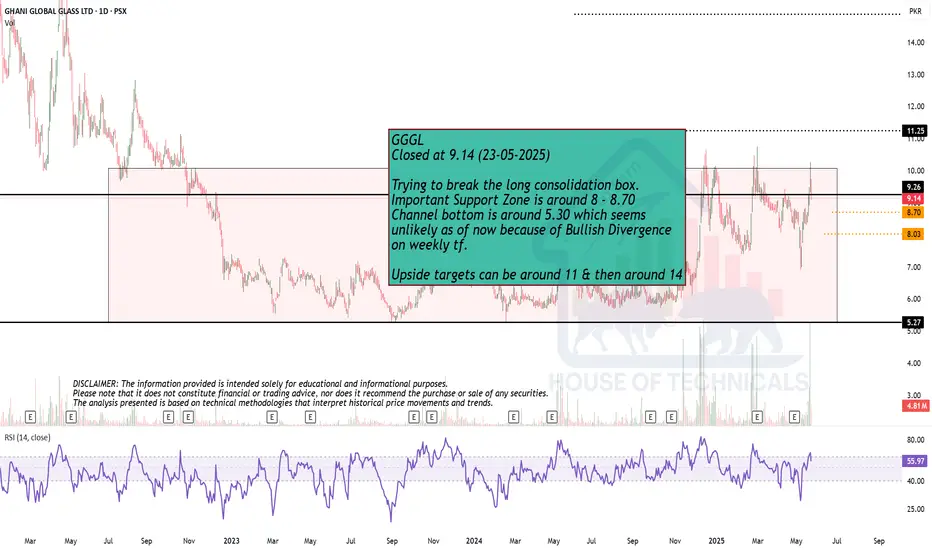
Conslidation Box
Closed at 9.14 (23-05-2025)
Trying to break the long consolidation box.
Important Support Zone is around 8 - 8.70
Channel bottom is around 5.30 which seems
unlikely as of now because of Bullish Divergence
on weekly tf.
Upside targets can be around 11 & then around 14
AUDCHF- BUYCALL - RSI divergence and Double Bottommarket has formed Bullish divergence on Bearish trend followed by Double Bottom formation. This indicates that market will now reverse the trend and we can expect bullish trend.
Entry will be taken after breakout of resistance level which is also a LH and TPs will be 1:1 and 1:2 accordingly. SL is placed slightly below the Double Bottom.

USDCHF - BUY CALL - Divergence + wedge pattern + Accumulation USDCHF - currently the pair is in consolidation phase, followed by RSI Bullish Divergence and A wedge pattern. These two formations followed by a Bearish trend gives us an indication that market will take a bull run after accumulating positions.
we plan our entry as follows.
Entry Point : After break of Resistance level (LH)
TP1 : with a risk to reward of 1:1
TP2 : 1:2 Risk to Reward
Stop LOSS : slightly below the LL of bearish trend.
