TURBO/USDT – Cup and Handle Formation (1D Chart)Overview:
TURBO/USDT is potentially forming a textbook Cup and Handle pattern on the 1-day chart. Price action suggests a rounded bottom (the “cup”) followed by a consolidation range (the “handle”), setting up for a possible breakout.
---
🔍 Pattern Structure:
- Cup Formation:
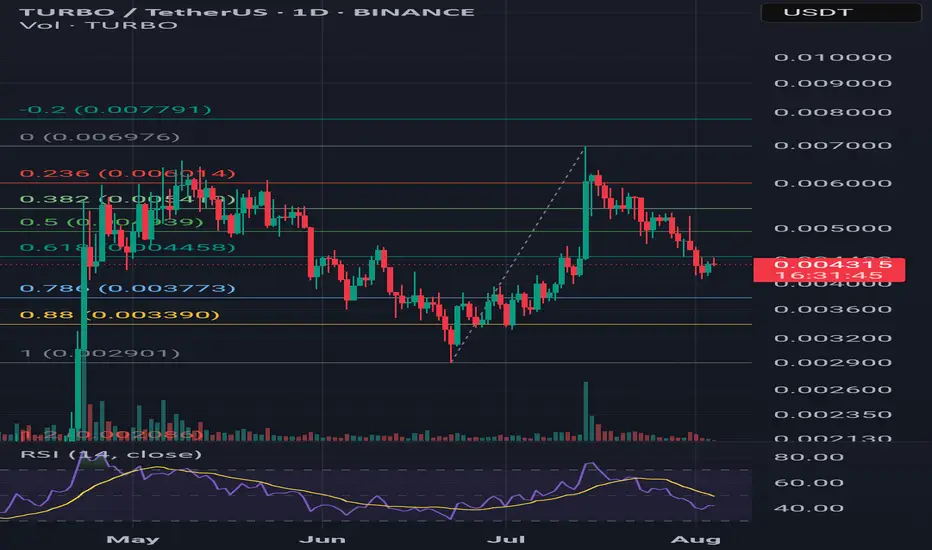
Price rallied from ~0.0029 to ~0.0060 USDT, retracing slightly from the top. This rounded rise resembles the classic cup shape.
- Handle Formation:
Recent price consolidation between 0.0042–0.0049 USDT hints at the formation of the handle. A breakout above resistance could validate the pattern.
---
📈 Key Technical Levels:
Entry Zone | 0.0047 – 0.0050 |
| Resistance (Breakout)| ~0.0060 |
| Target 1 | ~0.0064 |
| Target 2 | 0.0078 – 0.0084 |
| Stop Loss | Below 0.0042 |
🔄 Additional Indicators:
- Volume: Watch for increasing volume to confirm breakout momentum.
- RSI (14-day): Neutral zone with room for upward movement. Momentum is building.
- Fibonacci Levels: 0.618 retracement (~0.004458 USDT) has acted as a key support during handle formation.
---
💡 Idea: Monitor for a daily close above 0.0060 with volume confirmation. That could mark the beginning of a bullish continuation. Risk management is essential if price fails to hold above the handle support.
Rsianalysis
Potential Bullish Reversal for WFI (WIF/USDT)#WIF/USDT #Analysis
Description
---------------------------------------------------------------
+ The chart shows a descending channel pattern forming since the peak in early 2024. The price has respected the upper and lower bounds of this channel multiple times, indicating a strong bearish trend within this range.
+ The price is currently approaching a significant support zone around $1.80, which aligns with the lower boundary of the descending channel.
+ A breakout above the upper boundary of the channel around $2.30 could signal a potential trend reversal.
+ The EMA 100 (blue line) and EMA 55 (light blue line) are currently acting as dynamic resistance levels. A break above these moving averages would add to the bullish sentiment.
+ If the price holds above the $1.80 support level and breaks out of the descending channel, we can expect a potential move towards the $4.00 - $4.50 resistance zone. Further upside could see the price targeting the $6.50 - $7.00 levels, as indicated by the dotted arrow path.
+ The RSI is currently at 37.31, indicating that the asset is in the oversold region. A reversal in RSI towards the 50 mark would support a bullish momentum shift.
+ As long as the price remains above the $1.80 support level, there is a potential for a bullish reversal.
---------------------------------------------------------------
VectorAlgo Trade Details
------------------------------
Entry Price: $1.80 with confirmation of suppor
Stop Loss: $1.3
------------------------------
Target 1: 3.042
Target 2: 4.170
Target 3: 5.0
Target 4: 7.0
------------------------------
Timeframe:1D (Daily)
Capital Risk: 1-2% of trading amount
Leverage: 5-10x
---------------------------------------------------------------
Enhance, Trade, Grow
---------------------------------------------------------------
Feel free to share your thoughts and insights.
Don't forget to like and follow us for more trading ideas and discussions.
Best Regards,
VectorAlgo

ROKU- Bearish Divergence gives guidance LONGROKU sold off after okay not great earnings- obviously a large number of market participants
took their money off the table and moved it elsewhere. There was a typical or excessive price
run-up in the pre-earnings period. This chart set in a 15-minute time frame as well as 15
minute time frame on the RSI laid onto the main chart shows bullish divergence which
otherwise might be subtle. It is the key to the trade entry. It is saying get on the train before
it leaves the station. Chasing the train is a futile endeavor fraught with failure and
frustration. ( Yes, the hot tip is boldfaced for emphasis) Price is sideways at this time. The
relative volume indicator shows a huge 4X surge in volumes at the consolidated bottom verifying
it as such. This is Wychoff's theory in action for sure.
I am now part of that volume. I am an avid bottom buyer like many others. I take great
pains to analyse for the bottom, unlike some others who run on gut or sentiment.
I hope you find this analysis helpful. If you do, please give me a thumbs up. Once you have,
feel free to ask as to the specifics of my trading plan now implimented.
