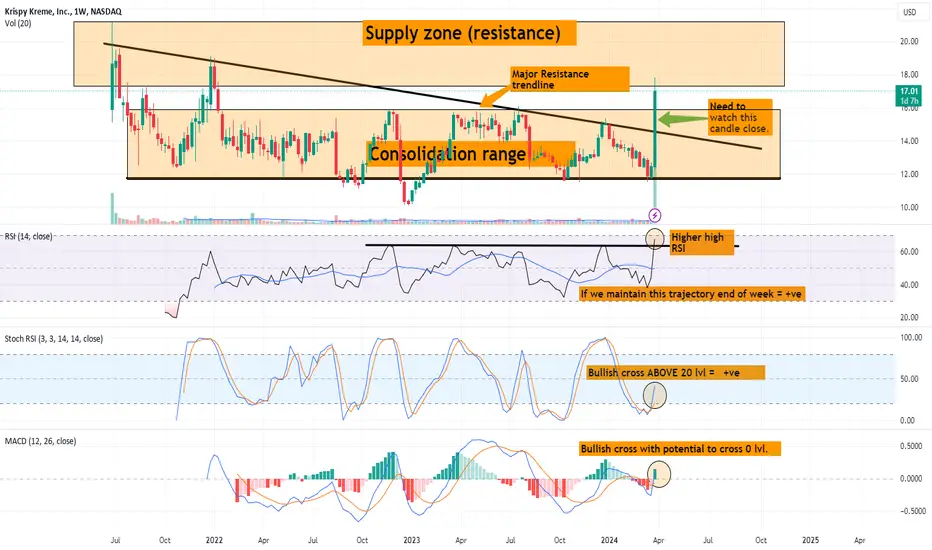
Krispy Cream Donut Weekly God Candle Has me lookingHi guys. Always on the lookout for major changes/shifts or Macro signals. Yesterdays 40% increase in Krispy Cream Donuts, has me taking a look into this one.
This analysis is on the 1 week. Note, the current candle is not yet confirmed. Weekly close is obviously on fridays.
I have highlighted 2 zones. COnsolidation range and a Supply zone. We do need to pay attention to these 2 ranges.
BEcause atleast from previous history the supply zone is a resistance zone and thus a sell area. We would need decisive candle closes ABOVE for multi weeks for me to gain confidence that it has flipped to Demand or Support.
Same goes for breaking out of the consolidation range. More info is needed such as confirmation.
But nevertheless, What had me looking DNUT's way, was candle moving past the major resistance trendline that has haunted us since the stock being traded publically.
I would like to note on the weekly timeframe, confirmations have not come in yet, and until proven otherwise it can be a fakeout and can always come back into the consolidation zone. AGAIN, End of week will give us better information.
But it does not take away the fact that DNUT is moving. And atleast for now, DEMAND exists.
VOLUME needs to follow with continued increase.
Things to note in our indicators:
RSI, breaking a major trend by signaling a higher high. But again end of week will clarify this. If it prints, i see it as a positive sign.
STOCH RSI - crossing bullish with is almost above 20 lvl. This indicates possibility of momentum coming in to support an uptrend.
MACD - Has Bullish cross, however we need to see whether or not we can get ABOVE 0 lvl. This would indicate a high probability for a sustainable uptrend.
Being that this weeks candle has not yet closed. It is absolutely important to continue to observe. But DNUT has made it to my watchlist for sure.
Is Krispy Cream Donuts, the Donut for me and you? Well time will tell. LOL.
__________________________________________________________________________________
Thank you for taking the time to read my analysis. Hope it helped keep you informed. Please do support my ideas by boosting, following me and commenting. Thanks again.
Stay tuned for more updates on MINAUSD in the near future.
If you have any questions, do reach out. Thank you again.
DISCLAIMER: This is not financial advice, i am not a financial advisor. The thoughts expressed in the posts are my opinion and for educational purposes. Do not use my ideas for the basis of your trading strategy, make sure to work out your own strategy and when trading always spend majority of your time on risk management strategy.
Rsistrategy
Price overextension: misconceptions and common mistakesPrice overextension remains a widely misunderstood concept in trading, causing both novice and seasoned traders to make errors in their decision-making. This misinterpretation often leads to placing trades in the wrong direction or, equally detrimental, overlooking profitable opportunities.
In essence, price overextension signifies that the market has undergone a rapid and excessive movement in one direction. Such movements are often perceived as unsustainable. Numerous indicators, such as Stochastic, RSI, Bollinger Bands and many other, attempt to identify such "abnormal" price movements so traders could capitalize on them. Despite variations in statistical methods and calculations, their common goal is to detect instances where price went or down too much and is likely to reverse.
In this discussion, I will use Relative-Strength-Index (RSI), a popular indicator, to convey my perspective on price overextension. While some traders argue for customization, the elusive question of "how" often remains unanswered. From my experience, there are no universally perfect settings that consistently yield optimal results.
I’ll draw my examples from the recent SPY bar chart (February 2024).
The first misconception
The first misconception is that if price is overextended it is time to immediately start looking for a trade in the opposite direction. The most important phrase here is “start looking”. Many beginners misinterpret this as an invitation to commence trading, leading to the premature initiation of short positions during perceived market "overextension" and vice versa.
So, the first and foremost important advice is to never try guessing top/bottom based on one indicator or gut feeling. Simple as it seems I remember many times breaking this rule myself because the temptation was too strong. It rarely ended up well.
On the graph, I've highlighted three recent instances where the RSI exceeded 70 (indicating overbought conditions). What stands out is that, following each occurrence, the price surged significantly before consolidation set in, inflicting losses upon short traders.
Even experienced traders, who look for confluence of signals, may fall into this trap. In the first two examples, bearish candlestick patterns failed to prevent subsequent price increases. Most likely, those candles were “created” by weak hands traders, who tried to short market, while it was actually controlled by strong buyers.
These instances could have been avoided by considering the daily graph, revealing a robust bullish context – price was in an uptrend, one-time-framing up on weekly. There were couple of moments when bears gained short term control (Tuesdays 13th and 20th) but they never could take the previous week low; bulls always confirmed their control.
The second advice is to avoid trading against higher level context. While sometimes those trades might work the result is usually mediocre and most of the times you’ll simply lose. If you really wish to trade against context you need to construct a solid dossier of evidence, supporting your trade.
The second misconception
What is the second misconception? It is that when price overextended it is not time to go with the market. In this scenario, traders refrain from initiating long trades after RSI indicates overbought conditions, potentially causing them to miss profitable opportunities. It might not hurt your account but who likes missing good opportunities?
Surprisingly, seizing these trades correctly is not much harder than any other trade. It simply requires prudence and discipline and getting rid-off cognitive biases. For example, in the second example on the graph a trader could win up to 1% if he played off gap-up open after seeing that the new price has found acceptance.
Conclusion
It is possible to build a profitable strategy that relies on “price overextension” concept. However, it demands more than a cursory examination of a single indicator and adherence to textbook candle patterns. Personally, I reached a point where I entirely abandoned the use of RSI and similar tools because, instead of providing clarity, they seemed to cloud my thinking.
Opting for a more effective approach involves keenly observing actual market behavior, which often defies conventional expectations. Study of high-level contexts, understanding key levels, and discerning confluence in price action signals on lower timeframes consistently prove invaluable. This method helps steer clear of common pitfalls and contributes to enhancing overall trading results.

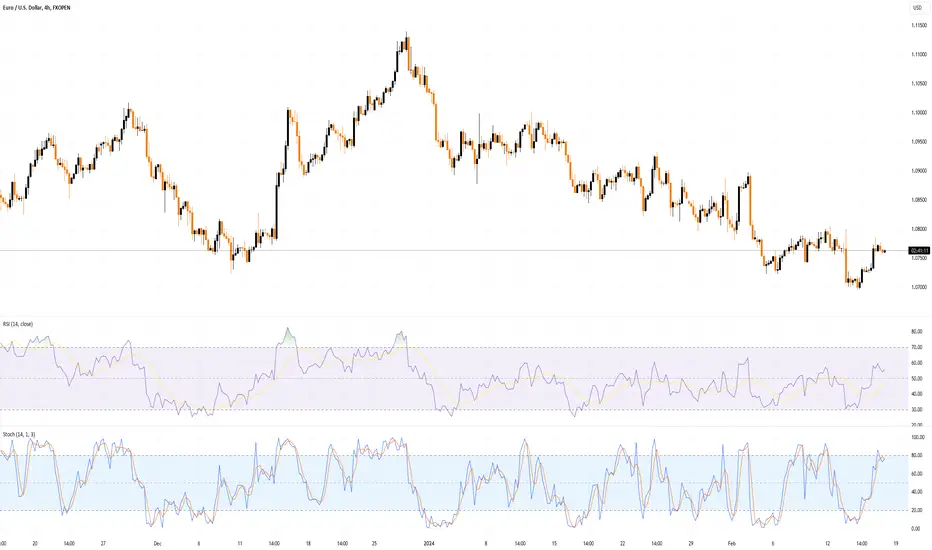
Trading Strategies with the Relative Strength IndexTrading Strategies with the Relative Strength Index
The Relative Strength Index (RSI) is a cornerstone in the world of technical analysis, assisting traders in capitalising on momentum-based opportunities. This article delves into three sophisticated RSI strategies, shedding light on how to deploy the indicator in different trading scenarios.
RSI in Trading Explained
The Relative Strength Index is a momentum oscillator that measures the velocity and change of price movements. Developed by J. Welles Wilder in 1978, the RSI oscillates between zero and 100. Typically, and by default, it is set at a 14-period time frame, meaning it computes momentum based on the last 14 price bars, whether they're days, hours, or minutes, depending on the chart.
The RSI is primarily used to identify overbought or oversold conditions. An RSI value above 70 suggests that an asset may be overbought, indicating a potential sell signal. Conversely, an RSI value below 30 signifies an oversold condition, suggesting a possible buying opportunity.
Moreover, sustained moves above the 50 mark indicate bullishness, while the index being below 50 is typically bearish. While many traders use these basic thresholds, the RSI is versatile and can be combined with other indicators and strategies for more comprehensive trading setups.
To get started with the RSI and the strategies in this article, head over to FXOpen’s free TickTrader platform. There, you’ll find each of the tools discussed waiting for you.
Best RSI Indicator Settings
The default setting for the RSI is a 14-period calculation, which works well for capturing short-to-medium-term price movements. However, traders can adjust this to suit their trading style. For those looking for more frequent trading opportunities, a shorter period like 7 or 9 can be used to generate quicker signals.
Conversely, for swing traders or investors interested in longer-term trends, a setting of 21 or even 28 periods could be more appropriate. It's important to note that shortening the RSI period will make it more sensitive, increasing the frequency of signals, while lengthening it will smooth out the data and produce fewer but potentially more reliable signals.
RSI With Hull Moving Average Confirmation
Incorporating Hull Moving Averages (HMA) into an RSI-based strategy offers traders an additional layer of confirmation for entry and exit points. In this approach, traders can use both a 9-period and a 21-period HMA alongside an RSI that has crossed below the 70 level for a bearish scenario or above the 30 level for a bullish scenario.
Entry
Traders can look for a 9-period HMA and 21-period HMA crossover within a few bars of the RSI crossing the designated overbought or oversold level. When an HMA with a shorter period crosses above the HMA with a longer period, it’s usually considered a buy signal and vice versa.
Stop Loss
Stop losses may be positioned above or below a nearby swing point. This provides a buffer against sudden market reversals while keeping risk manageable.
Take Profit
Profits are typically taken at an identified support or resistance level.
Another option is to exit when the RSI crosses into the opposite extreme zone (from overbought to oversold or vice versa).
A subsequent HMA crossover against the trade direction can also serve as a signal for profit-taking.
The advantage of using Hull Moving Averages for confirmation is their responsiveness to price changes without the noise often associated with other types of moving averages. This strategy aims to capitalise on more robust signals by combining the trend-following characteristics of HMA with the momentum signals of the RSI.
Stochastic and RSI Indicator Strategy
In this RSI trading strategy, the focus is on combining the RSI with the Stochastic Oscillator for enhanced market insight. Both are momentum indicators, but they evaluate different aspects of price action, making them complementary when used together.
Entry
Traders can consider entering a trade when the RSI is above 50 for a bullish scenario or below 50 for a bearish one.
The entry signal may be further confirmed when the Stochastic Oscillator's %K crosses the %D line in the same direction as the RSI reading but below 80 and above 20.
Stop Loss
Stop losses can commonly be placed above/below a nearby swing point.
Take Profit
Taking profits may occur at a clearly defined support or resistance level.
The value of this strategy comes from the synergistic effects of combining RSI and Stochastic Oscillators. While the RSI measures the speed and change of price movements, the Stochastic helps to validate or negate the RSI's signal by considering where the current price is relative to its range over a particular period. This dual-layer approach aims to minimise false signals and improve the probability of a successful trade.
RSI Pullback Strategy
In a clear trending market, identified by a series of higher highs and higher lows for an uptrend or lower highs and lower lows for a downtrend, traders can employ a 7-period RSI for an RSI Pullback Strategy. Ideal when using the RSI for day trading, this strategy focuses on exploiting price retracements, offering an optimised entry point in an already established trend.
Entry
During a pullback in price, traders look for the RSI to enter overbought or oversold territories.
An entry signal may be considered when the RSI crosses back above 30 during an oversold condition or below 70 during an overbought condition.
Stop Loss
Similar to other strategies, stop losses are generally placed near a recent swing point for reasonable risk management.
Take Profit
Profits can typically be taken at an identified support or resistance level.
Alternatively, traders may opt to close the trade at the most recent high or when the RSI crosses into the opposing area (from overbought to oversold or vice versa).
The use of a 7-period RSI allows for a more responsive reaction to price changes, making it suitable for capturing short-term pullbacks. By entering when the RSI reverses from extreme levels, traders aim to rejoin the prevailing trend at a more favourable price.
The Bottom Line
Exploring advanced RSI strategies can be a game-changer for traders aiming to capitalise on market momentum. The strategies here offer a more comprehensive approach than merely adhering to traditional overbought or oversold conditions. To put them into practice, modify them so they suit your trading approach, and experience them in a real trading environment, consider opening an FXOpen account, where you'll find all the tools and platforms necessary to take your trading to the next level. Good luck!
This article represents the opinion of the Companies operating under the FXOpen brand only. It is not to be construed as an offer, solicitation, or recommendation with respect to products and services provided by the Companies operating under the FXOpen brand, nor is it to be considered financial advice.
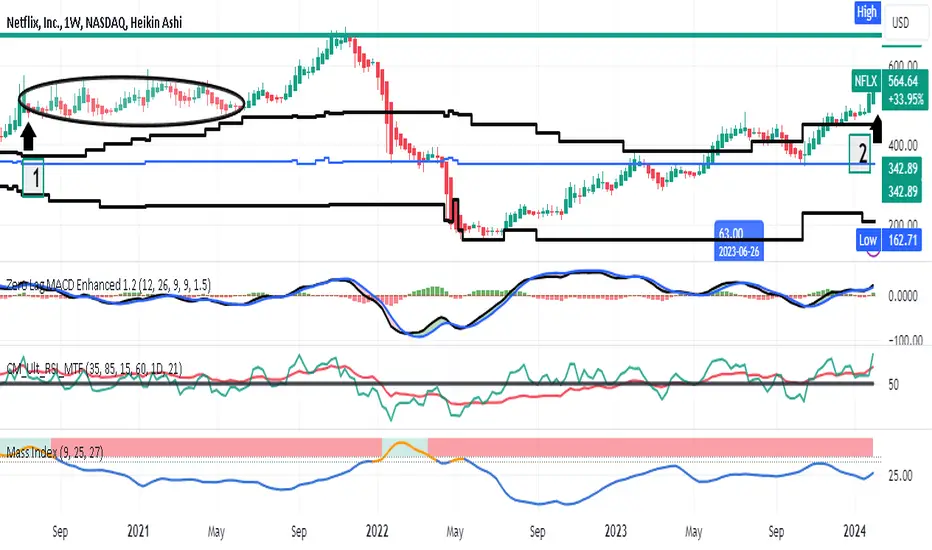
Can NFLX trend higher ? LONGIn its past NFLX got through the Covid downturn with only a 10% correction, then went through
a rise into a year of consolidation and finally another big trend up which reversed badly in
Winter 2021. After a business model adaption and modification of subscriptions and
password/account sharing protections, price has made great gains. On the weekly chart,
a trend upward has been in place since July 2022. On the weekly chart, bigger ranged
candles have been put in for two weeks.
It seems that from here, while NFLX could rise heading toward a new all time high. On the
other hand, just as it did in 2020 at a similar price level ( marked as # 1 and an oval around
the price action), it could get range bound or consolidated ( # 2 marking the present.)
The mass index indicator gives a hint that the trend will continue and not reverse. It is
fluctuating in a mid-range without a hint of rising into the threshold and trigger zones.
Notably in the 2021 downturn, the RSI and MACD ZL) signaled the reversal before the
mass index. Those two indicators in the present show no hint of bearish divergence so far.
Accordingly, for the time being, NFLX continues to be a long trade with 20% upside into
the level of the all-time high ( discounting any effects of inflation and dollar devaluation
in any of this which is very important overall but generally ignored).
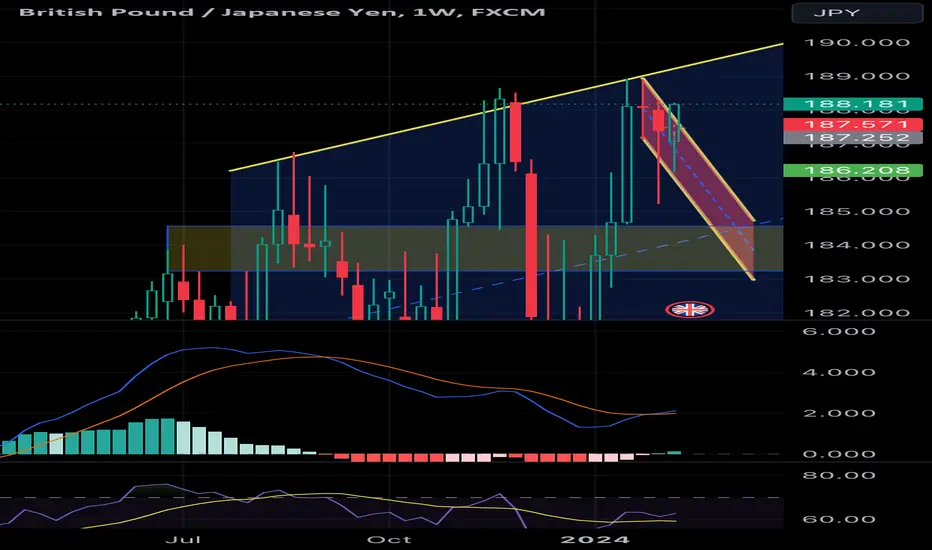
GJ stil short RSI divergence W chartGJ might have took out the 30M entry and also on 1D charts looking sketchy but on the W chart the RSI is posting divergence when u look at the 23 Jan 24 equal highs to today
im looking for a reversal of the 1D candle within 2-3 lengths to validate the W short.
Bullish Medium TermBullish medium term, long term need more info. Lets evaluate once price gets around 35K USD.
I am not a financial advisor. This is not meant to be, and does not constitute, financial, investment, trading, or any other types of advice or recommendation.
Solana(SOL): Good Entries For Sell OrderWhile coin has been showing some weakness to us, we are looking here for short position opportunities!
We are looking here for a breakdown of that "bullish trend," which has been pushing price towards that upper resistance.
If we see a good breakdown, then we can start the climb to lower zones, but if we see another bounce from here, then we suggest to DCA the position.
Swallow Team

Bearish on IBM for 10-11-23.
As you can see here on the 15-minute chart of IBM. We are riding some trendlines. I am looking for us to break under today as we have rejected the 25 EMA, and we were under VWAP yesterday. Also, on the Daily chart, we are below 50 on the RSI. I would be looking at the 5-minute chart for a break under the trendline with heavy volume. Make sure you are under VWAP as well.

TSLA fifth wave and bullish FVG 4h timeframeI've been keeping a close watch on TSLA's recent movements, and there's something worth sharing. It seems we're in the midst of the fifth wave, if we follow Elliott Wave Theory. What's even more intriguing is that on the 4-hour chart, a bullish FVG (Fair Value Gap) could be in the works, indicationing the end of the bearish (fourth) wave.
Adding to the excitement, the Relative Strength Index (RSI) is giving us some interesting signals. It's right on the edge of slipping into oversold territory, a potential sign of a turnaround. Plus, keep an eye out for the impending cross between the RSI and its RSI-based Moving Average (MA), as that could indicate a significant move coming up.
This setup has definitely caught my attention, and I'm thinking there's a trading opportunity brewing. If taking the trade I would suggest a safe stoploss below the fourth wave or a more risky one below the next bullish liquidity void on the chart. I would target the end of the fifth wave as a TP area because after that I believe we will see the first correction wave of the ABC pattern.
Of course, as traders, we know the drill – careful analysis and risk management are key before making any moves.

Seizing the Bullish Momentum with Fundamental Backing! 🚀📈Calling all traders! Get ready for a thrilling opportunity in USOIL (Crude Oil) as we present a compelling bullish setup that is further supported by fundamental analysis. This combination sets the stage for potentially lucrative gains! 💰💥
In the 15-minute timeframe, price retraced to the critical 0.618 Fibonacci retracement level, known for its significance in trend reversals. The bounce from this level indicates the formation of a new higher low, reinforcing the bullish case.
But wait, there's more! The chart also reveals the formation of a head and shoulders pattern, which adds further conviction to the potential trade. This powerful reversal pattern enhances the probability of success.
Moreover, our fundamental analysis complements the technical setup. Recent market news indicates favorable conditions for a bullish move in oil prices. Positive developments, such as a significant decrease in crude oil inventories and growing global demand, support the notion of an upward trajectory.
Additionally, the RSI indicator is currently hovering above the 50 level, suggesting strong buyer interest and an inclination towards further upside momentum. This alignment of technical and fundamental factors strengthens our confidence in the trade.
Furthermore, we've observed a crossover of moving averages, serving as a confirmation of the bullish sentiment. This convergence of indicators further bolsters the case for a buy entry at the current price of 69.00.
To manage risk effectively, it's prudent to set a stop loss below the right shoulder of the head and shoulders pattern. From our entry point, we have several enticing take profit levels on the chart: 69.50, 70.20, and 71.20. 🎯
This setup not only offers a high-winning rate but also a favorable risk-to-reward ratio, backed by both technical and fundamental analysis. Don't miss out on this exciting opportunity to ride the bullish momentum in USOIL. Wishing you successful and profitable trades! 🚀🌟
Don't forget to press the like button if you think this insight was helpful 📊📈

#ASIANPAINT Bullish Divergence!!!#Asianpaint:- There is bullish divergence between price & it's RSI. Price perfecttly following the upward trendline and again taken support at trendline & Moving toward upside. The price respected the support level and persisted itself at the support level . The market is pulling back after testing the resistance and impulse move. I expect growth from the support level. Above 2810 my target will be 2965-- 3020--3230.

COALINDIA Showing good momentum at the CIP+ SUPPORT LEVEL !!!The price taken support at the demand zone & also perfectly following the upward trendline. The support level previous acts as resistance for the price and after the breakout price taken support at the same resistance level (change in polarity level).
COALINDIA
✅Trendline support
✅Demand Zone
✅Support @200
✅Possible Targets-- 228--- 236 ---258
👉Keep on radar for holding✅✅

#ITC Bearish Divergence.#ITC Weekly chart showing BEARISH DIVERGENCE beween it's PRICE & RSI. Upward tredline firstly acting as support for the price & now acting as resistsnce for the price. If price holds itself below the resistance of trendline than peice can come toward downside in coming days.

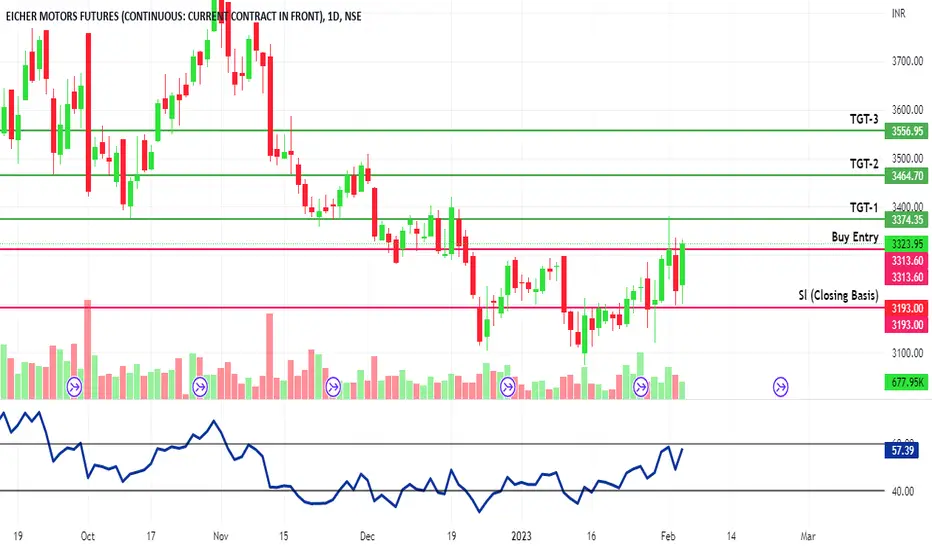
#EICHERMOTOR Showing good momentum #EICHERMOTORS showing Good Momentum on weekly Chat as well as daily chart. We can Expect Tgt of 3374-- 3463 & of 3556 toward upside.
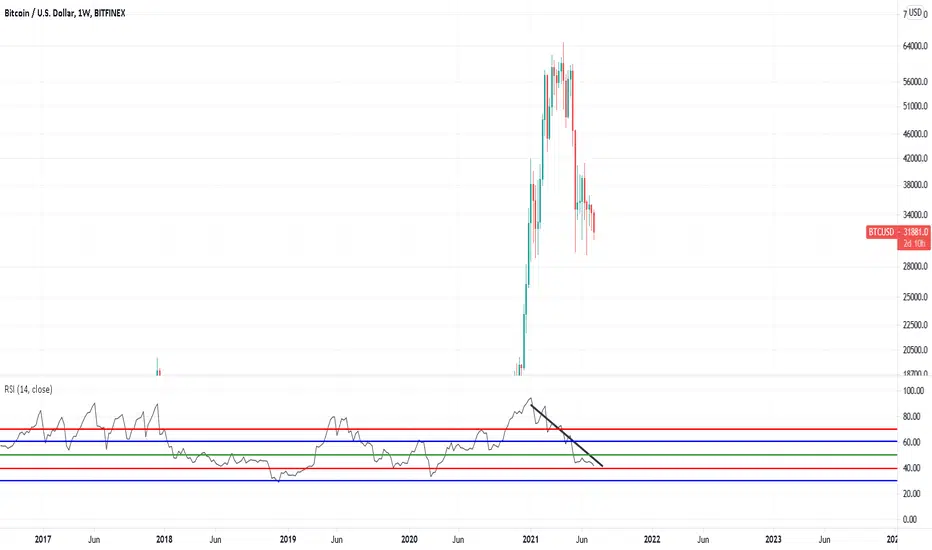
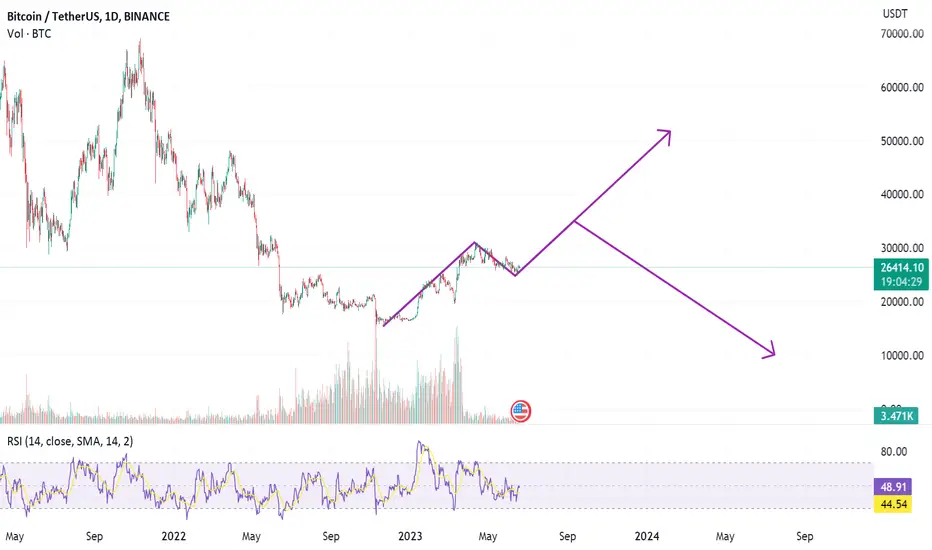
What To Expect From Bitcoin Hands down, things look bleak for Bitcoin. But regardless of what, such bleakness is likely just a short-term glitch. Any break to the downside should be bought up quickly for a rather steep V-shaped recovery. The deeper it goes (as in the closer it gets to $20 000) the faster and more aggressive that recovery should be.
Based on the current technicals there are a few highly likely outcomes from here on. Some of them we've discussed earlier here on TradingView, others are new.
1) Bitcoin takes a final leg down towards the mid $27 000's for an A wave zigzag. We originally deemed this to be completed amidst the recent $28 600 plunge. Yet, Elliott might have one more minor surprise in store before initiating the B-wave. This would all make good sense for two reasons. Firstly, "everyone" expects Bitcoin to drop significantly upon potentially breaking the $30 000 level as there are no real supports to speak of until $20k. And add to that the number of times Bitcoin has already tested the $30 000 support zone and a strong move is anticipated. In this sense, the "expected thing" would be the unexpected as the market rarely does what the majority expects of it. Such final A-wave zigzag to the $27 500 area (give or take) would nicely align with the primary 0,618 fib.
Upon a steep recovery from this level Bitcoin would initiate its B-wave rally, which, to many, would be a "confirmation" that Bitcoin is now ready for higher highs. That in turn would be the prime area of danger as Bitcoin could then initiate an aggressive C-wave to kill off any last hope.
2) Bitcoin initiates its B-wave already. There are three things that speak loudly in favor of this outcome. Firstly, Bitcoin is flirting with the lower bullish RSI line and would, if closing within 1% from its 39,55 value, issue a strong buy signal. These signals come with a high reliability and low risk and are famous for generating profits in the thousands of percent. As it stands, any daily closing at around $31 500 should result in a buy signal.
Secondly, upon such a buy signal it would likely trigger an initially steep upwards move - one that would also break above the long-stretching RSI resistance. This resistance has eight rejections already. And the more times any resistance line is tested, the more energy it saves up to be released upon a break thereof. A lower bullish red RSI closing in combination with a diagonal RSI resistance breakout should be enough to propel the price into the mid to late $40 000's in the upcoming few weeks.
And thirdly, the lower bullish red line on the weekly stands at 41,65. This number is fixed and never changes. Based on the current reading at 42,02 it does qualify for a weekly buy. Do note, however, that this needs to be the weekly RSI closing - as in +/-1% from 41,65. We always base these on the closes.
But here's an additional very important clue: When a lower bullish red RSI closing comes immediately from high levels - as it does on the weekly Bitcoin chart - any buy signal typically means a relief rally rather than an actual reversal. This would confirm a B-wave move to follow in a textbook fashion. The strong, long-term buy signals are in turn given when the RSI creeps up from lower levels (generally speaking 30 or below) and then makes a clear touch from slightly above.
For more these strategies you are advised to watch the RSI trilogy on our YT channel.
As a short summary: I doubt that Bitcoin will plunge down low from here. A final A-wave zigzag down to the $27 500 area would make perfect sense. If not, and if we get a lower bullish red closing on the daily (and ideally on the weekly too) and a break above the diagonal RSI resistance on the daily, then a steep B-wave should be initiated.