Equal Weight $SPY, $RSP, performing BETTEREqual weight AMEX:SPY is outperforming the regular CBOE:SPX #Index again
AMEX:RSP
We mentioned not long ago that the big names that ran were struggling a little recently.
Money Rotation?
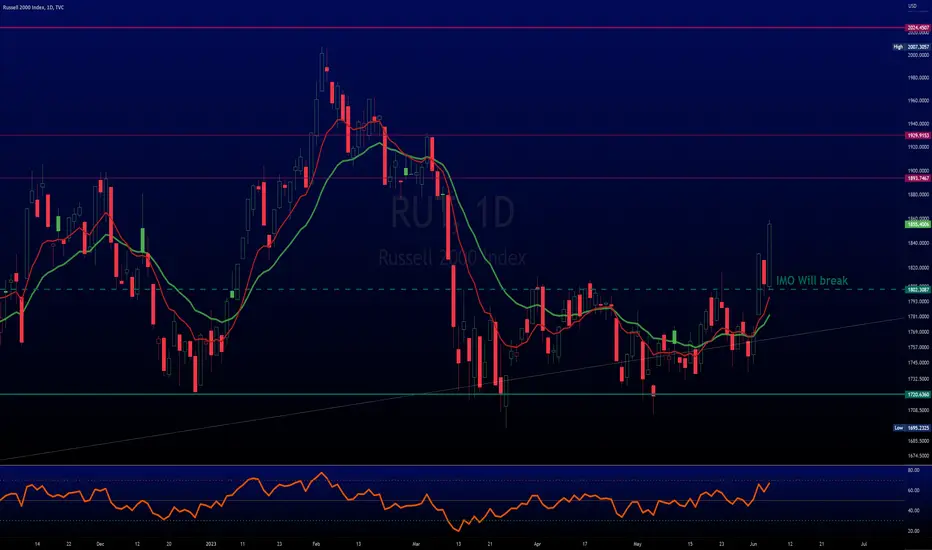
TVC:RUT could do a lil better. Not participating as much.
But it's nice to see AMEX:RSP doing better than normal #SPY.
TVC:VIX heading lower gain
#CPI Tomorrow
RSP

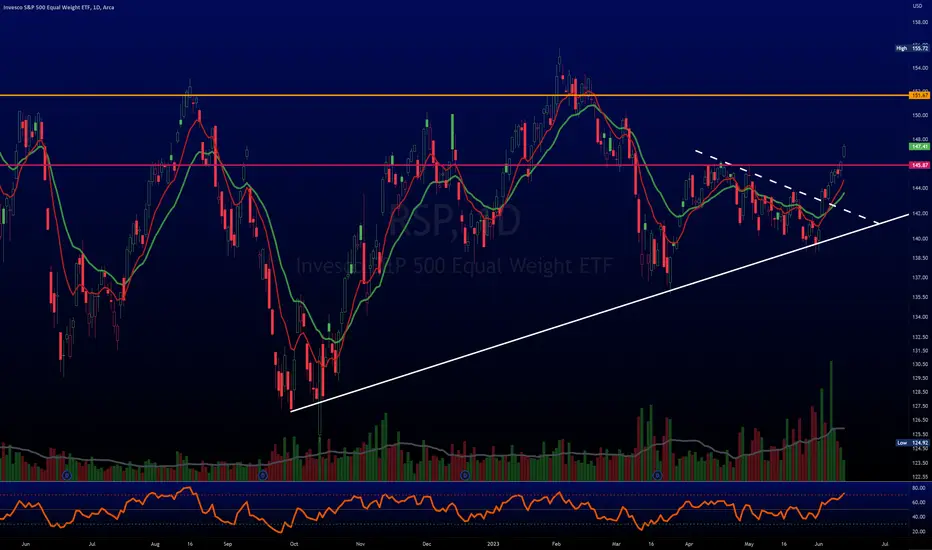
$SPY no longer underperforming $RSP or $RUTLooks like the idea of BTD (Buy the Dip) is still in place.
IMO not enough EUPHORIA for "crash" (like many are calling).
AMEX:RSP (equal weight SP:SPX ) was outperforming AMEX:SPY but that is no longer the case as of yesterday.
TVC:RUT AMEX:IWM also lagging but the chances are that it will likely catch up in time.
#stocks
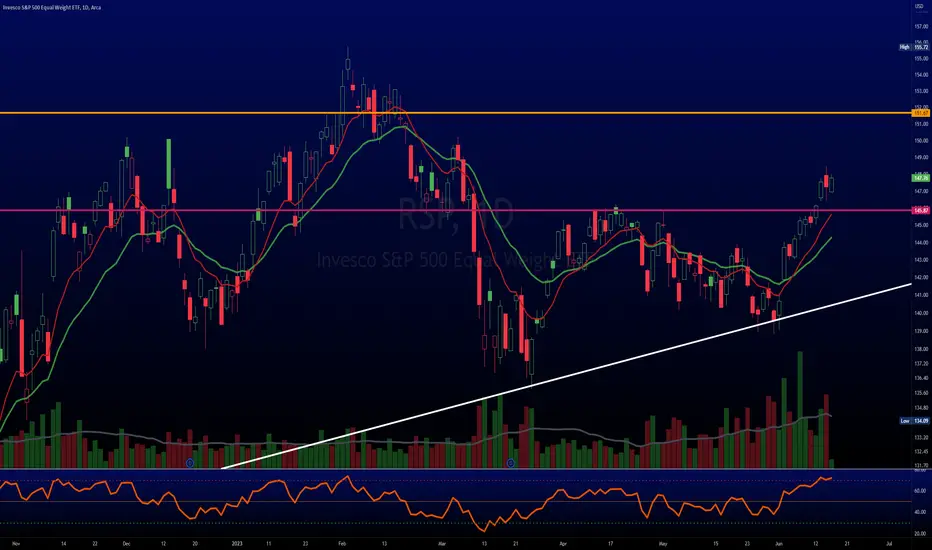
Is the rest of the market joining the rally?The weekly chart (on the bottom) shows that SPY and RSP were highly correlated until early March. After March, we have seen the two separate in YTD returns. The correlation coefficient confirms this break in trading. The breakdown in correlation between the RSP and SPY is most evident between May and June when RSP lost value and SPY gained value.
In the last week, we have seen SPY clear August '22 high. For many, this confirms that a new bull market has begun.
While the RSP is far from its August '22 high, we saw it break a short-term resistance level yesterday (6/13/23). The correlation coefficient is also rising back towards 1. It appears that RSP is beginning a new leg up. I believe a new leg up in the RSP confirms the Bull case for the SPY.
With the Fed decision this week and both equities close to a support/resistance line, I am also watching for the invalidation of this breakout in the RSP and SPY. For me, that would be both equities closing below their near support/resistance lines.

$RSP performing better than $SPY, like we caleldAMEX:RSP = equal weight SP:SPX
We see that volume has been very good
AMEX:SPY is underperforming it & that is a good sign
NASDAQ:NDX underperforming as well
This means money is moving around & every one gets a chance to play
AMEX:IWM TVC:RUT has legs, call that it would break out was good
It also had great volume a few days ago
IMO #Stocks have what it takes to keep moving
$RSP & $RUT show money is in rotationAMEX:RSP looks okay to me (Equal weight SP:SPX )
TVC:RUT / AMEX:IWM also looks okay
Question:
What is the common theme?
HEAVY VOLUME!!!
Buys are heavier than normal for those 2 indices and NASDAQ:NDX / NASDAQ:QQQ has selling that's lil heavier than normal
Looks like rotation IMO
Our calls were on the money again...
#stocks

$RSP & $RUT performing well, money moving to underperformers Breadth has gotten better compared to last week
AMEX:RSP vs AMEX:SPY - Equal weight has outperformed
TVC:RUT Russell 2k pumping as well, our call on break looking good
NASDAQ:NDX looks to have short term topped - most flyers here
DJ:DJI hanging on - underperforming assets could be prepping to move
💵 could be moving from high flyers, it seems

$RUT $IWM & $RSP looking better = Breadth picking upTVC:RUT went above the SUPPORT line again before it closed
AMEX:IWM (Russell 2k) looking BETTER and better
AMEX:RSP (equal weight #SPX) also looking GOOD, look @ BUY VOLUME! It's performing better than SP:SPX
While we were wrong for couple days, we were RIGHT in the analysis that breadth was going to get better
#stocks
SPY Analysis - Market Breadth, Fed Rate Cycles, and InflationI measure the breadth in the S&P as the SPY (market cap weighted S&P) divided by RSP (equal weighted S&P ETF). The higher the ratio, the more concentrated the market, and therefore less market breadth.
As can be seen, nearly every time the ratio has neared 3.0, the Fed has ensued with an easy money policy, and the SPY subsequently turned bullish. During these times, Fed rates, as well as inflation, were relatively low.
There are several exceptions. in November and December 2021, the ratio neared 3.0 at 2.97, and the Fed ensued in early 2022 with an historic rate tightening cycle, on the heals of persistent inflation of 4.7 percent in 2021 which had resulted (and continues today) from the massive COVID stimulus program. The end result was the selloff in we experienced in 2022.
Another exception was the period from 2015 to 2019, when rates were gradually raised, but maxed out at 2.40 in a relatively low inflation environment. This is not the environment that we are in today.
Today, we have already had a 50 - 61% retrace from the low posted in October, 2022, and the market breadth is again at a low (SPY/RSP=3.00) . The Fed now has the option of pausing/easing and in effect pump a bull, but by doing so it will face a huge dilemma: with an annual inflation rate of 8 percent, and the largest budget deficit in modern history, a return to easy money will further fuel inflation.
The other option would be to continue the rate hikes, and promote an economic collapse (starting with the banking sector), which will effectively bring the breadth issue to rest (along with the entire market).
Neither of these are good options. Bitter pill...

$DJI leading, 1st time in long time, What about breadth? $RSPIs value coming back into play in the #stockmarket?
The NASDAQ:NDX does seem a lil over extended
Today is the1st day in LONG TIME that the DJ:DJI is leading and the RSI looks healthy
SP:SPX is over the 50% Fibonacci
AMEX:RSP (Equal weight #SPX) has chance to perform here
Let's see if the breadth of #stocks gets better
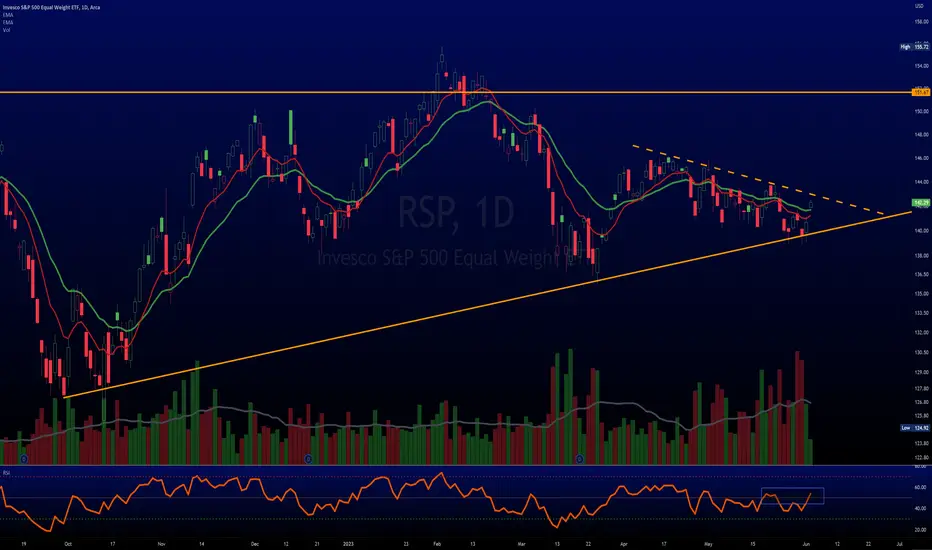
S&P Equal Weight Index (RSP Daily analysis)The volume below is very thin (yellow highlight), and the chart trend is downward and weakening. The equal weight index actually performed a little better than the weighted index during the selloff, retracing only 42% versus SPY 50% during the period of Covid low in March 2020 to all time high in January 2022.
There are three lines of potential support, all at volume points of control as well as Gann lines:
138.96, or -1.8% from 5/12 close at 141.52
135.31, or -4.4% from 5/12 close
130.2, or 8.0 % from 5/12 close
I'm inclined to believe the 8% scenario is most probable, since typical corrections (which I believe is imminent) range around 7%.

QQQ New highs! What's next?The Nasdaq made a new 52 week high.
can we officially say we entered a new bull market?

MAJOR CRASH CYCLE IS READY TO START NOW SPIRAL F17 The chart posted is that of RSP sp 500 equal weighed The spiral cycle are in the window from today to may 12 .I AM LOOKING FOR A CRASH TO BEGIN I AM MOVING TO A 75 TO 80 % NET SHORT TODAY HERE AT 4155 I WILL MOVE TO 90 % SHORT AT 4100 ON A STOP OR IF WE RALLY ABOVE 4171

RSP SP FAR SO GOOD I AM NET SHORT 50%The chart posted is that of the RSP Equal Weighted sp 500 I feel the date of jan 27 was the top in the Bull phase and a very neg phase is apond us for 5.8 to 6.1 weeks
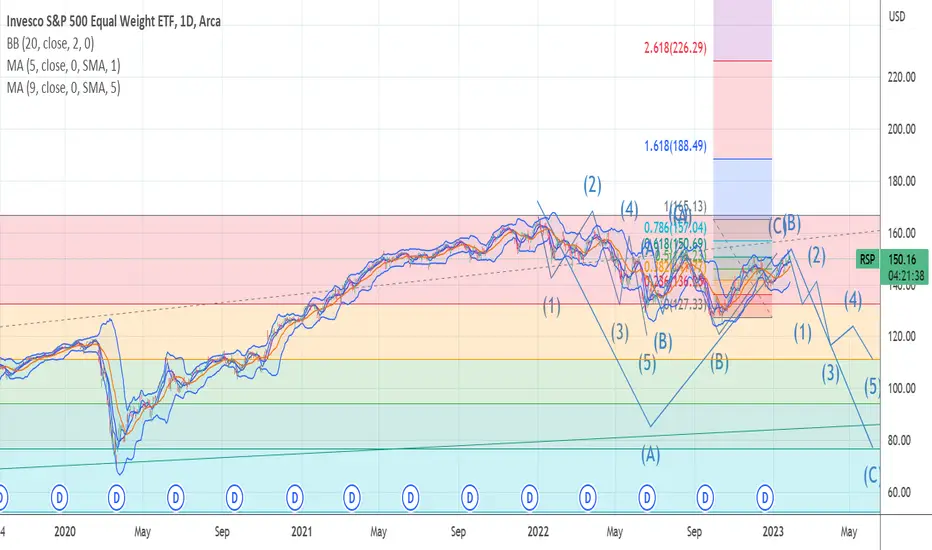
ALT SP 500 WAVE STRUCTURE IS STILL VALID 4th wave The chart posted is the alt wave structure . there is a cycle low due 12/16 and odds favor the last grasp up into jan 3/10 . I still need time for the 2023 forecast as it is a very neg cycle I am working on the time spirals still and it take hours to back check the data back to 1902 . So for now I still feel that we are now in dec late 1973 . The cycle projection from dec forecast model was spot on for the low due 10/4 to the 20th focus on the 10th and a target of 3510/3490 . I am working on the math > I can tell everyone that 2023 will see another drop and decline with the market going from inflation to a massive deflation cycle as the chart of housing is just starting to roll over. As the 40 plus year bull market in BONDS has ended and we just are going back to mean in RATES I do not see rates ever going back to under 2/2.5 in the 10 yr and I have a view that we will see a debt implosion The final bear market low should be oct 2023 and sideways to down into oct 2024 The DEPRESSION LOW

ALL INDEXES SAME PATTERN ABC DECLINE INTO .382 AND 50 % IHAVE NOW COVERED ALL NET SHORTS .I am now moving to a net LONG AT 50 TO 75 % as of this morning . In fact TROW model told me we would see this sharp drop into cycle low due now TROW also dropped to a perfect .618 at todays low at 109.40 the low 109.18 I am net long and out of any shorts at this point BEST OF TRADES WAVETIMER I will be posting the long term update and forecast as I did in dec 22 2021 over this weekend . BEST OF TRADES WAVETIMER

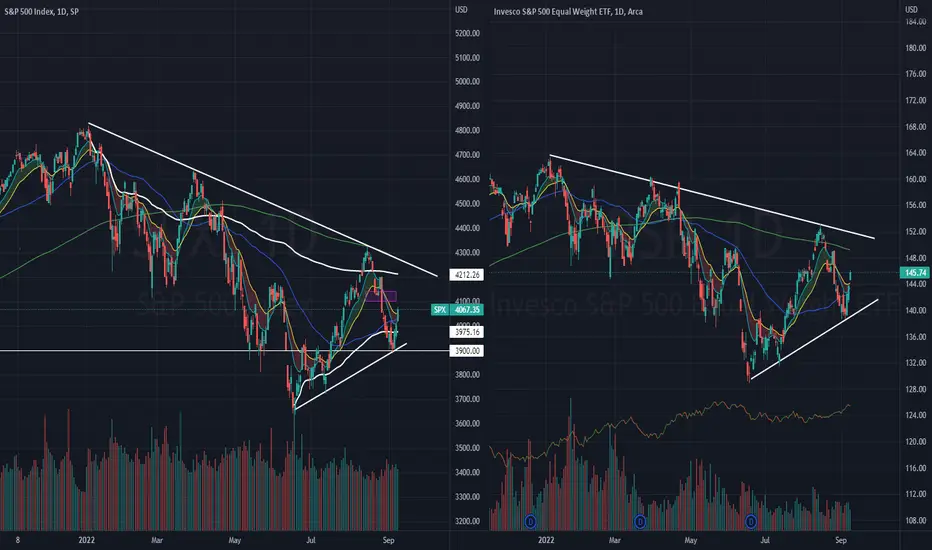
$SPX (S&P 500) vs $RSP (S&P 500 Equal Weight) – (Net High/Low 33$SPX posted its second consecutive week of gain (+3.95%), reclaiming its 50-day moving average (declining) during the week. $SPX is currently 5.6% away from recapturing its 200-day moving average.
There is a growing belief among market participants that the Fed will soften its approach after the November meeting. The policy move from the Bank of Canada this week further fueled this notion. The Bank of Canada raised its key policy rate by 50 basis points versus an expected 75 basis points. The European Central Bank, however, delivered a 75 basis point increase for its key policy rates, as expected.
Market participants digested a slew of economic data this week that both supported and undermined the notion that the Fed will soften its approach soon. Some of the data releases included:
September PCE Prices 0.3%
The key takeaway from the report is that with continued income growth and a slightly hotter than expected Core PCE price growth, the Fed has an argument to maintain its aggressive rate hike course.
Weekly Initial Claims 217K
The key takeaway from the report is that the initial claims data suggest the labor market continues to hold up well, which of course is something that will continue to draw the Fed’s attention.
Q3 GDP-Adv. 2.6%
The key takeaway from the report is that it ends a two-quarter streak of negative GDP prints. It also suggests the economy held up well in the third quarter as it started to acclimate to rising interest rates. Real final sales of domestic product, which excludes the change in private inventories, increased a solid 3.3%.
October Consumer Confidence 102.5
The key takeaway from the report is that consumers’ concerns about inflation picked up again in October on the back of rising gas and food prices.
Falling Treasury yields were also a big support factor for the stock market rally during the week.
The support to watch for this week is revised up to 3,720 level, a beach of $SPX rising 10 & 20-day moving average.
Bull Case: Reclaim above 4,110, 200-day moving average level.
Bear Case: Breakdown of 3,720 level, beaching its rising 10 & 20-day moving average. Next support at 3,490 level.
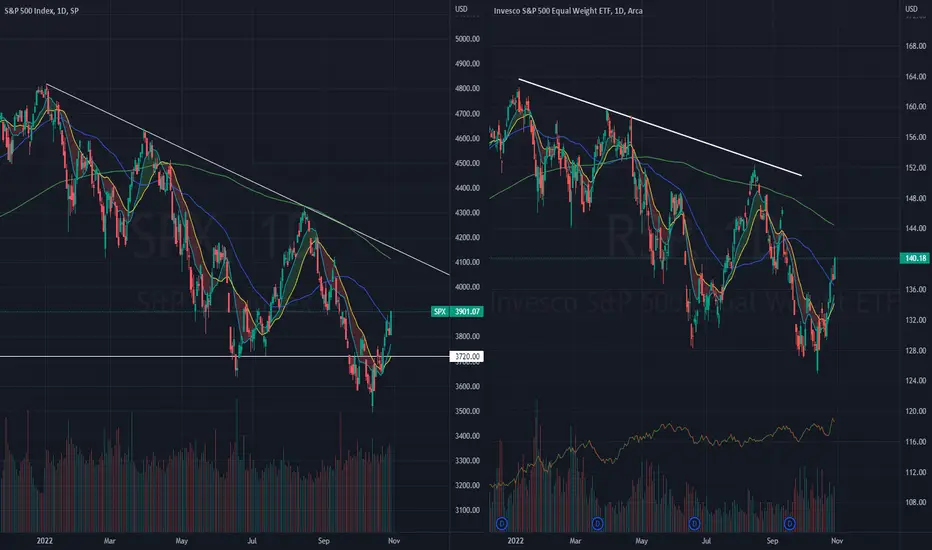
$SPX (S&P 500) vs $RSP (S&P 500 Equal Weight)$SPX (S&P 500) vs $RSP (S&P 500 Equal Weight) – (Net High/Low +17)
The stock market came into this shortened week of trading on a three-week losing streak. It looked on Tuesday as if that streak might be extended to four weeks, but there was an abrupt turn in sentiment that powered a strong move in the major indices over the last three sessions from 3,900 support level. The losing streak was eventually broken and both the $SPX and $QQQ had reclaimed a posture back above their 50-day moving averages.
The resilience to selling efforts in the face of negative developments has fostered a sense that the market has priced in the near-term rate hikes already after enduring three, consecutive weeks of losses. At Tuesday's low, the $SPX was down 10.1% from the intraday high it saw on August 16, so there has been an added sense that the market had gotten oversold and was due for a technical bounce.
At the current juncture, the mid-term downtrend remains intact as $SPX remains trading below its declining 200-day moving average, and AVWAP from all time high.
The support to watch for this week remains at 3,900 level, the recent lowest level.
Bull Case: Reclaim above 4,212 AVWAP from all time high. Immediate resistance at declining 200-day moving average and downtrend line.
Bear Case: Breakdown of 3,900 recent low. next support at 3,800.
Breadth has been strong and this week will be critical for $RSPThe market as a whole needs this rally to have healthy breadth and so far that's what it looks like is happening, a broad-based rally.
It closed above its 200 DMA for the first time since April 21st (albeit by just 13 cents) which is also when the downtrend started. The downtrend has been thoroughly broken.
Looking for 2-3 more strong daily closes above the 200 DMA to be relatively certain that the rally will continue and we could be back in a bull market.

RSP CHANNEL AND .382 at the trendline why we have more downside is still ahead the trendline support at .382 once we break the whole system is falling apart

Reversal likely to hold up #SPX $SPY $RSP I expect some continuation from this recent rally. The percentage of SPX stocks trading above their 50-day MA is now bouncing from being too far below the lower band of the channel I have defined.
Annotated on the chart are the previous times it significantly breached the lower band.
MACD histogram turning green with MACD line curling up for a cross. RSI bounced and has some momentum. Next test at 50.
Bar some terrible news from Ukraine or Taiwan, we should see some of this momentum carry the market higher. For how long? Unclear. I would like to see $RSP start to outperform $SPY to signify broad strength opposed to a few names carrying the entire index (not sustainable or healthy).

TOP WAVE STRUCTURE WAVE A DOWN Enjoy this picture . And REMEMBER who told you the top 2020 and low hey its the same guy who said dec2021 in the forecast for 2022 also told you to be ready and go 90% net long at the LOW . watch OCT 4 th week you have not seen anything .have a good week I did

$SPX (S&P 500) vs $RSP (S&P 500 Equal Weight)$SPX fell further with a loss of -1.58% last week, driven primarily by worsening Russia-Ukraine developments. Risk sentiment was further pressured by disappointing growth-stock earnings reactions and lingering concerns about a Fed policy mistake. 10 of the 11 S&P 500 sectors ended the week in negative territory.
With a considerable loss of -1.58% over the week, improved posture in weekly market breath is actually observed as below;
% of Stocks Above 200 DMA = 34.29% (+0.03%)
% of Stocks Above 50 DMA = 35.54% (-0.14%)
$SPX remains resisted by a Downtrend Line, along with its 200-day moving average.
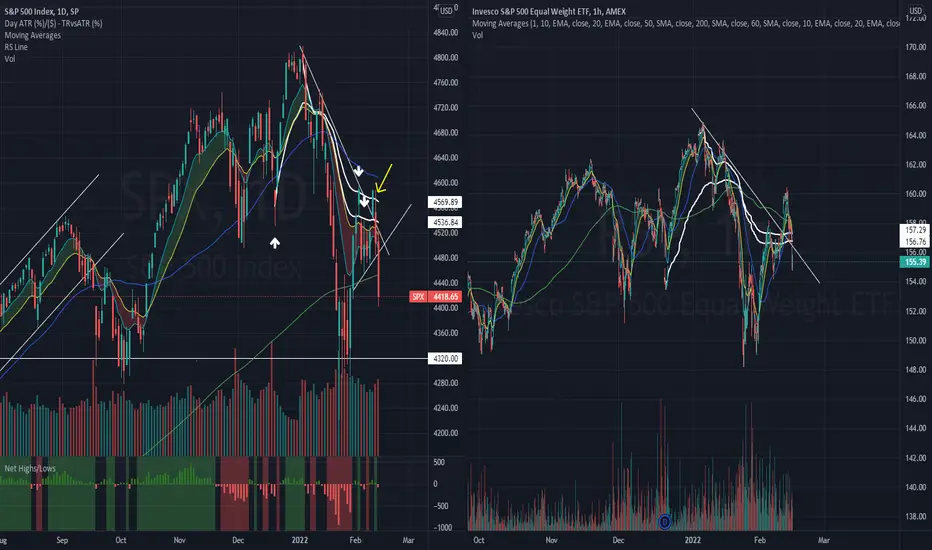
The immediate support to watch for $SPX this week remains at 4,320 level. A breach of 4,320 level would be concerning in mid-term as it would confirm the establishment of a downtrend channel (lower highs, lower lows) on $SPX.
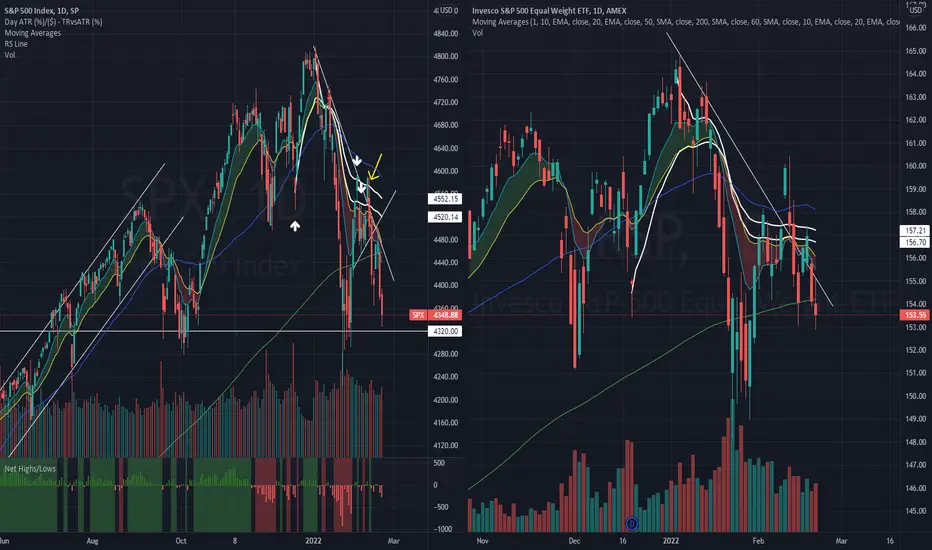
$SPX (S&P 500) vs $RSP (S&P 500 Equal Weight) $SPX breached its 200-day moving average, as $SPX upward momentum faltered with a -1.90% plunge on Friday after National Security Advisor Jake Sullivan acknowledged there was a “distinct possibility” that Russia could invade Ukraine before the end of the Olympics.
$SPX ended the market week with a loss of -1.82%. $SPX remains resisted by a Downtrend Line coinciding with its all time high VWAP resistance.
It is worth to note further deceleration of deterioration on market technical is witnessed on US Market Net Highs/Lows, with only -65 companies for the week (comparing to -121 companies on previous week).
The immediate support to watch for $SPX this week is at 4,320 level. A breach of 4,320 level would be concerning in mid-term as it would confirm the establishment of a downtrend channel (lower highs, lower lows) on $SPX.
he large-cap indices struggled last week, as risk sentiment was pressured by increased rate-hike expectations and concerns over tensions between Russia and Ukraine. The S&P 500 fell -1.8%, the Nasdaq Composite fell -2.2%, and Dow Jones Industrial Average fell -1.0%. The Russell 2000, however, rose +1.4%.
Wednesday’s Fed minutes may provide a sense of how quickly policymakers want a rate-hike. The U.S. data calendar features January figures on producer prices, which will be closely watched after data last week showing consumer prices hit their highest in 40 years last month.
Meanwhile, earnings season is ending, but not before a last flurry of reports.
Here’s what you need to know to start your week.
1. Geopolitical tensions – Gold & Crude
Wall Street’s three main indexes closed sharply lower on Friday after the White House warned that a Russian attack on Ukraine could begin any day. While stocks got hit, prices for Treasuries, the dollar and other safe-haven assets, such as gold ($GLD) rose.
Crude prices also surged as the prospect of sanctions on Russia, a top producer, added to fears over already tight global supplies.
Some analysts believe soaring crude prices could exacerbate already high inflation, adding to pressure on the Fed to raise rates more aggressively.
2. Geopolitical tensions – Lessons from 2014
In keeping in line with history, we could draw lessons from when Russia invaded the Crimean Peninsula in 2014.
Tensions intensified over February through March in 2014 with the ensuing invasion drove a brief rally in the US 10-year Treasury note from a peak of 3.03% at the end of 2013 to about 2.58% by early February before stabilising in a 2.45%–2.6% range until June. There was a similarly mild and short-lived response in stocks and at a time of many other developments. The S&P500 sold-off by under 6% from late January through early February 2014 and then went on to rally for the remainder of the year.
Russia eventually got heavily sanctioned and the ruble eventually collapses and subsequently drives imported inflation much higher. That scenario in 2014–15 drove the Russian central bank to hike its key rate from 5.5% at the start of 2014 to a peak of 17% by the end of 2014. The Russian economy achieved no growth in 2014 and shrank by 2% in 2015.
Nevertheless, differences to 2014 include the facts that Russia’s military build-up appears to be much larger this time than in 2014 and both Europe and the US appear to be much more supportive militarily. Whether the net effect raises risk, or lowers it given a stronger counter presence is highly uncertain.
3. FOMC
With markets already pricing in a strong chance the Fed will hike rates by half a percentage point at its upcoming March meeting, Wednesday’s minutes from the Fed’s January meeting, will be scrutinized for any indications on how big a move officials are contemplating.
Last month Fed Chair Jerome Powell flagged a March lift-off and said there was “quite a bit of room” to raise interest rates without threatening the recovery in the labor market.
Last Thursday Bullard said in the light of the latest CPI reading he now wants a full percentage point of interest rate hikes over the next three Fed meetings.
On Friday, Goldman Sachs said it now expects seven quarter percentage point rate hikes this year, up from its previous forecast of five, as it updated its forecast following Thursday’s U.S. CPI data.
4. Earnings
Earnings season is drawing to a close, but this week will see a big flurry of notable reports. Airbnb Inc ($ABNB) reports on Tuesday, followed by semiconductor giant NVIDIA ($NVDA) and Cisco Systems ($CSCO), which are both due to report after the close of trade on Wednesday. Deere ($DE), the world’s largest maker of farm equipment reports Friday.
Retailer Walmart ($WMT), known for its everyday low pricing, reports Thursday, and is better positioned than other retailers to withstand rising price pressures. The pandemic has triggered inflation across the supply chain from labor to raw materials, forcing companies to pass higher prices onto consumers. However, many companies could still not fully offset the impact and that hit their profits.