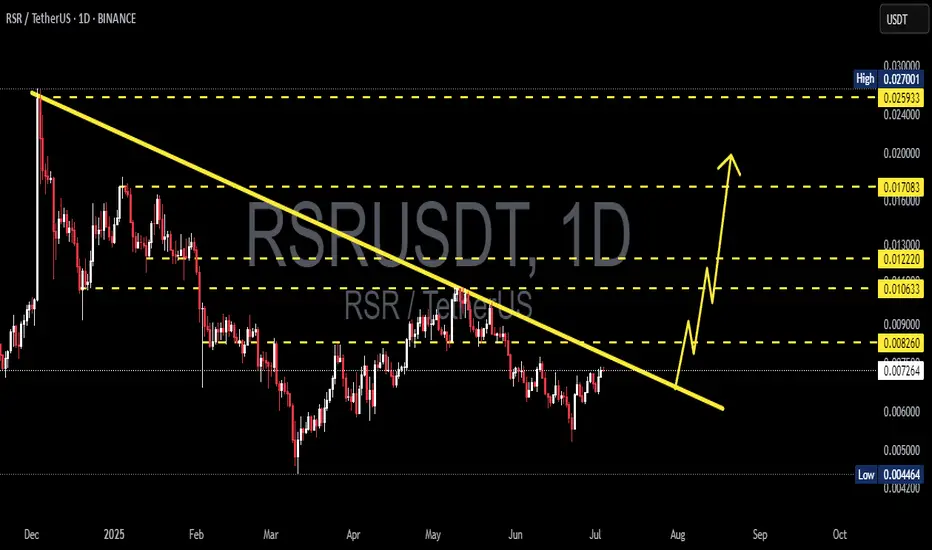
RSR/USDT Breakout Play – Approaching a Major Reversal
🧠 Full Technical Analysis (Timeframe: Daily)
RSR/USDT is at a crucial decision point after months of consolidation.
The price action has been forming a classic Descending Triangle pattern, a structure that often precedes major breakouts or breakdowns. As we approach the apex of the triangle, RSR is now testing a descending resistance trendline that has capped prices since December 2024.
🟢 Bullish Scenario: Breakout Toward an Explosive Rally
If the price successfully closes above $0.0083 with strong volume confirmation, it could trigger a trend reversal and unlock a potential multi-phase rally.
🎯 Potential Bullish Targets:
Target 1: $0.0106 – Minor resistance and possible initial take-profit zone.
Target 2: $0.0122 – Last major distribution zone before the previous breakdown.
Target 3: $0.0170 – Strong historical resistance and psychological level.
Max Extension: $0.0259 – $0.0270 – Could be reached if the breakout gains momentum, potentially delivering over +200% upside from the current level.
📈A clean breakout could attract both retail and institutional buyers, leading to significant upside in the short to mid-term.
🔴 Bearish Scenario: Fakeout and Deep Correction Risk
If RSR fails to break out and gets rejected at the trendline resistance, we could see a pullback or bearish continuation. Key support levels to watch include:
🔻 Possible Downside Levels:
Support 1: $0.0072 – Current horizontal base of the triangle.
Support 2: $0.0060 – Previously tested demand zone.
Major Support: $0.0044 – Yearly low and strong bounce zone if panic selling occurs.
📉A rejection at the trendline could open up short-term downside of 30-40%.
🧩 Pattern Highlight: Descending Triangle (Breakout Imminent)
✅ Dynamic Resistance: Downtrend line from December 2024.
✅ Horizontal Support: Around $0.0070 holding firmly.
🚨 Breakout Approaching: Watch for a daily close above resistance.
📌 Confirmation: Breakout should be supported by increased volume to be valid.
🧠 Strategic Notes:
Always confirm breakout with volume and candle close.
Breakout setups like this offer high R:R swing trade opportunities.
Use proper risk management around key levels.
🔍 Conclusion:
RSR is facing a make-or-break moment after months inside a descending triangle. A breakout above resistance could ignite a powerful rally, while a rejection might trigger another wave of correction.
Breakout or Breakdown? The next few candles may decide everything. Stay ready.
#RSR #RSRUSDT #CryptoBreakout #DescendingTriangle #AltcoinSetup #TradingSignal #CryptoAnalysis #BreakoutPlay #CryptoCharts #CryptoTechnical
Rsrusdttrade
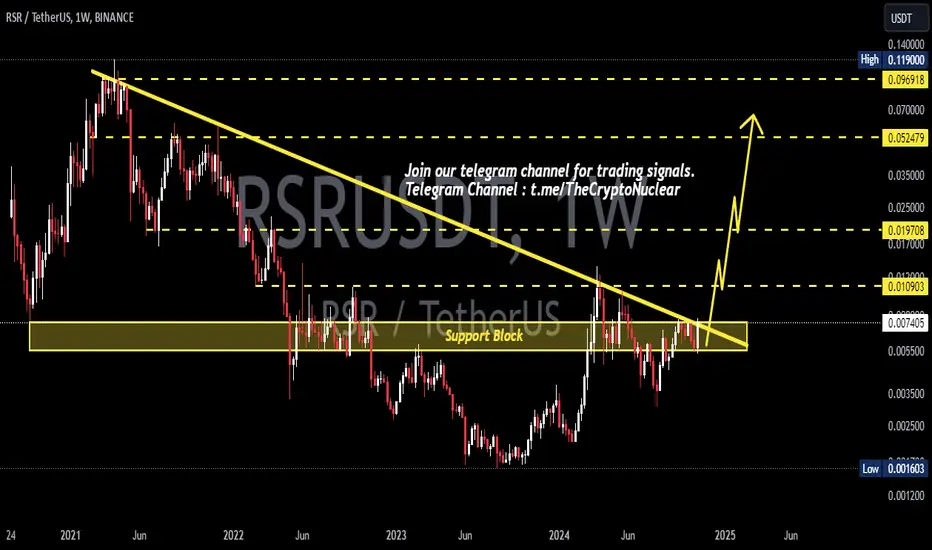
RSRUSDT 1WRSR ~ 1W Analysis
#RSR Buy gradually from here if you still have a Conviction on this Coin with a minimum target of 20%+.
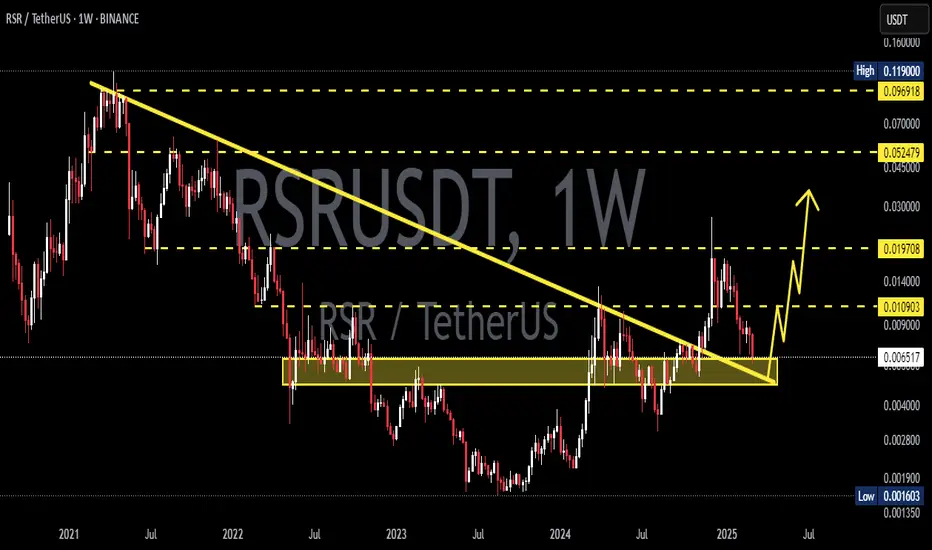
RSRUSDT 1WRSR ~ 1W
#RSR Still in a bullish trend so far. If you still have Conviction on the coin,. Buy in stages from here. with a minimum target of 15%+

RSRUSDT 1WRSR ~ 1W
#RSR If you still have Conviction on the coin,. this support block would be a very good buying place for now. buy in stages. short term target of at least 20%++
RSRUSDT bouncing from monthly supportThe price shot up beyond monthly resistance MR1 only to come back down and retest it again where it was rejected and sent back down towards monthly resistance MS1. The price has bounced from MS1 after hitting it and weekly resistance is causing the price to pullback on this bounce. The price might still dip into MS1 before a stronger bounce in case this current pullback goes further deep. However, this monthly support is a strong one and will allow the price to bounce and continue its journey in upward direction, Therefore, I see the price moving beyond monthly resistance MR1 after having a brief pause and pullback there. Once it breaks MR1, it will target monthly resistance MR2 zone. Therefore, a long from MS1 is favorable for this asset at least for the coming months.
