btc corelation with stock market?Yes or no?
Governments printing T R I L L I O N S of dollars.
Will it benefit btc?
Yes
Will btc have a massive bull run?
Yes
WIll purchasing power lessen?
Yes
Just my 2 cents
Health is more important than wealth
RUN


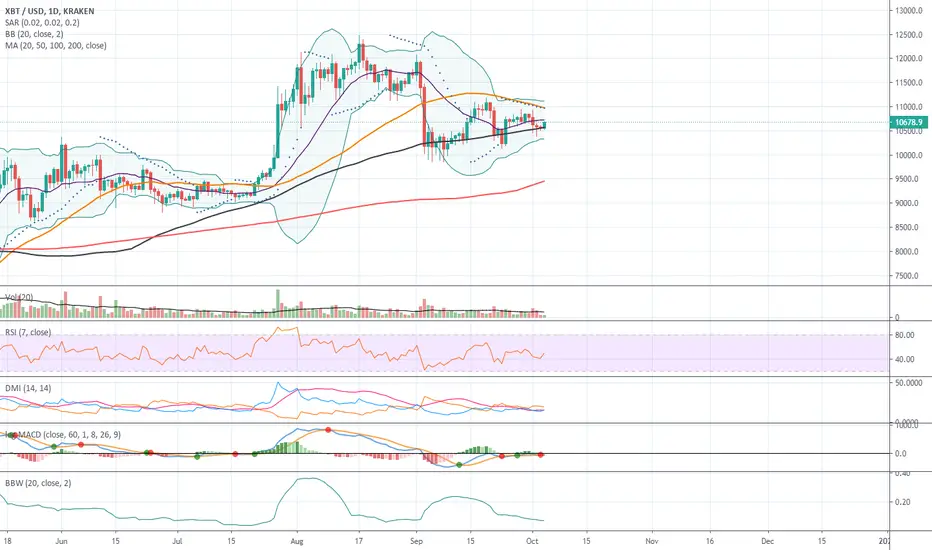
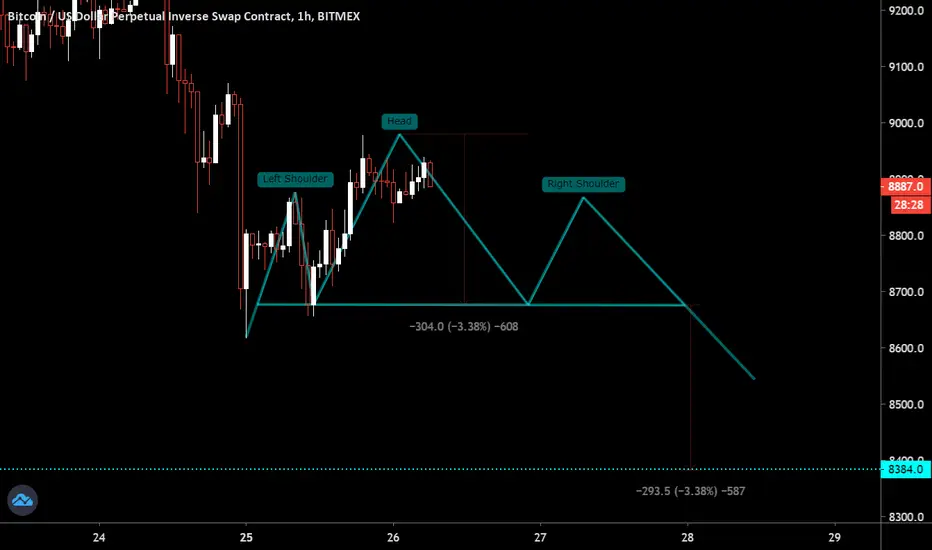
BTC UPDATE - EXTENSIVE BUT SIMPLE ANALYSIS A resume of the idea: despite being very bullish in the long term, BTC may experience a "flash" crash in the next days, to retest key levels before taking off in the following weeks. Many key indicators are bullish (NVT for example), but they are longer term indicator. In the shorter term, there is a confluence of indications suggesting that BTC could revisit 9000 area before enjoying the results of the halving.
Hello, after weeks of sideways movements, it is time for watching at BTC from a different angle. I usually do not watch much at Moving Averages, but there is a very solid confluence of them on different timeframes.
The daily TF is on the main chart. BTC appears weak here, below the 20 and 50 MA and shily rebouncing on the 100. The 200MA, never retested properly since May, is at 9400.
The 3D is similar. 100 MA is at 9k and the 200 is at 8500
The weekly timeframe uptrend seems to to run out of steem after 6 months of run, as the SAR indicator is closer and closer. The 200 was already tested during the covid, but the 50 is at 8900.
The monthly touched the upper band of Bollinger but failed to brake out the SAR. The price still has to retest the 21 MA at 8800.
As you see, there are many timeframes, but all the values that need to be retested, and possibly act as a magnet to the BTC price, are among 8800 and 9000.
Since BTC is not showing any kind of strength, I believe a flash crash can happen or, in the worst of the cases, a consolidation to retest the 9k level that was never properly retested. The interval 10k-11k is still valid as an indication. Whatever the level that will be broken as first, it will tell us about the direction.
Spot Silver : Very long term BullishSpot Silver just upending earlier chart published few minutes back with Cup pattern which is indicating probable time frame to reach another level of all time high

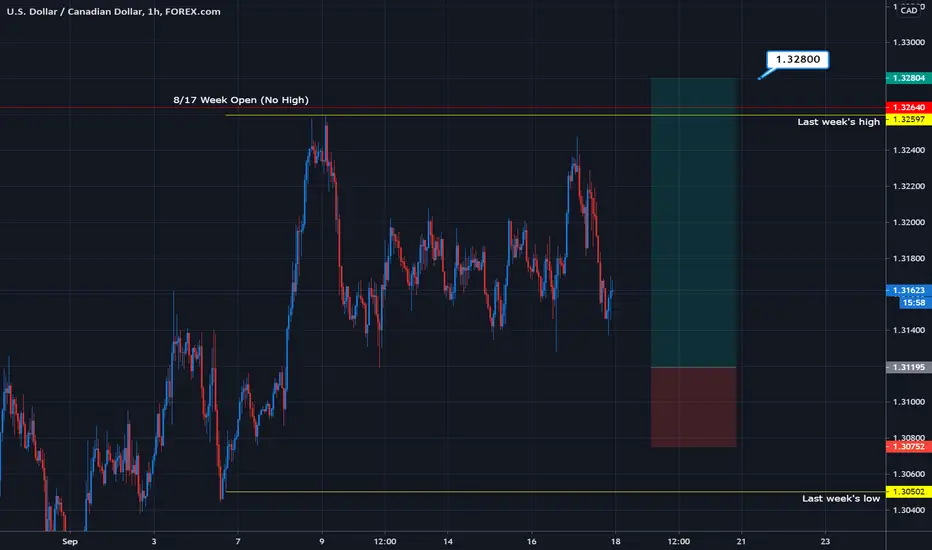
Dollar CAD - Manipulation TimeThe week of August 17, USDCAD had no high. Its open was its high. It then waterfalled down to under 1.30 before bouncing. That low was never revisited. After FOMC, I'd say everyone is expecting a quick return to bull and a quick return to dump town for the once-mighty USD.
I'd say they're right, but not before we see some good ol' fashioned manipulation.
Long a stop raid on anywhere around 1.312 for best results/RR. But we may not see such an opportunity since short sellers are trapped. Once the raid on 1.326 is complete, price will come down quickly and retail can quickly begin to buy the top on TSLA and APPL again, and that's where the real opportunities emerge.
Not that a 100 pip "scalp" isn't enough of an opportunity...
SNAP PT $28 or $19Market likes to create symmetry. Depending on which wave you think we are on, SNAP should either be making its way up to $28 or heading down to around $19 which is a major level of support. waiting for market action is a crucial part of this. For some reason, I anticipate this to not be the end of this insane run up before we crash.

Rebote de BTCSegún mis resistencias el BTC rebota en los precios que está ahora para lateralizarse o ya arrancar la tendencia alcista fuerte.
$WAVES WILL BE A POTENTIAL MOON BAG OF MINE FOR 2020-2021I'll be posting TA's with mainly different $ALTS on this account from now now.
Trying to make this an ALT coin STRICTLY account.
The more my followers grow the more content I'll be posting.
$WAVES breaking a 2 year resistance in coming days.
Updates on this post daily.

Importance of 350MA and 111MA. Predict start and end of bull runCrossover between these two signify starting of bull run and ending of bull run.
Another important insight from these two is that 350/111 = Pi
It has been accurate upto a week to predict starting of bull run and ending of bull run!!!

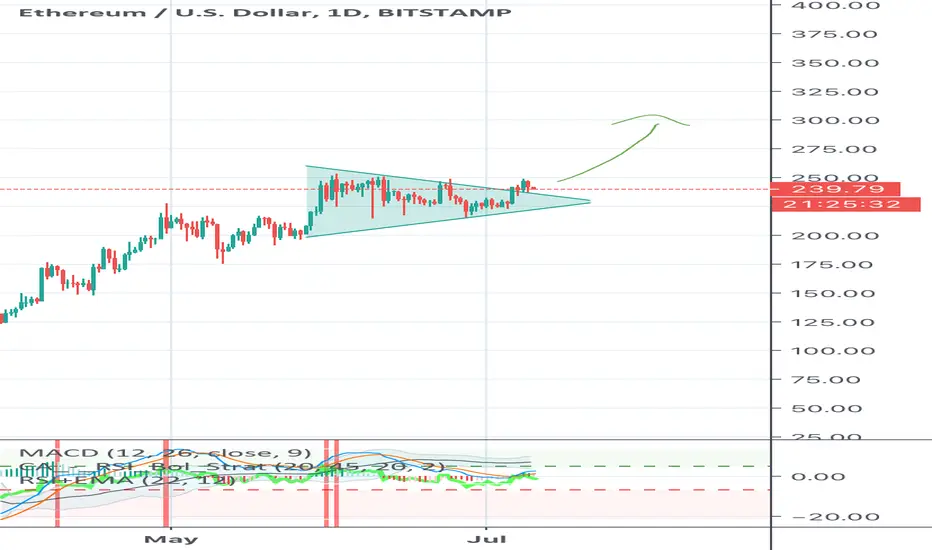
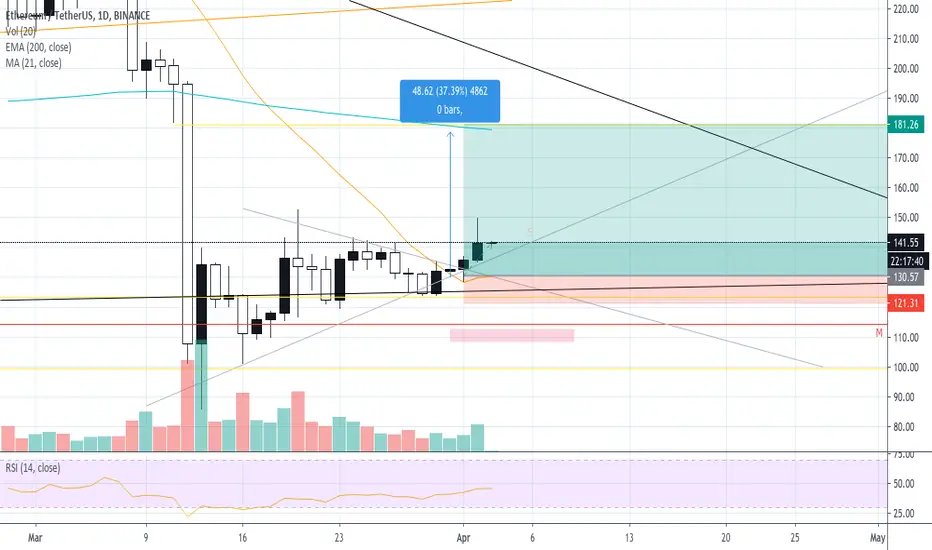
Etherium Breakout Classic Bullish Triangle pattern, with a nice bullish cross on the Macd. Should breakout before august to start the bull run. No price target, maybe back to all time highs or even higher??
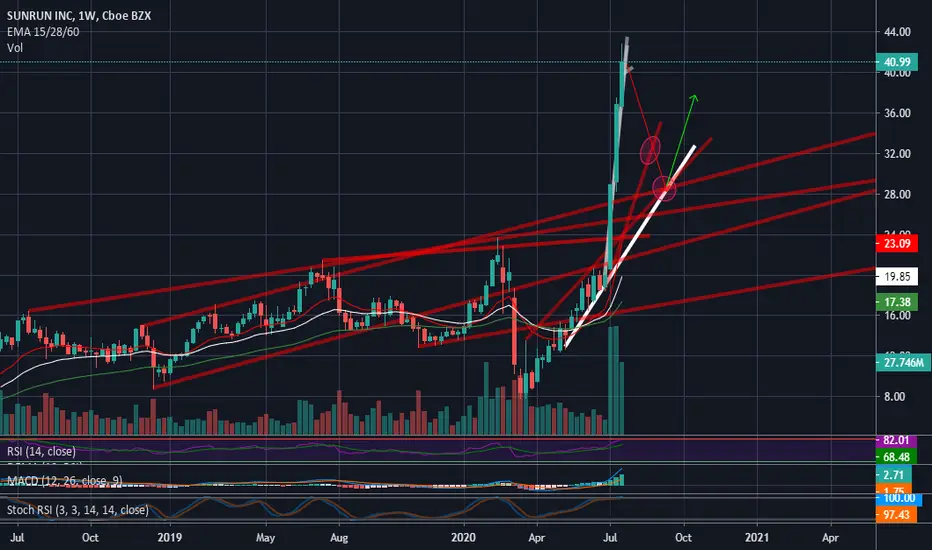
RUN BuyoutIt has just been announced that Sunrun (RUN) will be buying out another competitor solar company, Vivint Solar (VSLR) in a multi-billion dollar deal. RUN has been trading in a rising channel since the mid-March lows, and news of the acquisition may cause an upward breakout of the channel. In addition, the daily volume on RUN has been on a nice incline, and we may see a continuation of that throughout the week.

VSLR Long ideaI like the solar sector here. I own RUN. I think VSLR will breakout higher from this flat top resistance. Volume has been good and price is aligned above the supporting moving averages.

Breakout!Bitcoin broke downtrend resistance. Market buy btc. Consider loading up on bch/ether as well for alt coin portfolio.We are going to the moon

LOG Long Term Trendline SupportWe can see the long term support forming a channel with the overhead support from 20k ATH. We can see how a BIG MOVE IS SETTING UP...ON or before AUGUST 27th 2020.
Brian Brooks is having fun making the new crypto dollar everyone is expecting.
Your dollars are just digits on a screen...unless a blockchain application creates a new transparent world.
Imagine knowing exactly how many dollars there are!
Don't worry... Privacy coins still exist... but YOUR AMERICAN EXPRESS CARD tracks you anyways evertime you swipe...lol
Just wait until AMERICAN EXPRESS releases the BITCOIN REWARDS CARD!
welcome to the roaring 20s...
just need to destroy the swamp first...
enjoy.

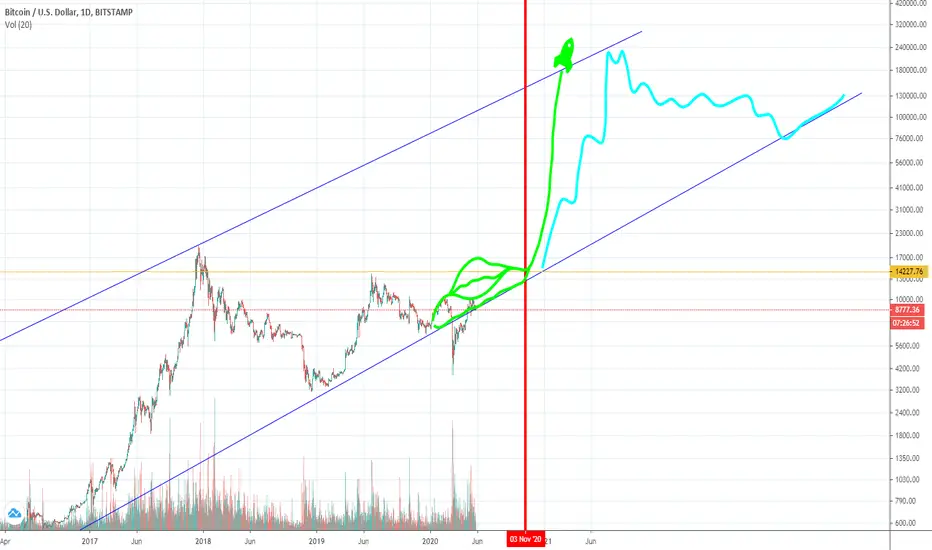
VIRUS was TREND ANOMALYI made this chart at the end of 2019, It has played out correctly....SHORT OF A VIRUS HAPPENING...
After the Election in the USA, we are likely to see the world change.
Odd are in the favor of FREEDOM...we'll see...
END OF DECEMBER 2020... BTC LONG TERM TRENDLINE will break ABOVE the JUNE 2019 recent HIGH...
AFTER THAT... WE SHOULD BREAK THROUGH 20K LIKE BREAKING THROUGH PUDDING.
EASY HYPERBOLIC JUMP TO 170K-200K!!!!!
THIS WILL CHANGE THE WORLD FOREVER.
And all the CRYPTO PROJECTS that are SECRETLY BEING CREATED RIGHT NOW...
Will MAGICALLY APPEAR... TO SELL YOU THEIR COINS AT HIGH TICKET PRICES...
Obvious STRATEGY...
Expect BIG CREDIT CARD COMPANIES TO ALL RELEASE THEIR CRYPTO REWARDS CARDS INSTEAD OF TRAVEL CARDS.
Dollars, Mortgages, Interest Rates, Worldwide Commerce, WILL ALL CHANGE.
hopefully we build FREEDOM, and not TYRANNY.
USE CRYPTOS FOR GOOD, not evil.
#NIFTY - Continuationin my last idea, I clearly said this up move is nothing but a dead cat bounce! we are heading lower whether you like it or not
now we finally broke the rising wedge & if you zoom out a lot worse is to come!!! BE PREPARED!!!

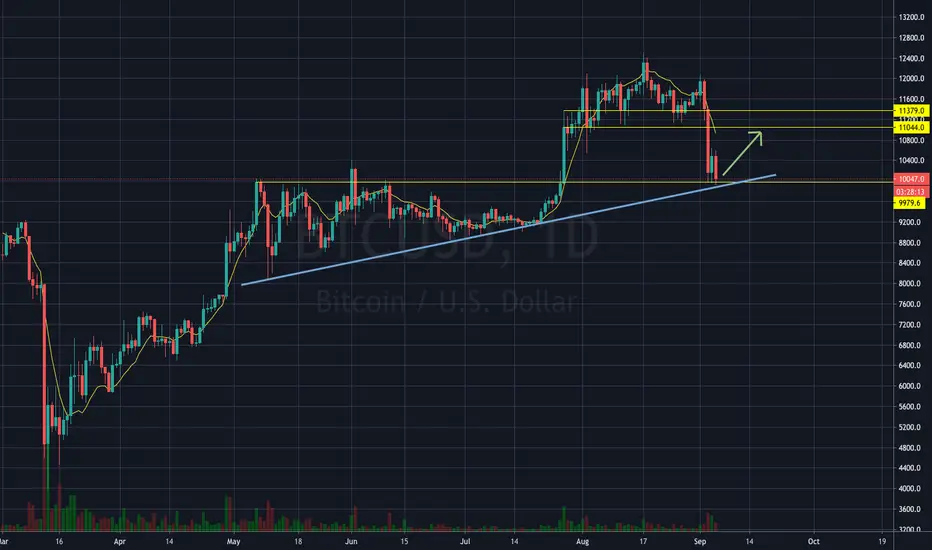
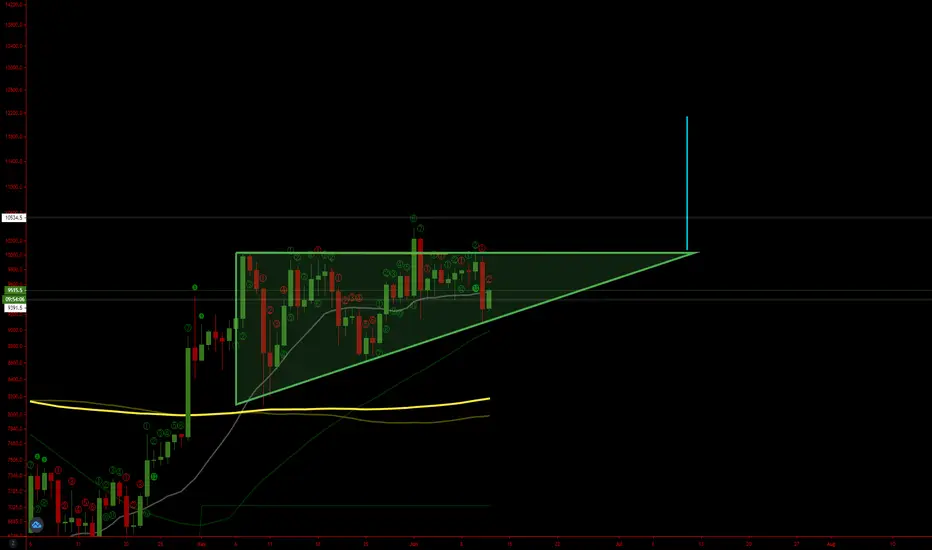
The Perfect StormSee each of the trends of 6 Green weeks in a row (Circled). Each of these patterns precedes a period of rapid growth, but there are other signs we're in for a take-off.
-We're reaching the end of our symmetrical triangle
-The halving is approaching
-Central Banks around the world are injecting cash in bulk. Causing
inflation, and pushing more and more savvy investors into Crypto.

Can we continue the actual bitcoin run?Hey Altsignals Members, as update for the last swing trade in our BitMex channel and public one, we need to make some quick and small updates.
1/ Price perfectly bounce around our entry zone and 0.5 fibonacci level.
2/ We're above 400% profits if u take an entry below the 8600 level (Signal was sent at 8540)
3/ On the hourly chart we're trying to break a parallel resistance, which is around 8930$. Only after break and create candles above the 8900 level in the hourly chart, we will see a bullish continuation.
So, keep your eyes open for a possible rejection of the current level, which could be the start for a ride into the 7200 & 7500 zone.
ATM we stay bullish taking adventage from our perfect entry.
Currrent Stop loss at TP1 ($8650)
Current support at $8850
Current resistance and possible breakout point in short term, above 8950 and 9050.
