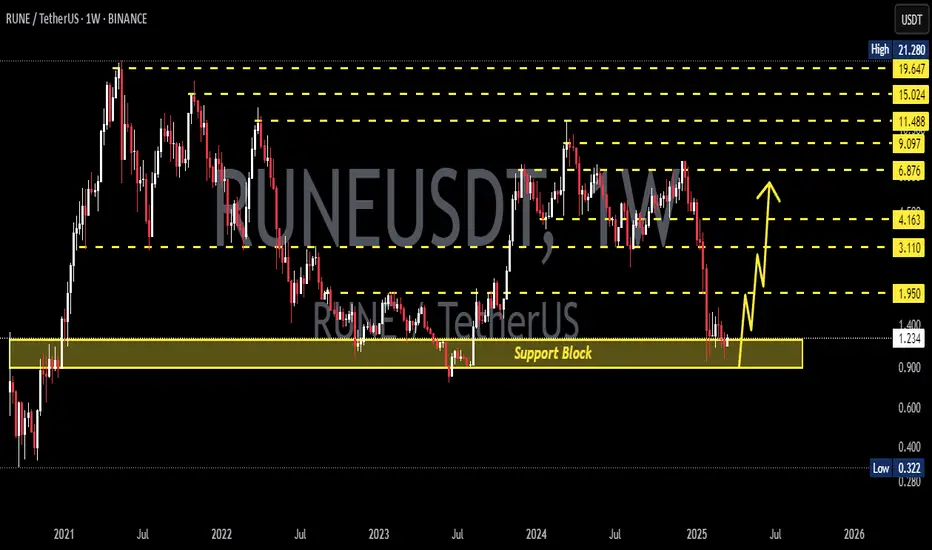
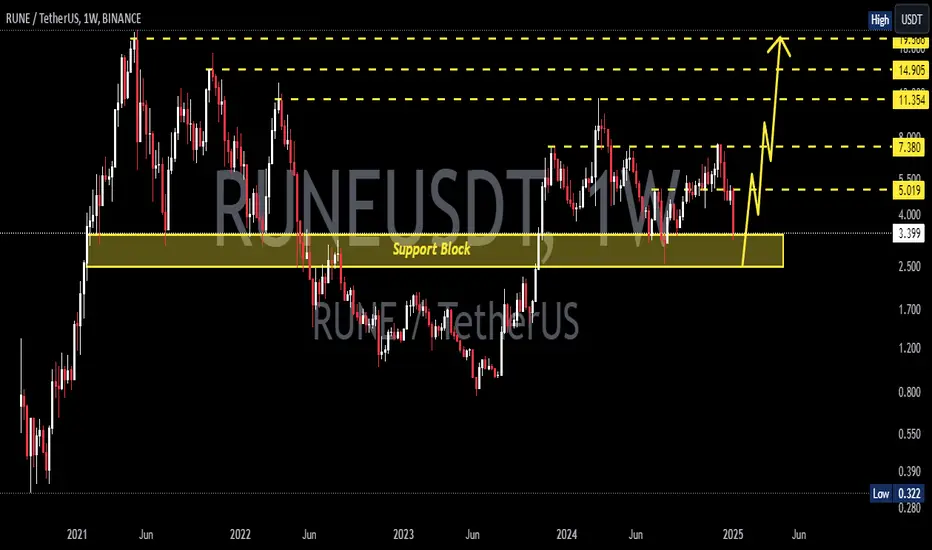
RUNE at the Brink: Rebound Opportunity or Breakdown Incoming?🧩 Overview:
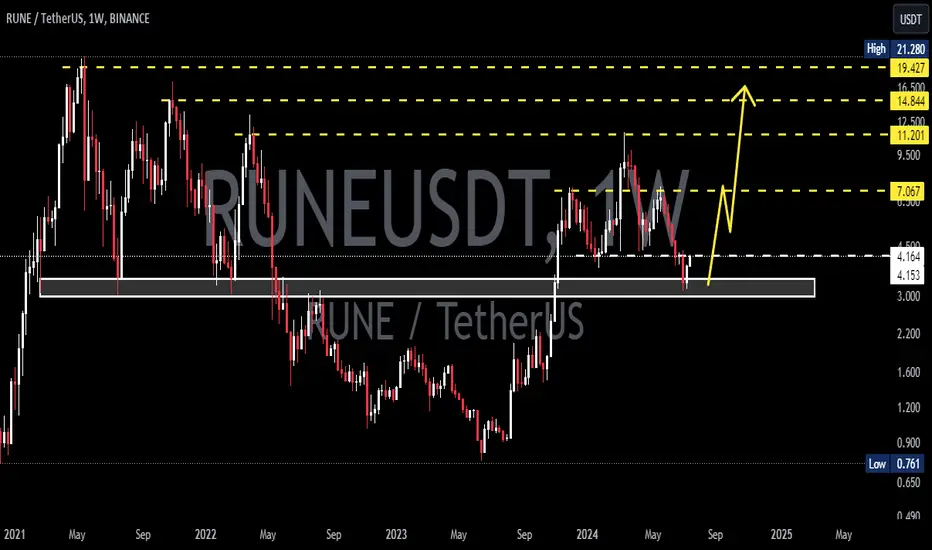
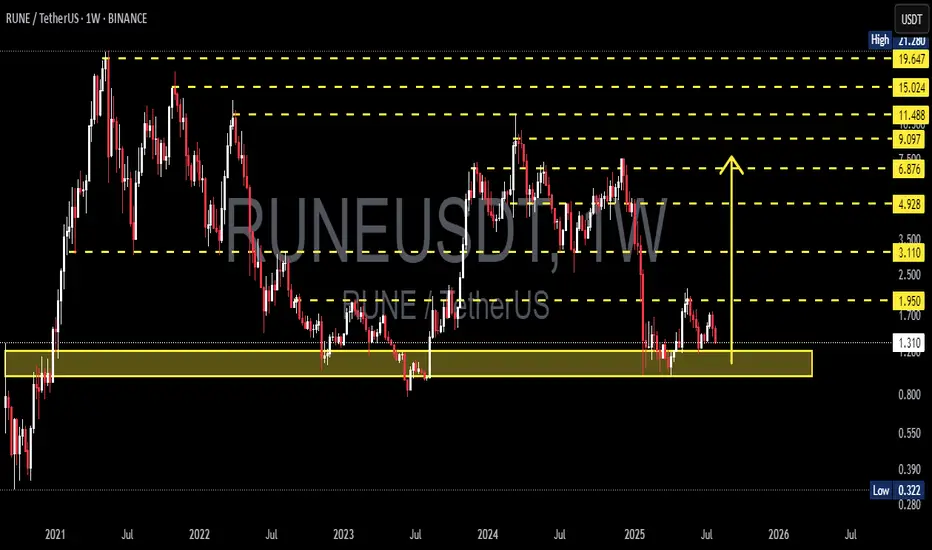
RUNE/USDT is currently hovering at a critical support zone — a historical demand area that has triggered strong bullish rallies in the past. Positioned between $1.00–$1.30, this level has been a battle ground between buyers and sellers. The big question now: Will RUNE bounce for a bullish reversal or break down into deeper lows?
---
🔍 Key Levels Identified:
Major Support Zone (Demand Area): $1.00 – $1.30 (yellow box)
Immediate Resistance: $1.95 → $3.11 → $4.92
Extended Bullish Targets: $6.87 → $9.09 → $11.48 → $15.02
Deeper Bearish Targets (if support fails): $0.80 → $0.55 → $0.32
---
🟢 Bullish Scenario (Recovery Rally):
📌 Key Signal: Strong hold and price reaction above the $1.00–$1.30 zone.
1. Reversal Patterns: Look for double bottom, bullish engulfing, or strong weekly pin bars to signal a potential reversal.
2. Momentum Confirmation: A breakout above $1.95 with high volume could trigger a strong continuation to $3.11 and $4.92.
3. Macro Tailwinds: A broader recovery in Bitcoin and the crypto market could enhance bullish pressure on altcoins like RUNE.
🎯 Mid to Long-Term Bullish Targets:
$3.11 → $4.92 → $6.87+
Potential upside of 200–400%+ from current levels if bullish structure confirms.
---
🔴 Bearish Scenario (Breakdown):
📌 Critical Risk: Weekly candle close below $1.00 with volume confirmation.
1. Support Breakdown: If $1.00 fails, price may revisit previous lows around $0.80 or even test historical demand levels at $0.32.
2. Bearish Continuation Pattern: Sustained lower highs and lower lows suggest downtrend continuation unless invalidated.
3. Volume Pressure: Heavy sell volume on breakdowns reinforces bearish bias.
⚠️ Bearish Targets: $0.80 → $0.55 → $0.322 (historical low)
---
🔄 Pattern & Structure:
Historical Accumulation Zone: The yellow box has been a long-term accumulation area since 2021.
Repeat Behavior: Previous touches to this zone sparked multi-week rallies.
Potential Wyckoff Accumulation: If price forms a sideways range with rising lows, this may be the early stage of a markup phase.
---
🧠 Strategic Outlook for Traders:
✅ Bullish Strategy:
Conservative entry: Wait for breakout + retest of $1.95
Aggressive entry: Accumulate within $1.00–$1.30 zone with tight stop below $0.98
❌ Bearish Strategy:
Short setup on confirmed breakdown below $0.98
Avoid trading without confirmation of direction (no FOMO)
---
🚀 Conclusion:
RUNE is standing at a make-or-break level — a tipping point between a bullish breakout or further bearish pressure. Smart traders don't just predict direction; they prepare for both outcomes. This is not just a technical zone — it's the market’s decision point.
#RUNE #RUNEUSDT #CryptoAnalysis #AltcoinWatch #BreakoutSetup #DemandZone #TechnicalAnalysis #CryptoOutlook #BullishScenario #BearishScenario #Wyckoff
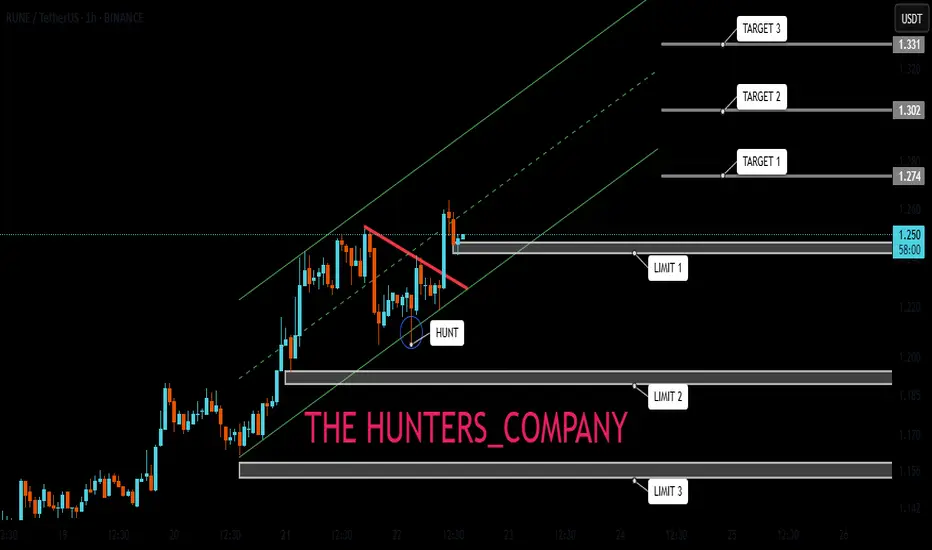
Runeusdtlong
RUNE : Ready to pump?Hello friends🙌
👀According to the price drop, you can see that the price has reached an important area, which, according to the pattern formed, if the specified resistance is broken, we can enter with risk and capital management and move to the specified targets.
🔥Follow us for more signals🔥
*Trade safely with us*
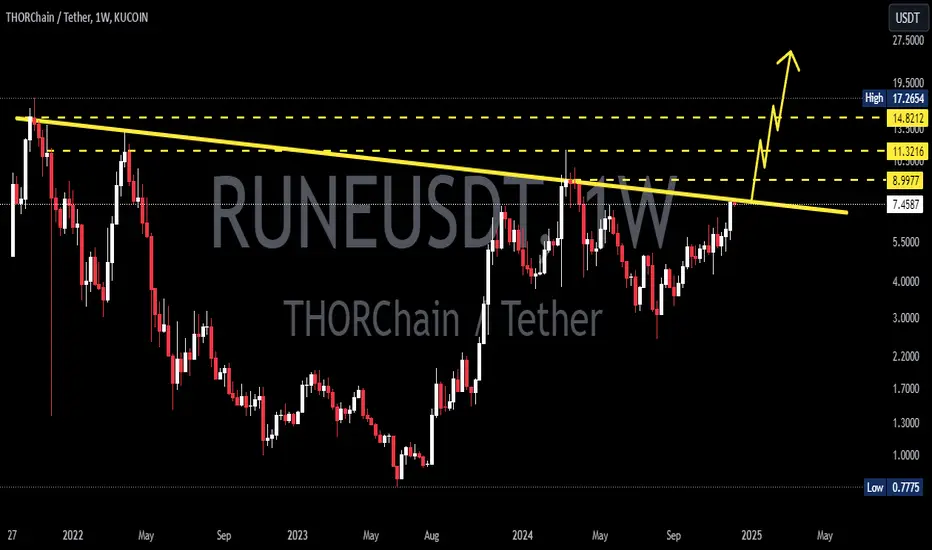
RUNEUSDT 1W AnalysisRUNE ~ 1W Analysis
#RUNE Buy back gradually from here with a short term target of at least 20%+ from this support block.

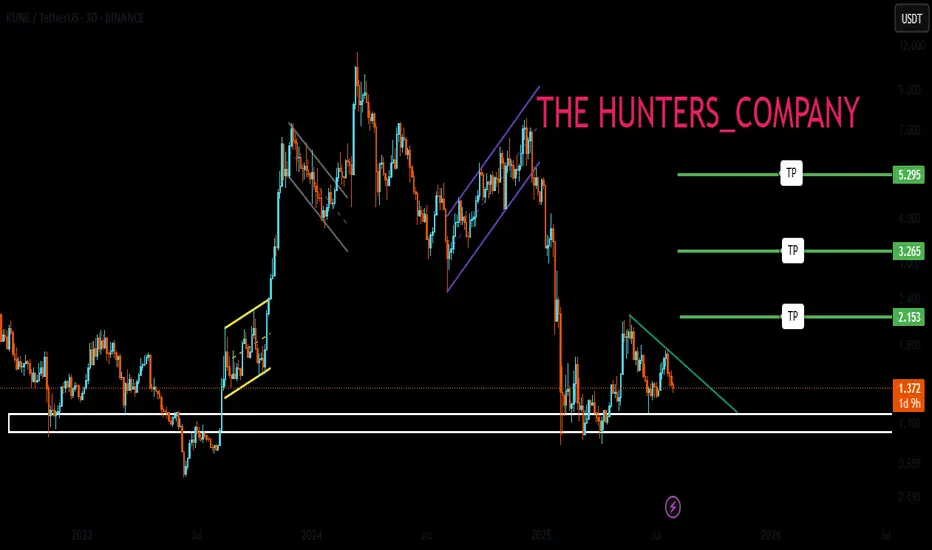
RUNEUSDT Breakout and Bull Flag Forming!!After nearly three months of tight consolidation, BINANCE:RUNEUSDT has finally broken out of its range-bound “box” structure. a powerful sign that the market is ready to move. This type of breakout often signals the end of indecision and the start of a strong directional trend.
What makes this setup even more exciting is the formation of a bull flag pattern right after the breakout. Known as a classic continuation pattern, the bull flag usually signals that the asset is simply pausing before its next leg up. The tight pullback within the flag is showing low-volume correction. A bullish sign that buyers are still in control.
With this confluence of a range breakout followed by a bull flag, BINANCE:RUNEUSDT is flashing all the signs of a potentially explosive move to the upside. However, it’s important to stay disciplined – always manage your risk and keep stop losses in place below the flag structure or previous support levels.
Next move could be strong. Stay sharp and ride the wave!
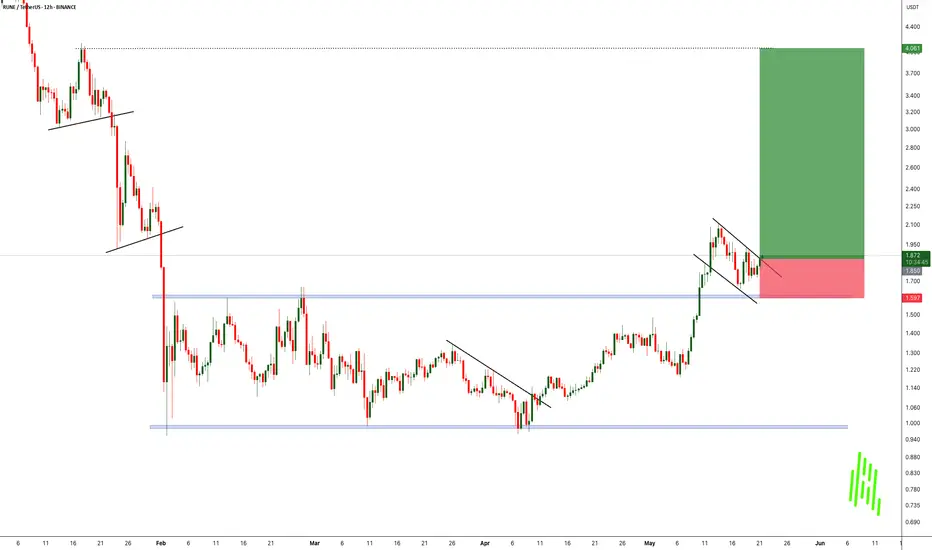
BINANCE:RUNEUSDT Currently trading at $1.87
Buy level : Above $1.86
Stop loss : Below $1.6
Target 1: $2.2
Target 2: $3
Target 3: $4
Max leverage 3x
Always keep stop loss
Follow Our Tradingview Account for More Technical Analysis Updates, | Like, Share and Comment Your thoughts
RUNE/USDT : BUY LIMITHello friends
Given the growth in price and the entry of buyers, now that the price is in the ascending channel, we can buy in stages and with risk and capital management and move towards the specified goals.
*Trade safely with us*
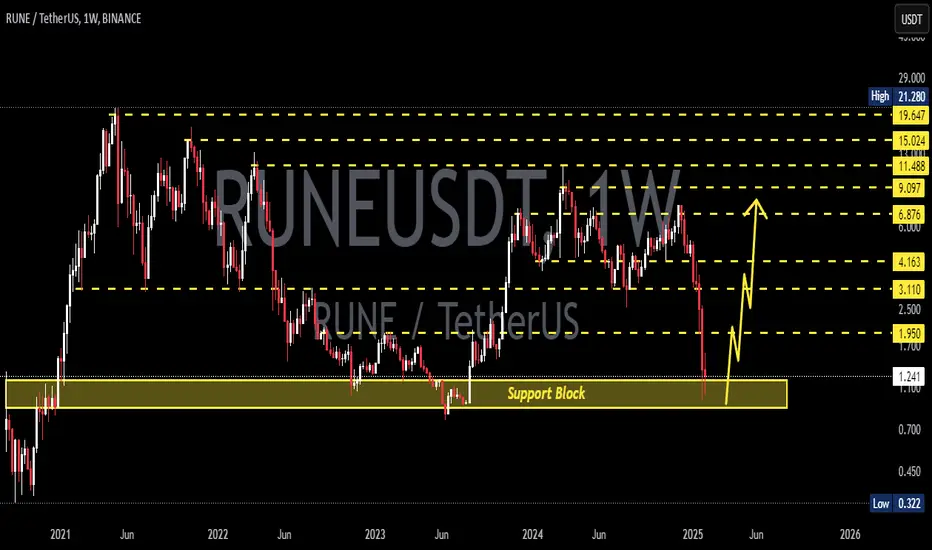
RUNEUSDT 1WRUNE ~ 1W Analysis
#RUNE Buy gradually from here with a short -term target of at least 20%+.
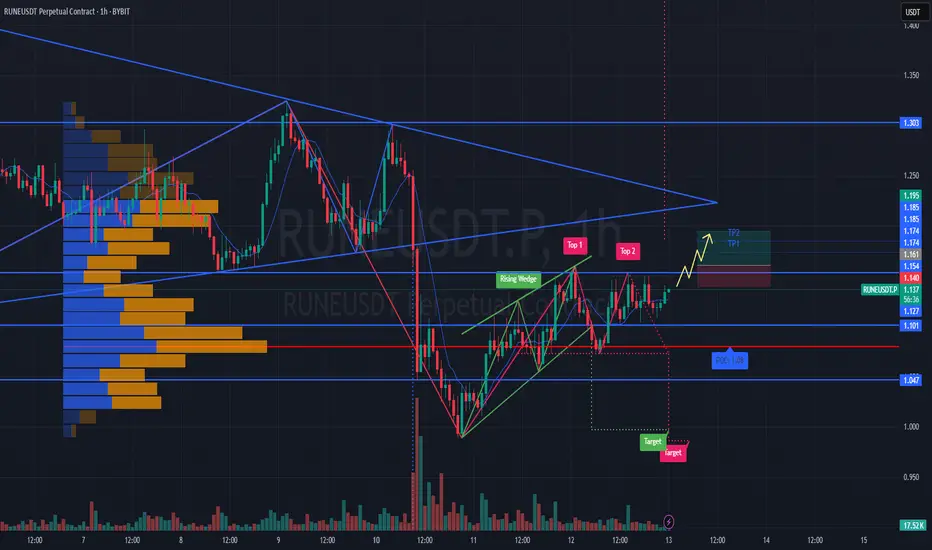
#RUNEUSDT is showing signs of growth📈 Long BYBIT:RUNEUSDT.P from $1.161
🛡 Stop loss $1.140
🕒 1H Timeframe
⚡️ Overview:
➡️ The main POC (Point of Control) is at 1.08, indicating the area with the highest trading volume.
➡️ The 1.154 level acts as a local support, as the price previously bounced from this zone.
➡️ The volume and market profile highlight areas of high trader activity, especially in the 1.100 – 1.161 range.
🎯 TP Targets:
💎 TP 1: $1.174
💎 TP 2: $1.185
💎 TP 3: $1.195
📢 Monitor key levels before entering the trade!
📢 If 1.140 is broken downward, the trade may be invalidated.
📢 If the price holds above 1.161 and continues rising, the bullish momentum remains intact.
BYBIT:RUNEUSDT.P is showing signs of growth — expecting further upside movement!
RUNEUSDT: The Unstoppable Breakout? Eyes on the Resistance!BINANCE:RUNEUSDT has been showing remarkable strength while the broader market struggles, repeatedly holding support and now pushing towards a key resistance level. This consolidation phase suggests a potential explosive move ahead. A breakout above this major resistance could trigger strong bullish momentum, making BINANCE:RUNEUSDT unstoppable in the short term. Volume confirmation will be crucial, as increasing buying pressure could validate the breakout and fuel further gains. However, risk management is essential false breakouts are always a possibility, so setting a stop loss just below recent support levels is key to protecting capital. All eyes are now on the breakout level. if BINANCE:RUNEUSDT clears it with conviction, it could be a high-potential trading opportunity. Trade smart, stay disciplined, and always keep your stop loss in place.
BINANCE:RUNEUSDT Currently trading at $1.41
Buy level: Above $1.4
Stop loss: Below $1.1
Target : $4
Max Leverage 3x
Always keep Stop loss
Follow Our Tradingview Account for More Technical Analysis Updates, | Like, Share and Comment Your thoughts

RUNEUSDTRUNE ~ 1W Analysis
#RUNE Buy gradually from here if you still have a Conviction on this Coin with a minimum target of 20%+.
THORChain Convert Debt into Equity: What about RUNE Holders FateTHORChain ( CRYPTOCAP:RUNE ) has taken a bold step to address its $200 million debt crisis by converting unserviceable debt into equity through a new token, TCY (Thorchain Yield). This strategic move follows the suspension of THORFi services on January 23, 2025, due to financial instability. While this decision aims to stabilize the ecosystem, the market response has been mixed, with CRYPTOCAP:RUNE experiencing sharp volatility.
THORChain’s Debt-to-Equity Move
The newly introduced TCY token will be issued at a rate of 1 TCY per dollar of defaulted debt, effectively turning affected lenders and savers into equity holders. To further support this transition, THORChain plans to create a RUNE/TCY liquidity pool with an initial $500,000 backing, pricing TCY at $0.10 per token. Additionally, TCY holders will receive 10% of THORChain’s revenue indefinitely, providing a long-term recovery mechanism.
Despite these efforts, concerns linger regarding the timeline for full financial recovery. However, THORChain’s core functionality—cross-chain swaps—remains intact, ensuring continued utility for its users. Market sentiment, however, reflects uncertainty, as seen in CRYPTOCAP:RUNE ’s price action.
Technical Outlook: Can CRYPTOCAP:RUNE Recover?
Following the debt-to-equity announcement, CRYPTOCAP:RUNE has exhibited mixed performance. Initially, it plunged 10% within 24 hours, extending its 30-day decline to nearly 50%, in line with the broader market downturn. However, as of the latest data, CRYPTOCAP:RUNE is showing signs of recovery, posting an 11% gain and trading within a moderate zone.
Key Levels to Watch:
- Relative Strength Index (RSI): Currently at 38, indicating potential oversold conditions and a buying opportunity.
- 38.2% Fibonacci Retracement Level: The $3.58 price mark aligns with this critical resistance; a breakout above this level could fuel a bullish rally.
- 1-Month High Target: If momentum sustains, CRYPTOCAP:RUNE could push towards $5, the next major resistance level.
Conclusion
THORChain’s move to convert debt into equity is a double-edged sword. While it provides a structured approach to managing financial challenges, investor confidence remains uncertain. The success of the TCY token will heavily influence market sentiment around CRYPTOCAP:RUNE in the coming weeks.
As the market digests this pivotal restructuring, all eyes remain on CRYPTOCAP:RUNE ’s price action and the effectiveness of THORChain’s recovery strategy.

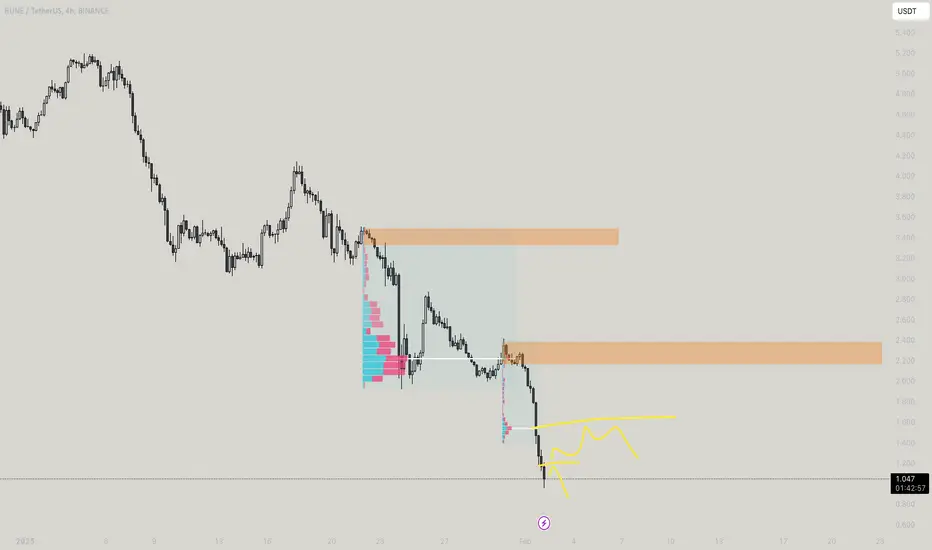
Will RUNE collapse like LUNA?Well bad news for rune, good news for all shorters, Collapse if non likely as of now, but i hope you dont collapse catching a falling knife
RUNEUSDT 1WRUNE ~ 1W
#RUNE If you still have Conviction on this coin,. This support block would be a very good buying place for now,. Minimum Target 20%++
RUNEUSDT 1WRUNE ~ 1W
#RUNE Buy gradually after breaking through this resistance line. with a minimum target of 20%+. The break of this resistance line confirms further bullish
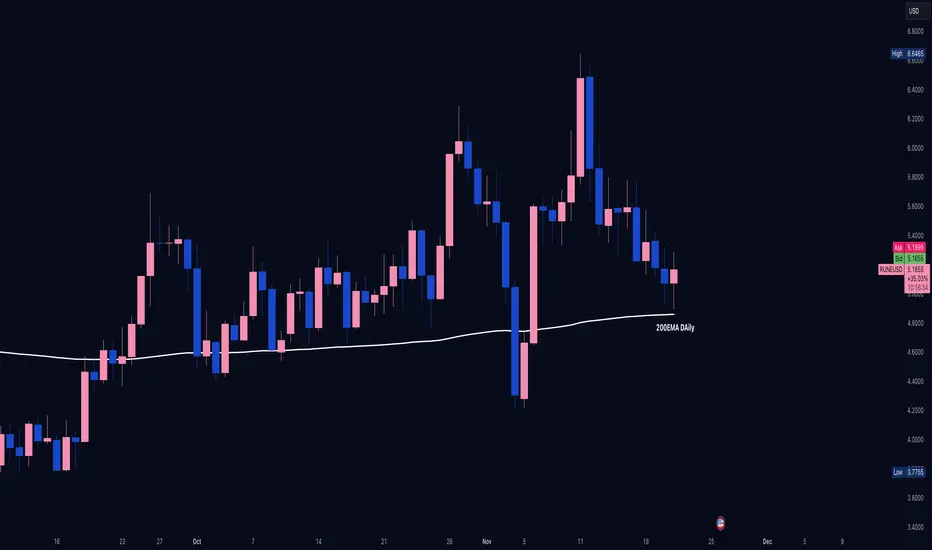
Crypto RUNEUSD. Trade I took long 1hr ago. Lined up on the Daily
Thought I would briefly describe this long trade i entered in RUNEUSD about an hour ago. Volume levels are about average for Crypto, it is now aligned perfectly on the 2ooEMA Daily.
Price has moved back on me a bit. But I think it might go okay from here,
📈RUNE can go high to $40 level / Alt Season rally📉BINANCE:RUNEUSDT
KRAKEN:RUNEUSD
Hello Traders
Rune is one of my suggestions for the altcoin market.
You can clearly see that volume has increased continuously. ---> Highly potential for the alt rally season.
RUNE is the native token of the THORChain network. It represents a multi-purpose universal token that supports all functions on the THORChain network and helps run the protocol. RUNE is used in governance, for staking, bonding for validator Nodes, and trading.
The best strategy for altcoins is to allocate a certain percentage of assets (for example, 10% of the total portfolio) to buy potential altcoins.🎲

2 ALTCOINS in 2 MINUTES | AAVE & RUNE | Great UpsideTwo altcoins in under two minutes - each with a bright future and good-looking upside potential.
BINANCE:AAVEUSDT
AAVE might e heading back to retest a crucial support zone, in other words - you could get a cheaper entry. A good place to look for potential buy zones, is on the moving averages in the daily. The price is on the right-hand panel, and indicates possible bounce zones:
BINANCE:RUNEUSDT
RUNE is slightly more advanced in the bullish cycle, forming higher highs after retesting the key support. There is still a major upside potential. Ultimately, the earlier / lower you buy, the better (unless you are a swing trader or scalp trader).
Either way , many altcoins will begin to pick up now that BTC is trading sideways.
______________________________

$RUNEUSDT: Ready to Break Out! BINANCE:RUNEUSDT has recently broken out of its downtrend and is now forming a symmetrical triangle, signaling a potential breakout that could lead to a significant upward movement. The fundamentals behind CRYPTOCAP:RUNE are strong, supported by a dedicated community, which adds to its long-term potential. Traders should keep an eye on the breakout from the triangle, as this could ignite a major price surge. As always, remember to set a stop loss to manage risk effectively while taking advantage of this exciting opportunity.
BINANCE:RUNEUSDT Currently trading at $5.2
Buy level: Above $5.25
Stop loss: Below $4.38
TP1: $5.7
TP2: $7
TP3: $9
TP4: $11
Max Leverage 3x
Follow Our Tradingview Account for More Technical Analysis Updates, | Like, Share and Comment Your thoughts
Targeting $20: RUNE’s Path to SuccessI had to create another post on RUNE because the last one got super messy with the entries at $3.23. CRYPTOCAP:RUNE
I wanted to highlight the strength it will have once it pushes above the moving average and starts printing blue candles. The last time it did that, it pulled a 7x, and this time I’m aiming for $20 as my first target.
The weekly chart is also active and could go berserk if it manages to close above the moving average and stay there.
I’m adding on dips and holding until BTC peaks around October next year... hopefully! tradingview.sweetlogin.com
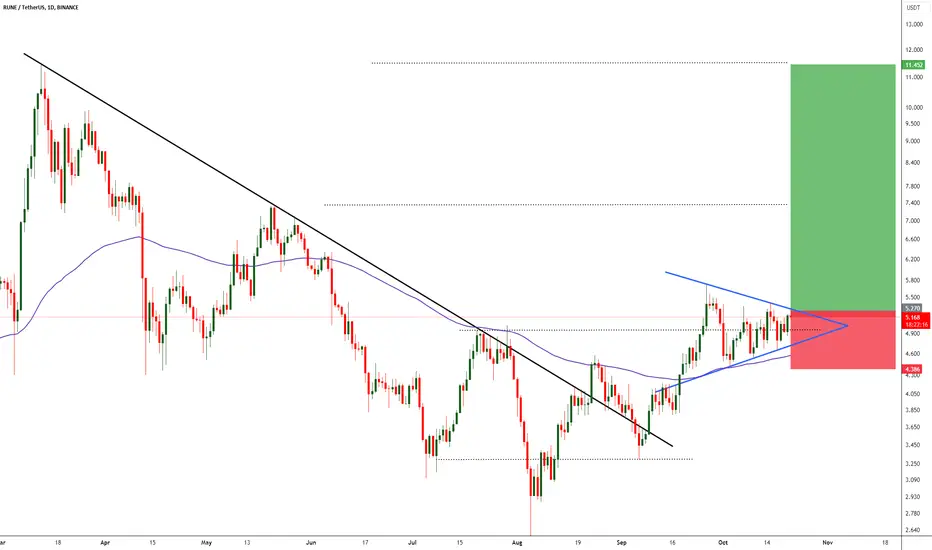
#RUNE/USDT#RUNE
The price is moving in an ascending channel on the 1-day frame and is sticking to it very well
We have a bounce from a major support area in green at 2.80
We have a downtrend RSI that has been broken upwards which supports the upside
We have a trend to stabilize above the 100 moving average which supports the upside
Entry price 4.00
First target 5.20
Second target 6.28
Third target 7.75
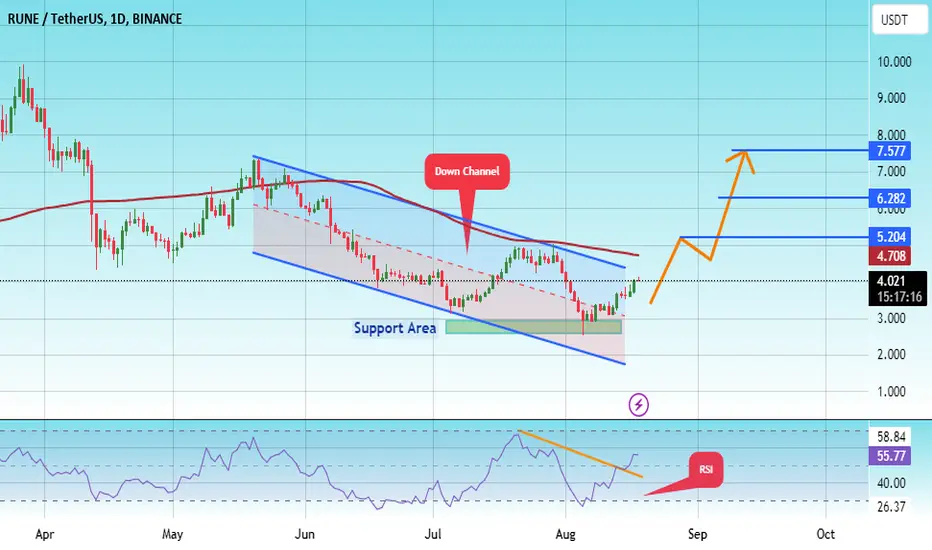
Rune (Thorchain) - DCA, the bottom is nearRune - the fundamentals looks super super strong.
Streaming swaps, new chains and exchanges make Rune grow in a rapid pace.
If you still think we are in a bull market and believe in Rune... this could be a great time to DCA into Rune.
I see Rune 3.00-3.65 dollar as a gift and probably the last time we see Rune so cheap
We have 0.5 fib level at 3.56 to watch out for.

RUNE/USDT FORMING BULLISH SETUPRune/usdt is forming my favourite setup as so can see on chart, my buying zone is always below liquidity and in FVG or demand zone but this time its FVG+DEMANDZONE. We can see good reversal from that point.

RUNE...RUNE will never disappoint you.
The same fractal pattern is likely to be followed. The BTC pair is very strong, and its USDT pair is amazing too.

RUNEUSDT 1WRUNE ~ 1W
#RUNE Looks like the decline is over.
Bulls managed to defend this support Block and are now trying to break the local resistance Line here.