21% Potential in Russian Bear!AMEX:RUSS
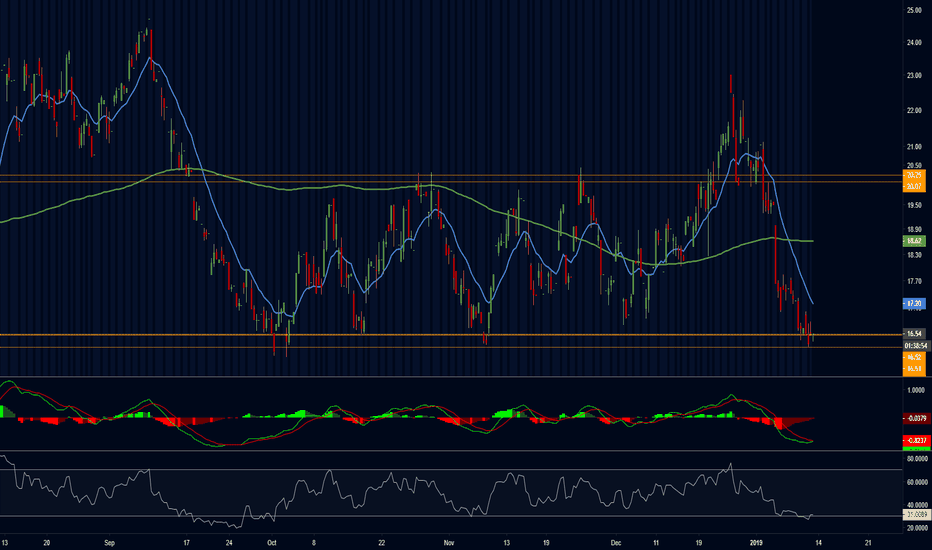
21% Potential in Russian Bear!
Entry now if you're a bit more aggressive or
Entry after signs of higher highs and higher lows above blue EMA (15) line
2% Stop loss
MacD showing signs of reversal
RSI below 40
Russia
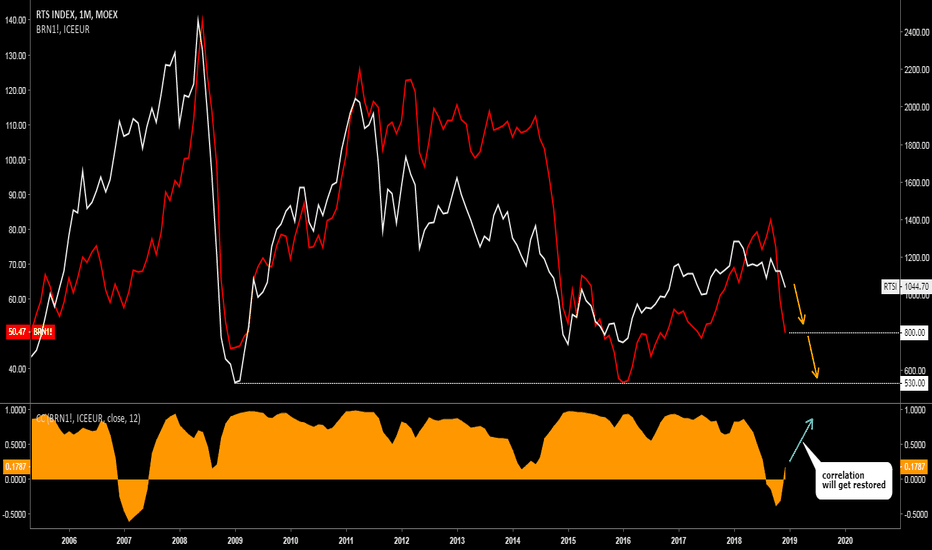
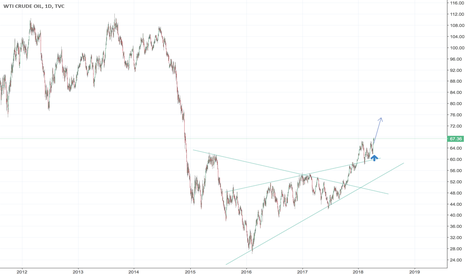
RTS index could drop to 800-530 following the Brent crudeThere will be no miracle. Less revenues from falling oil market will drag the index lower
as it should be around 800 already and could hit 530 when the oil would retest a multi-year low.
The correlation index for the past 12 months shows negative correlation but it is a temporary situation
as on the longer periods (20+ months) it is positive.
This will change gradually when the index will catch up with a falling "knife" oil.
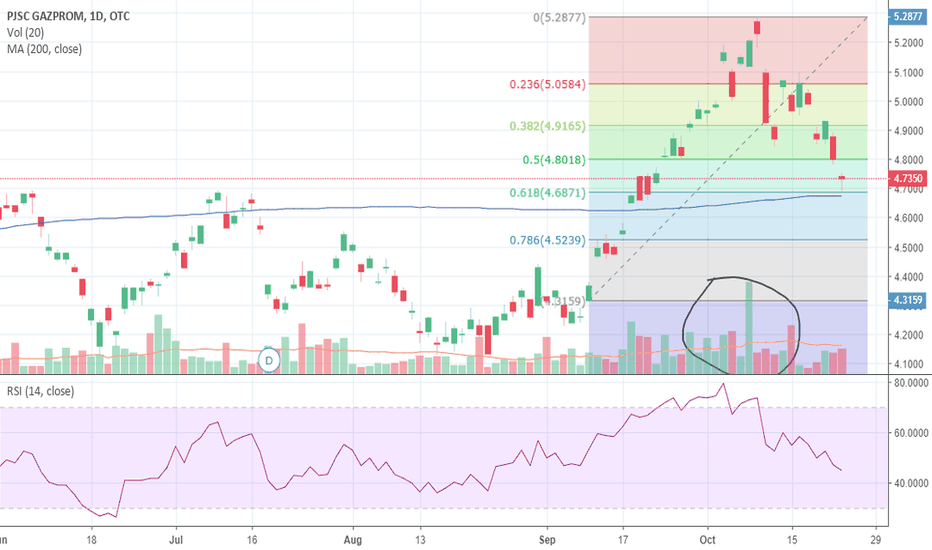
GAZPROM steps on the gasThis a clear buy for me.
It quickly went to the .618 of the last up trend, which was at the same level than the MA200.
AND BOUNCED.
Also look at the volume on bullish vs bearish days.
Buy buy buy.
How to date a Victoria Secret model. Description: Remember when Macklemore had the #1 raprecord? I dont.
Timeframe ~3 days
Indicators used: 0.123 x 29.53 = 3.63 days since New Moon.
Shout outs: Them 6 white speakers at Jackson Palmers latest speaking gig.
* Bull scenario if this dont break down here.
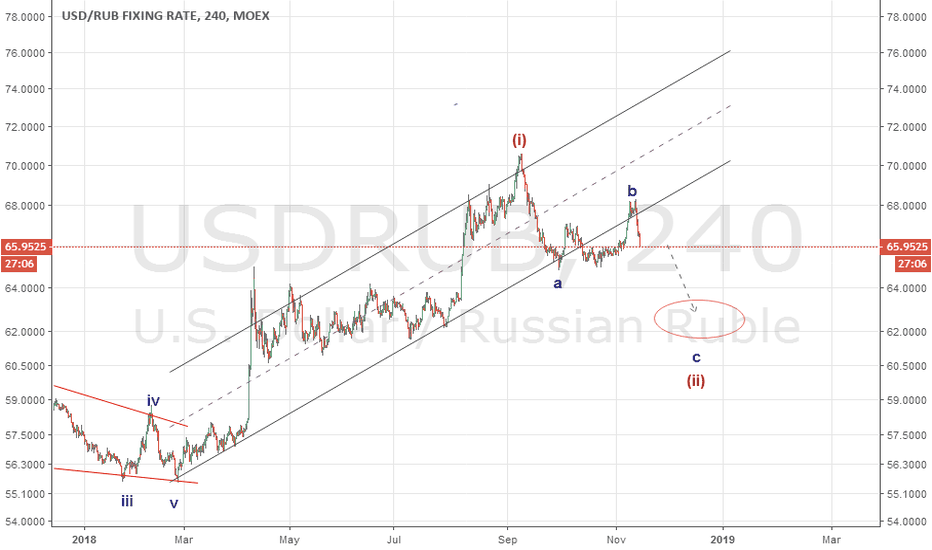
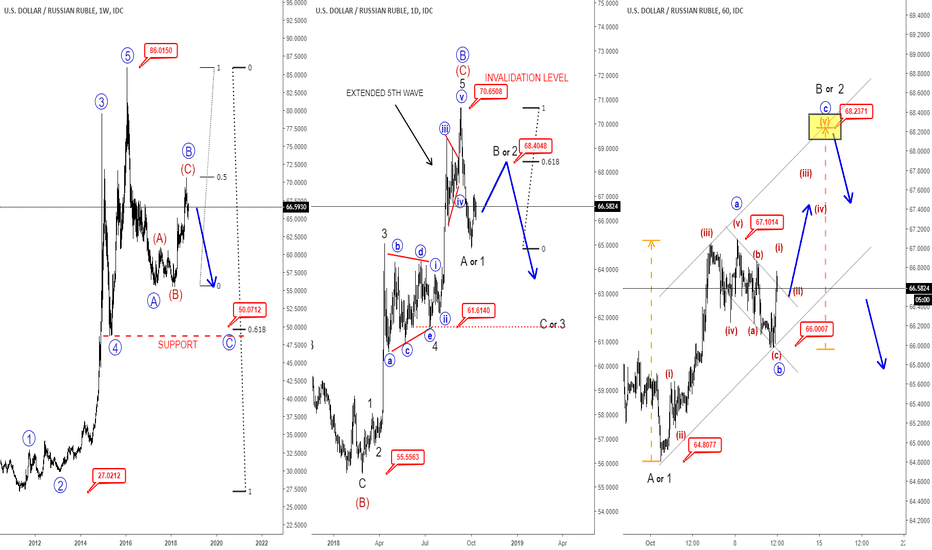
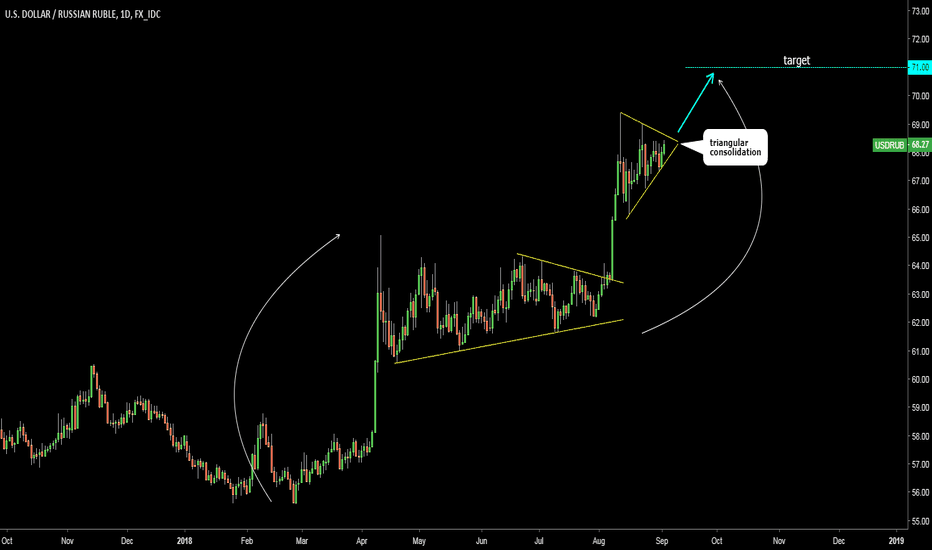
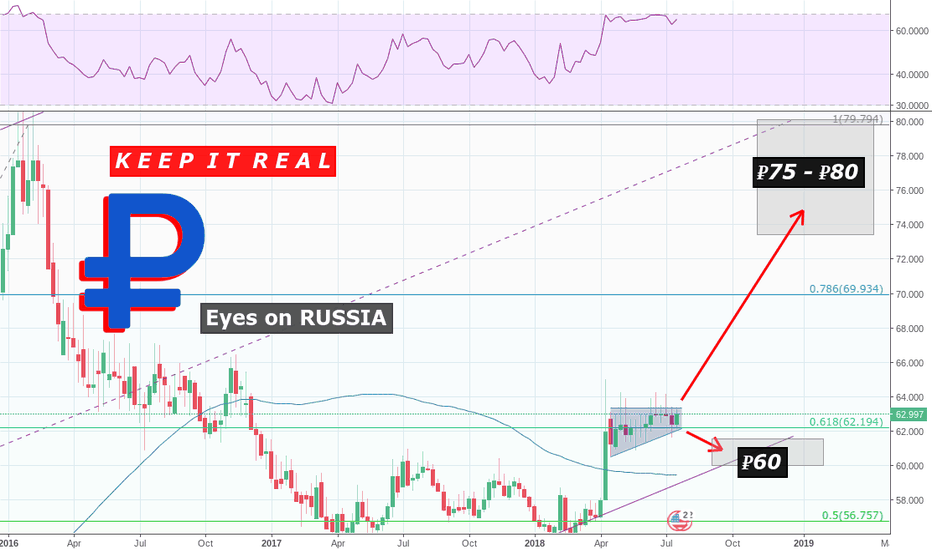
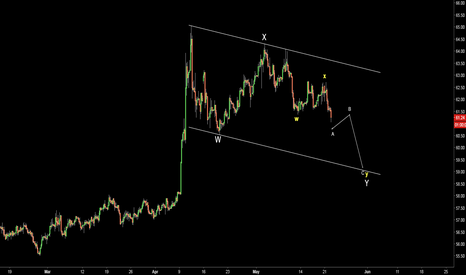
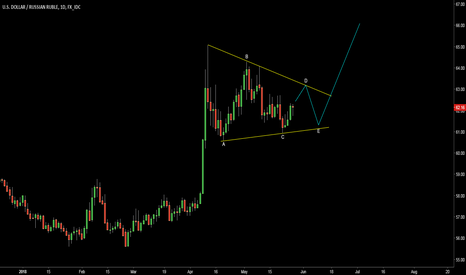
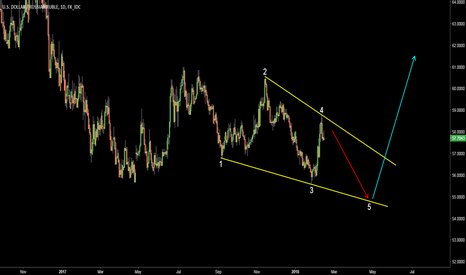
EW ANALYSIS: Long-term And Short-term View On Russian RubleHello traders!
Today we will talk about pretty clear Russian Ruble. From a technical perspective, we see very interesting price action and wave structure based on Elliott Wave theory.
Let's start with Weekly chart:
In EW theory, after every five waves, a three-wave correction follows and as you can see, USDRUB is turning down after five waves up. So, we can expect at least three waves A-B-C of decline where wave C is still missing, which means that strong Russian Ruble can be coming in the next few weeks/months.
Daily chart:
Looking at the daily chart we can see an impulsive five-wave rally within wave (C) of B, so seems like USDRUB has completed a flat correction and found a resistance at 70.65 level, especially because of a current sharp and impulsive decline into wave A/1 away from highs. So, what we expect now is minimum three waves of decline at least back to 61.61 area, A/1 - B/2 - C/3.
Intra-day hourly chart:
At the hourly chart, we can see a very nice bounce away from A/1 lows with five waves up and three waves of pullback, which means that wave B/2 can be underway and should be made by three waves a-b-c, where wave c is still missing and can be reached around ideal 61,8% Fibonacci retracement and 68 area.
However, we want to say that Russian Ruble can be strong in the upcoming year, so we decided to share our view, just keep in mind that this may become more complex, so as long as it's trading below 70.65 invalidation level, we will remain bearish!
Disclosure: Please be informed that information we provide is NOT a trading recommendation or investment advice. All of our work is for educational purposes only.
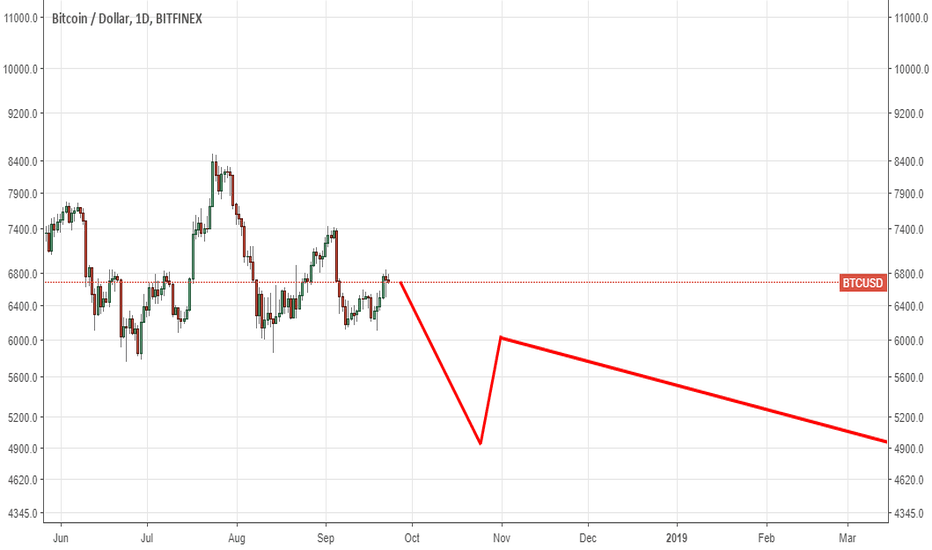
Bitcoin price goes up during WORLD CUP MATCHIs it weird that the price of Bitcoin went up during the first match of the FIFA World Cup in Russia? This was a perfect opportunity for whales to make heaps of money while many people around the world weren't paying attention to their investment.
What are your thoughts?
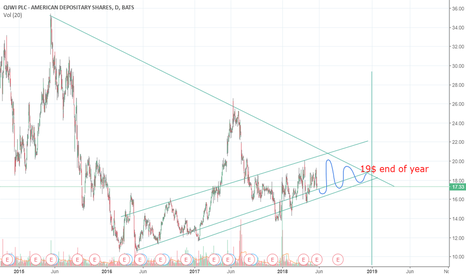
QIWI linear forecast end of year 19$My opinion about QIWI stock for until the end of the year.
Conservative, but realistic.
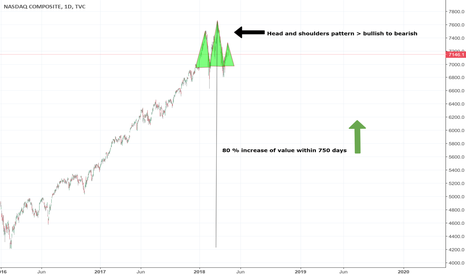
TREND REVERSAL? Nasdaq is forming a head and shoulders pattern!This year has been a wild ride for the Nasdaq and it seems this is just the beginning!
After a strong bullrun for the last 750 days the market is cooling down.
Political uncertainty (Syria, North Korea and the ongoing discussion of Russia's influence during the US election) combined with economical uncertainty (FED interest rate, ongoing China/US trade dispute) is making investors increasingly nervous.
I´m expecting a major correction in 2018 and think it is going to be way bigger than 2008.
Happy to hear the opinion of other investors, traders and experts on the tradingview platform.
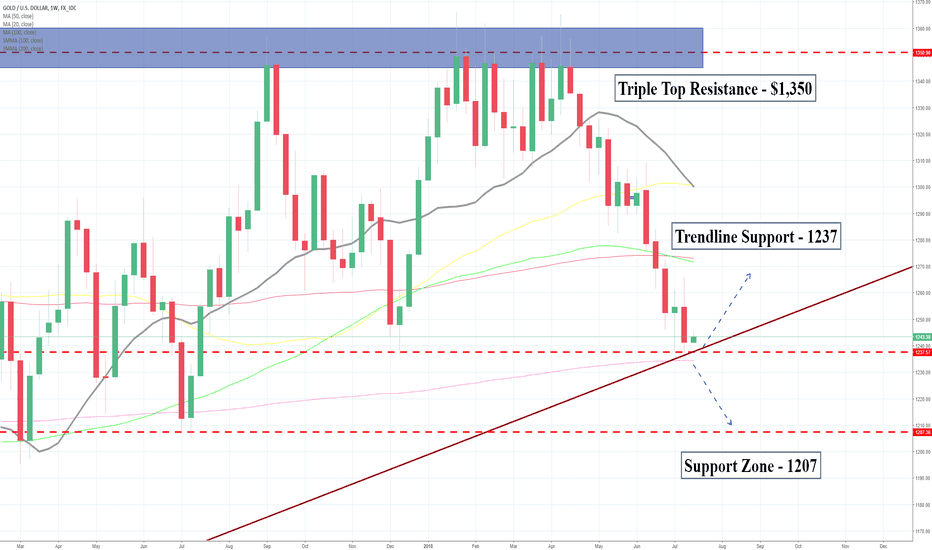
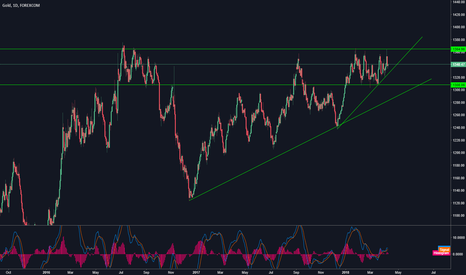
Gold to stay in gains when geopolitical tensions worsen. Gold has rallied in the previous days, backed by the high risk geopolitical events surrounding Syria, and the comments clash between USA and Russia and their allies. The longer term resistance was reached on 10th of April at the level of $1365. If demand stays high for the Gold, and when we see even more investors demand we can see the Gold rising to $1400 and closing on $1500, price action and fundamentals should be closely monitored as when tensions ease price will have difficulty to move higher as safe heaven assets are not in high demand. FED's can affect the movements also whit its policy decisions and how this will impact the USD, so these two variables, geopolitics and tensions between USA and Russia in the Middle East and the adjustment of policy from the FED are to be closely monitored and on your priority list in the news.
Upside another resistance zone $1372-$1385. After we have $1400.
At the moment the price is trapped between $1300 and $1365, with first levels of support around the $1330/$1325 levels.
Caution going forward! Good luck :) !
Risk warning!
---------------------------------------------------
Trading carries a high level of risk to your capital and may result in losses that exceed your initial deposit. You should first be aware of the risk and know what you do before you proceed with trading. Supplied information is not advice.
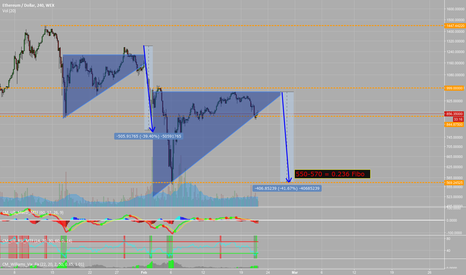
WEX ETHUSD next bottom near 550-570Here is what we see. It looks like there is already 2 wedges. Second wedge has not completely formed yet. In case of the third same fractal we can go deeper to 0.236 Fibo level.
BTFD range: 550-770
