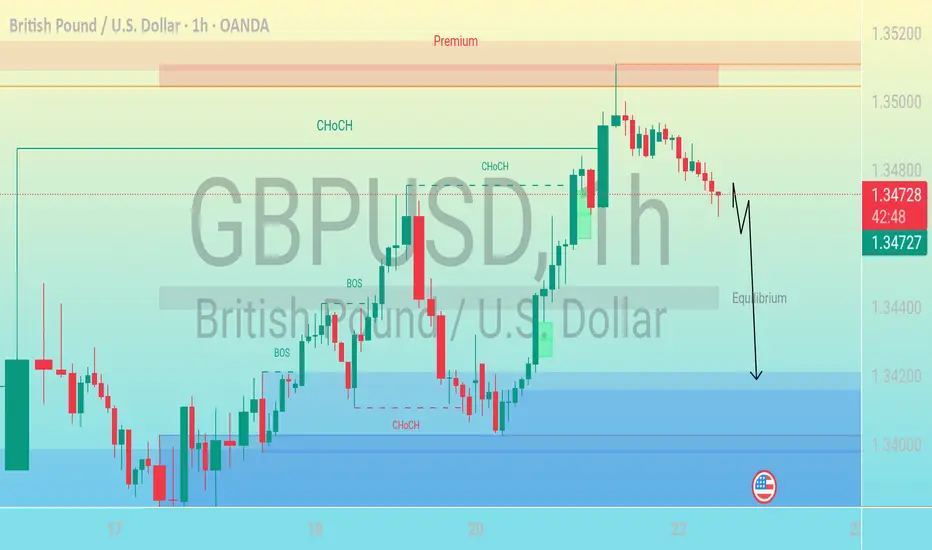
Bearish Move After CHoCH – Targeting Discount Zone"This is a GBP/USD (British Pound / U.S. Dollar) forex trading chart on the 1-hour timeframe, published on TradingView. Let’s break down and describe its key elements:
---
🕒 Timeframe & Pair
Currency Pair: GBP/USD
Timeframe: 1-hour (each candlestick = 1 hour)
Date & Time: July 22, 2025, 06:12 UTC
---
📉 Price Action
Current Price: ~1.34690
The price has recently moved from a premium zone (upper part of the range) and is heading downward.
The red candle at the top shows bearish momentum starting to form after a rally.
---
🔁 Market Structure Labels
CHoCH = Change of Character
Signals a possible reversal or shift in trend (e.g., from bearish to bullish or vice versa).
Several CHoCH points are marked throughout the chart, indicating key shifts.
BOS = Break of Structure
Indicates a significant breach of previous market structure (e.g., support/resistance).
Suggests a trend continuation or momentum confirmation.
---
⚖️ Zones
Premium Zone (Top shaded region):
Price considered overvalued, typically a good area for potential short (sell) positions.
Discount Zone (Bottom shaded region):
Price considered undervalued, potential area for buys.
Equilibrium (Middle horizontal level):
Represents fair value or a midpoint between premium and discount zones.
The price is expected to return here before potentially continuing lower.
---
⬇️ Projected Movement
A downward arrow is drawn from the current price, suggesting:
The analyst expects a pullback to the equilibrium level.
Followed by a further decline into the discount zone around 1.34200 or lower.
---
🇺🇸 News/Event Icon
U.S. flag icon near the expected price drop indicates a potential economic news release or event from the U.S. that could influence the price movement.