SAGAUSDT – Testing Major Trendline Resistance: Breakout?Chart Description:
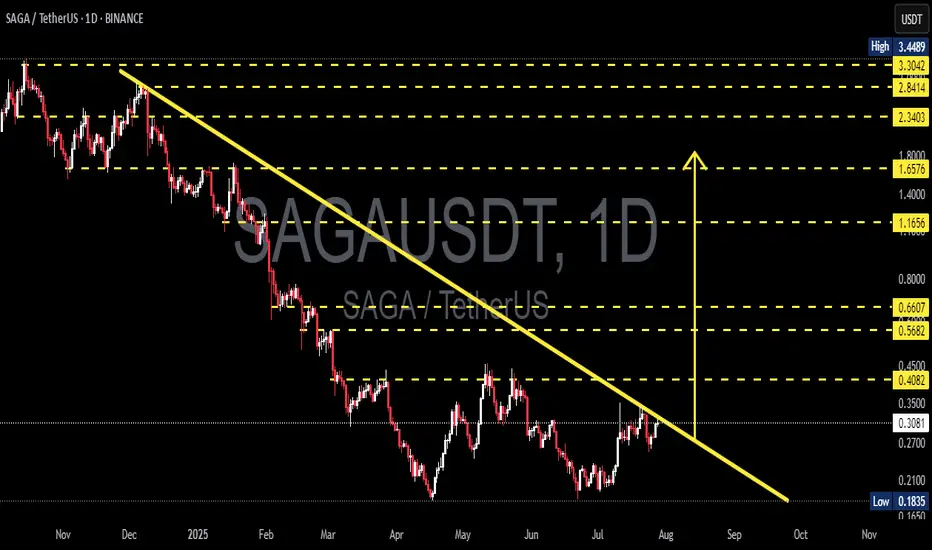
SAGAUSDT (SAGA vs USDT) is currently retesting a long-term descending trendline (yellow line) that has acted as strong resistance since November 2024. The price is now approaching a critical zone, with potential for either a breakout or a strong rejection, which could define the next major move.
---
📊 Pattern & Structure Overview:
Downtrend Line (Major Resistance): The diagonal trendline reflects consistent bearish pressure over the past several months.
Current Price: ~0.30 USDT
Key Support Level: 0.1835 USDT (Yearly Low)
Immediate Resistance Zones: 0.3066 – 0.4082 USDT
Horizontal yellow lines indicate potential target levels if the price breaks out and sustains upward momentum.
---
🐂 Bullish Scenario:
A confirmed breakout above the trendline resistance would signal a possible trend reversal or a strong bullish continuation.
Bullish confirmation strengthens if the price breaks and holds above:
0.4082 (structural resistance)
0.5682 and 0.6607 (key mid-range resistance zones)
If momentum continues, extended targets lie around 1.1656 – 1.6576 USDT and beyond.
---
🐻 Bearish Scenario:
Failure to break the trendline or a clear rejection from this level could trigger another downward move.
Potential support zones include:
0.2700
0.2100
0.1835 (key yearly low)
A breakdown below 0.1835 may open the door for deeper bearish continuation.
---
🧠 Conclusion:
SAGAUSDT is at a critical decision point, approaching the descending trendline that has defined its bearish trend. A breakout could initiate a new bullish phase, while rejection could resume the downtrend. Watch for volume and price action over the coming days to confirm the direction.
#SAGAUSDT #CryptoBreakout #TrendlineResistance #AltcoinAnalysis #TechnicalAnalysis #CryptoTrading #BullishSetup #BearishSetup #SAGA #PriceAction
Sagaanalysis
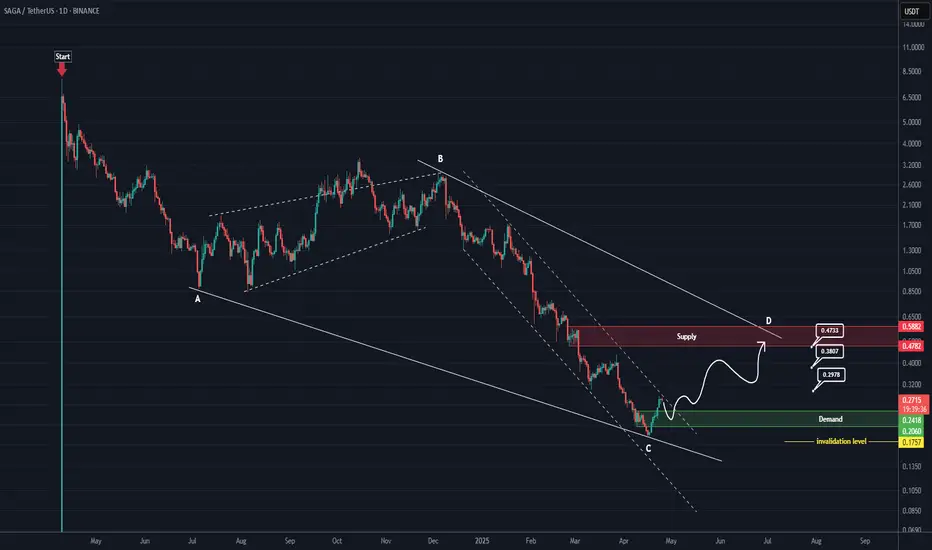
SAGA RoadMap (1D)From the point where we placed the red arrow on the chart, it appears that SAGA's correction has begun.
This correction seems to be either a diametric or a symmetrical pattern. Now, considering the extended duration of wave C, its relative comparison with the other waves, the heavy drop, and the formation of a demand zone at the bottom, wave C seems to have ended.
A rebuy can be considered on the pullback to the green zone.
The targets are marked on the chart.
A daily candle closing below the invalidation level will invalidate this analysis.
For risk management, please don't forget stop loss and capital management
Comment if you have any questions
Thank You
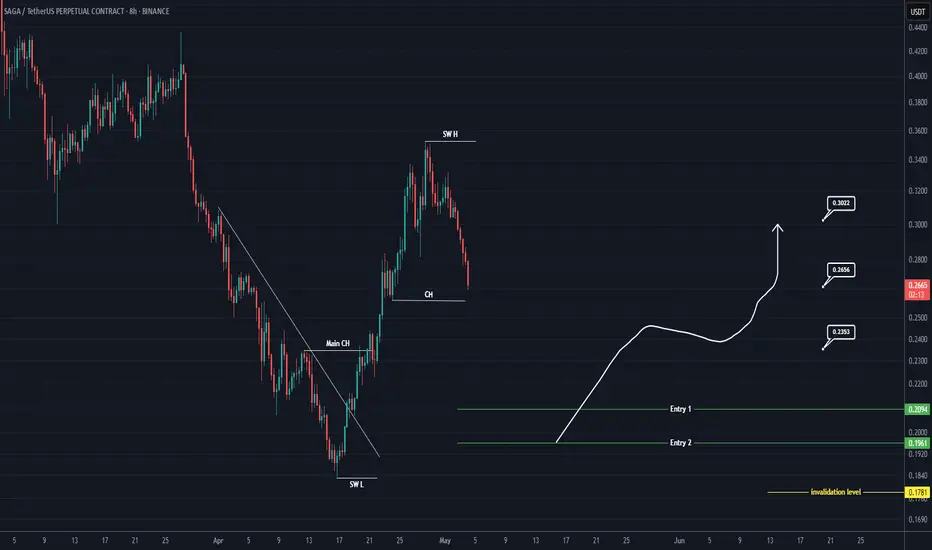
SAGA Rebuy Setup (8H)A strong move has formed, and we have a bullish CH (Change of Character) on the chart.
We can look for buy/long positions around key zones, as buyers are present in these areas.
We are focusing on buy/long positions at the entry points.
Targets are marked on the chart.
A daily candle close below the invalidation level will invalidate this analysis.
For risk management, please don't forget stop loss and capital management
Comment if you have any questions
Thank You
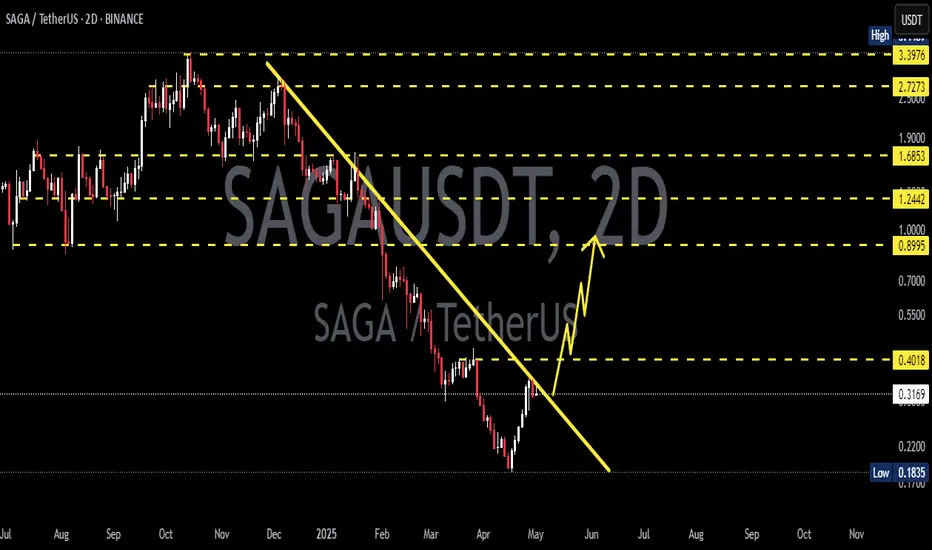
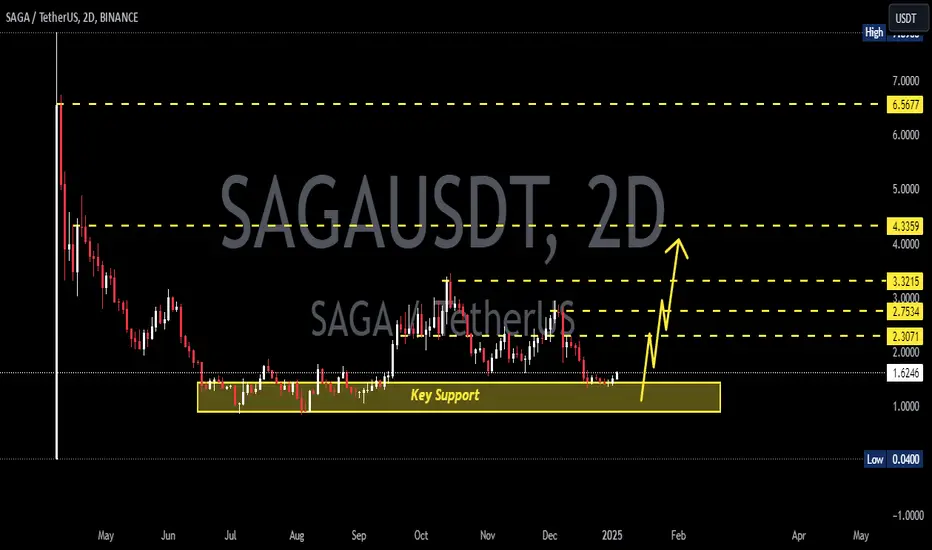
SAGAUSDT 2D AnalysisSAGA ~ 2D Analysis
#SAGA Buy after successfully penetrating this resistant line with a short -term target of at least 15%+ from here.
SAGAUSDT 2DSAGA Update ~ 2D
#SAGA Our purchases are fulfilled within this support block. Target is still the same, at least 20%+
SAGAUSDT 1DSAGA ~ 1D
#SAGA Back to retesting this support block,. If you still have Conviction on this coin,. This is a very good support to start buying back gradually,. with a target of at least 20%++ from here.
