SAGA/USDT – Endgame of Descending Triangle, Big Move Coming!🧠 Overview:
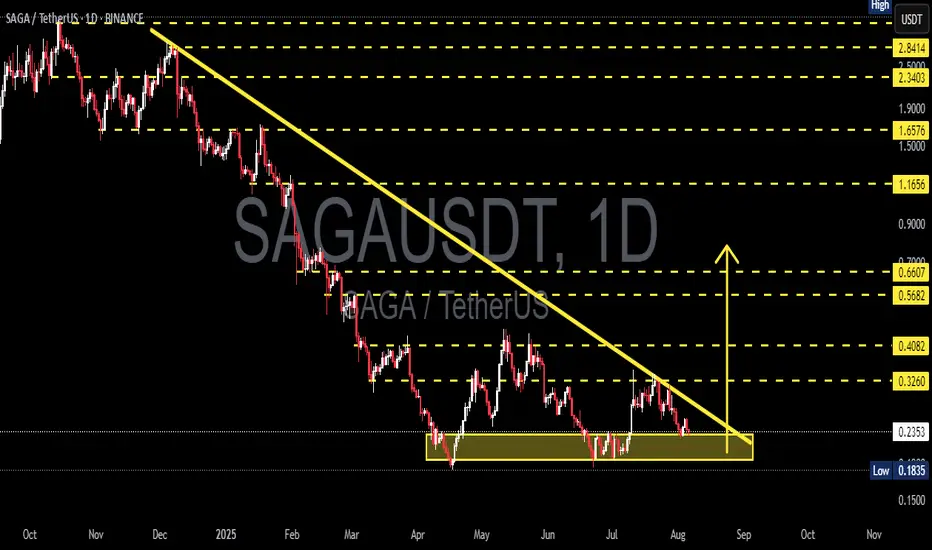
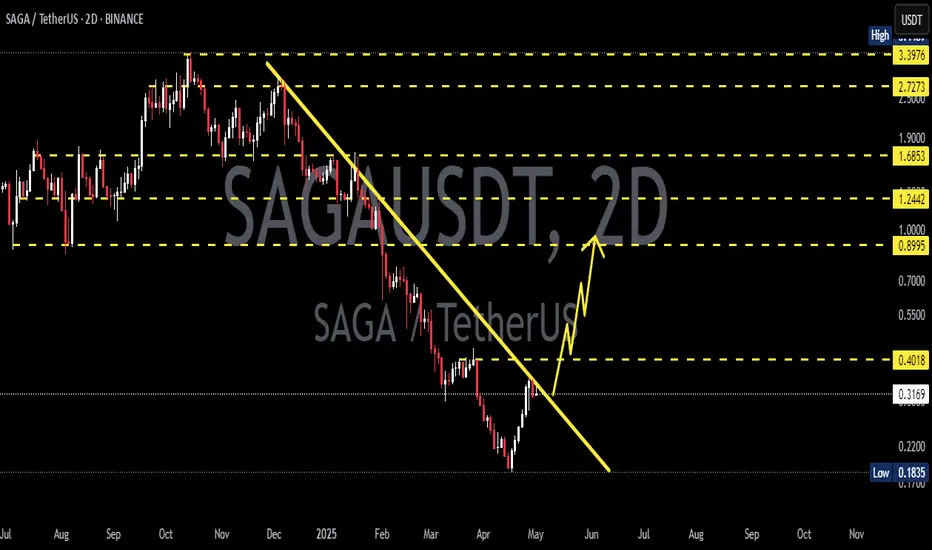
SAGA/USDT has been forming a Descending Triangle pattern for nearly 6 months, reflecting sustained selling pressure while maintaining strong horizontal support between $0.2352 – $0.1835. The price is now approaching the apex of the triangle, suggesting that a major move is imminent — either a bullish breakout or a bearish breakdown.
This setup is a classic “make or break” moment that often precedes explosive price action.
---
🔍 Technical Pattern: Descending Triangle
Dynamic Resistance: Lower highs forming a clear downtrend since February 2025.
Strong Support: The base of the triangle is solidified in the $0.2352–$0.1835 zone, which has been tested multiple times.
This pattern shows increasing sell pressure, but also persistent buyer defense — tension is rising.
---
🟢 Bullish Scenario: Breakout and Trend Reversal?
A confirmed breakout above the descending trendline and resistance at $0.3260 would signal a potential trend reversal and the start of bullish momentum.
📌 Bullish Target Levels:
1. $0.4082 – first local resistance
2. $0.5682 – volume-heavy area
3. $0.6607 – measured breakout target
4. $1.1656 – medium-term resistance
5. $1.6576 to $2.34 – possible if strong altcoin rally occurs
📈 Bullish Confirmation Signals:
Strong bullish candle close above trendline
Significant volume spike
RSI bouncing from neutral or oversold area
---
🔴 Bearish Scenario: Breakdown from Support
If the price breaks below $0.2352 and fails to hold the critical level at $0.1835, it may trigger a deeper continuation of the long-term downtrend.
📌 Bearish Target Zones:
$0.1500 psychological level
Possibly lower, depending on macro sentiment
⚠️ Caution:
Watch out for false breakdowns — wait for daily candle confirmation before reacting emotionally.
---
📊 Strategic Summary:
SAGA is at a critical inflection point — either it breaks out to reverse the trend or continues the downtrend with new lows. While descending triangles are typically bearish patterns, bullish breakouts can invalidate the structure, especially if supported by volume and sentiment.
💡 Pro Tip:
Always wait for daily candle close confirmation
Use RSI/MACD to confirm momentum shifts
Set tight stop-losses, especially near support/resistance
#SAGAUSDT #CryptoAnalysis #TechnicalBreakout #DescendingTriangle #BullishSetup #Altcoins #TrendReversal #CryptoChart #BreakoutWatch #VolumeAnalysis #PriceAction
Sagasignals
SAGAUSDT – Testing Major Trendline Resistance: Breakout?Chart Description:
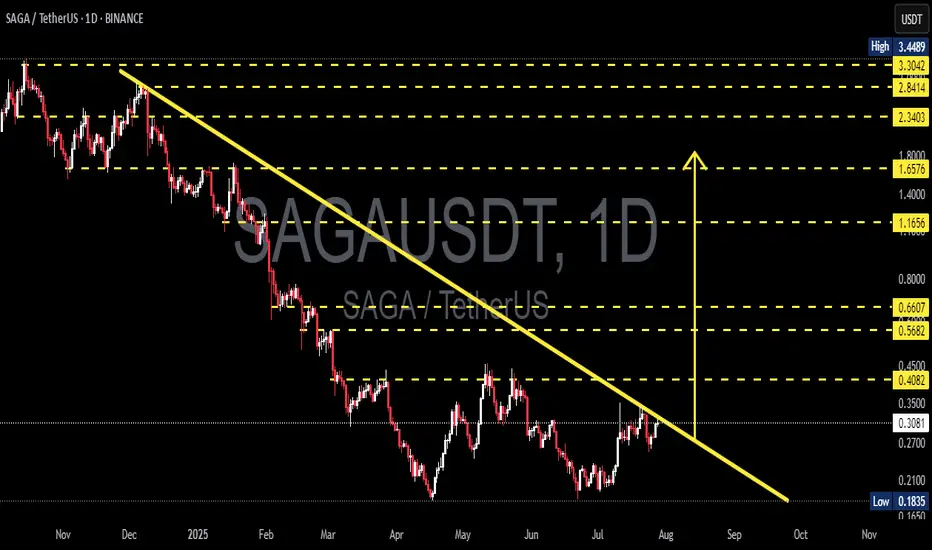
SAGAUSDT (SAGA vs USDT) is currently retesting a long-term descending trendline (yellow line) that has acted as strong resistance since November 2024. The price is now approaching a critical zone, with potential for either a breakout or a strong rejection, which could define the next major move.
---
📊 Pattern & Structure Overview:
Downtrend Line (Major Resistance): The diagonal trendline reflects consistent bearish pressure over the past several months.
Current Price: ~0.30 USDT
Key Support Level: 0.1835 USDT (Yearly Low)
Immediate Resistance Zones: 0.3066 – 0.4082 USDT
Horizontal yellow lines indicate potential target levels if the price breaks out and sustains upward momentum.
---
🐂 Bullish Scenario:
A confirmed breakout above the trendline resistance would signal a possible trend reversal or a strong bullish continuation.
Bullish confirmation strengthens if the price breaks and holds above:
0.4082 (structural resistance)
0.5682 and 0.6607 (key mid-range resistance zones)
If momentum continues, extended targets lie around 1.1656 – 1.6576 USDT and beyond.
---
🐻 Bearish Scenario:
Failure to break the trendline or a clear rejection from this level could trigger another downward move.
Potential support zones include:
0.2700
0.2100
0.1835 (key yearly low)
A breakdown below 0.1835 may open the door for deeper bearish continuation.
---
🧠 Conclusion:
SAGAUSDT is at a critical decision point, approaching the descending trendline that has defined its bearish trend. A breakout could initiate a new bullish phase, while rejection could resume the downtrend. Watch for volume and price action over the coming days to confirm the direction.
#SAGAUSDT #CryptoBreakout #TrendlineResistance #AltcoinAnalysis #TechnicalAnalysis #CryptoTrading #BullishSetup #BearishSetup #SAGA #PriceAction
SAGAUSDT Breaks Free After Long Consolidation.Big Moves Ahead?SAGAUSDT Breaks Free After Long Consolidation.Big Moves Ahead?
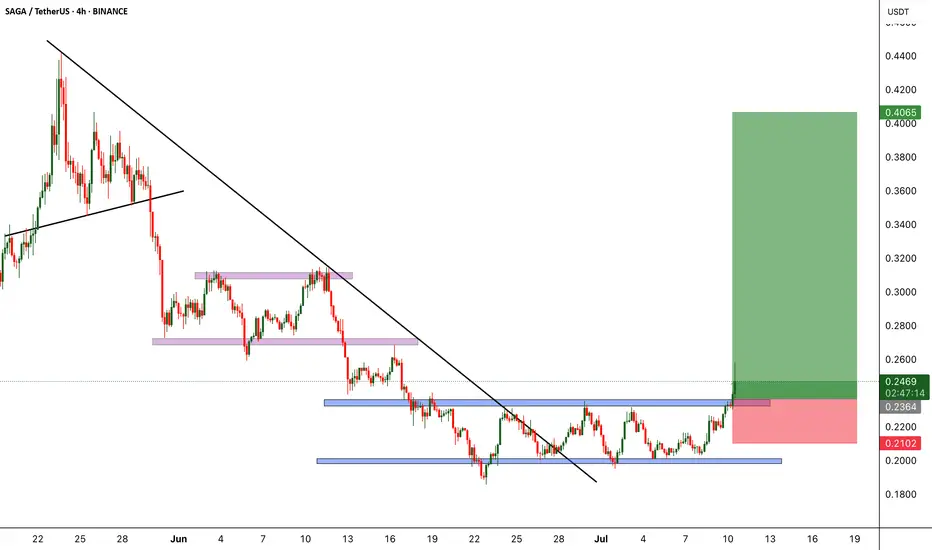
BINANCE:SAGAUSDT was consolidating within a tight range for quite some time, forming a classic accumulation box. Today, it finally broke out of that zone with strong momentum, signaling the potential start of a bullish move. This breakout could be the beginning of a bigger trend, and we’re eyeing further upside in the coming sessions.
As always, risk management is key, make sure to place your stop loss wisely and protect your capital.
#SAGAUSDT Currently trading at 0.245
Buy level : Above $0.235
Stop loss : Below $0.21
Target : $0.4
Max leverage 5x
Always keep stop loss
Follow Our Tradingview Account for More Technical Analysis Updates, | Like, Share and Comment Your thoughts
SAGAUSDT 2D AnalysisSAGA ~ 2D Analysis
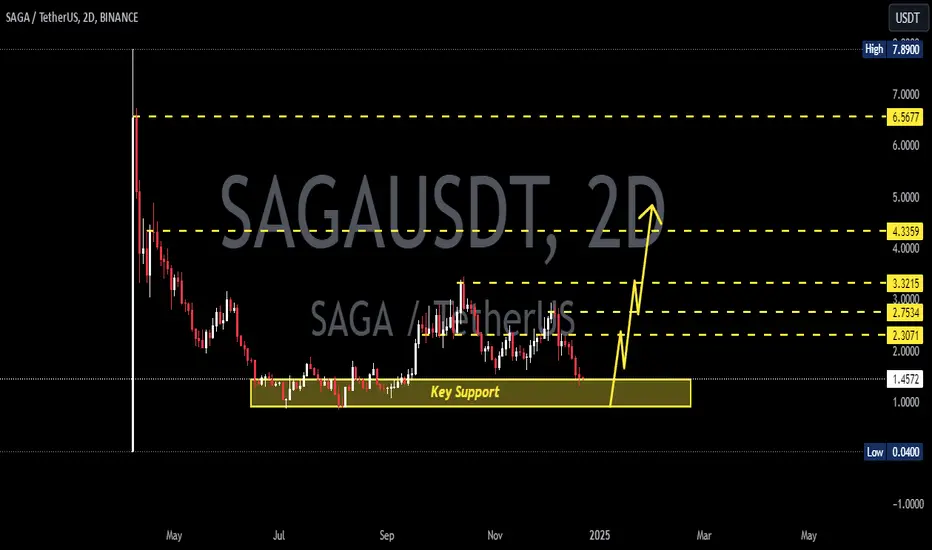
#SAGA Buy after successfully penetrating this resistant line with a short -term target of at least 15%+ from here.
SAGAUSDT 2DSAGA ~ 2D
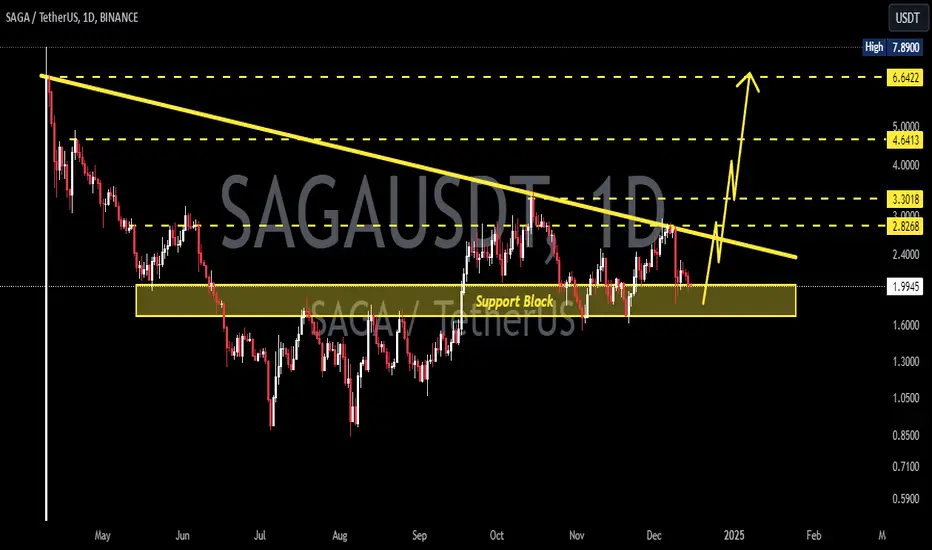
#SAGA If you still have Conviction on the coin,. This support block would be a very good buying place for now,. with a minimum target of 20%+
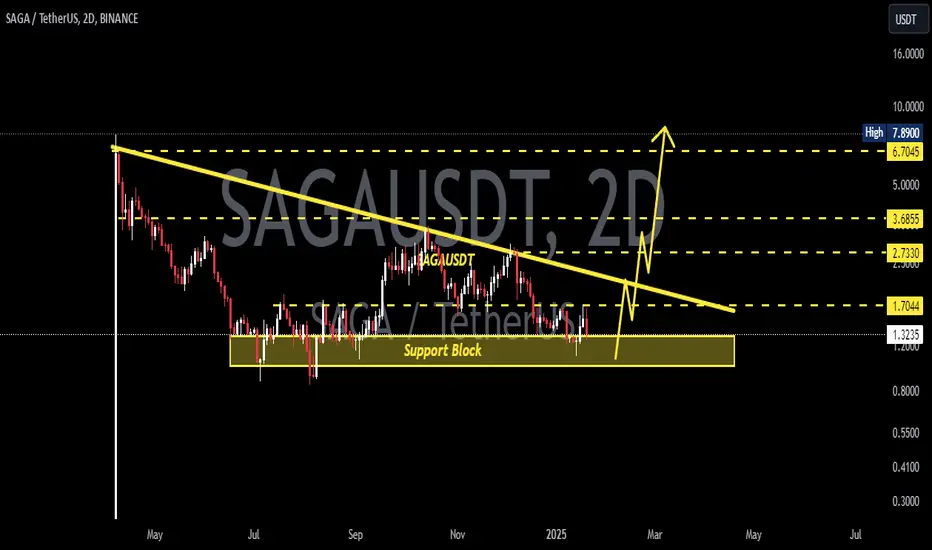
SAGAUSDT 2DSAGA ~ 2D
#SAGA If you still have Conviction on this coin, this support block will be a very good buying place for now. Buy in stages with a target of 20%++
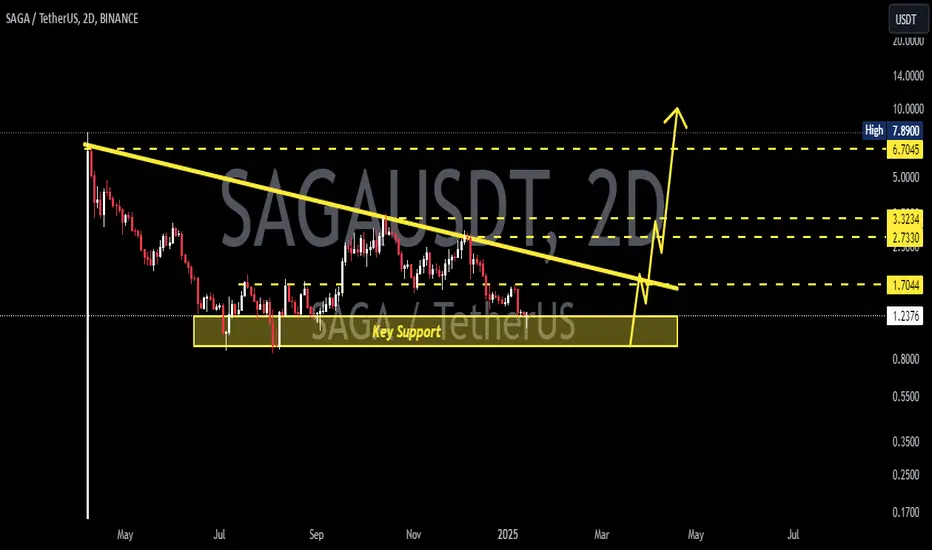
SAGAUSDT 2DSAGA ~ 2D
#SAGA this is the key support for this coin. buy in stages with a target of at least 20%+ from here.
SAGAUSDT 1DSAGA ~ 1D
#SAGA Back to retesting this support block,. If you still have Conviction on this coin,. This is a very good support to start buying back gradually,. with a target of at least 20%++ from here.

SAGAUSDT 1DSAGA ~ 1D
#SAGA Back to retesting this support block,. If you still have Conviction on this coin,. This is a very good support to start buying back gradually,. with a target of at least 20%++ from here.