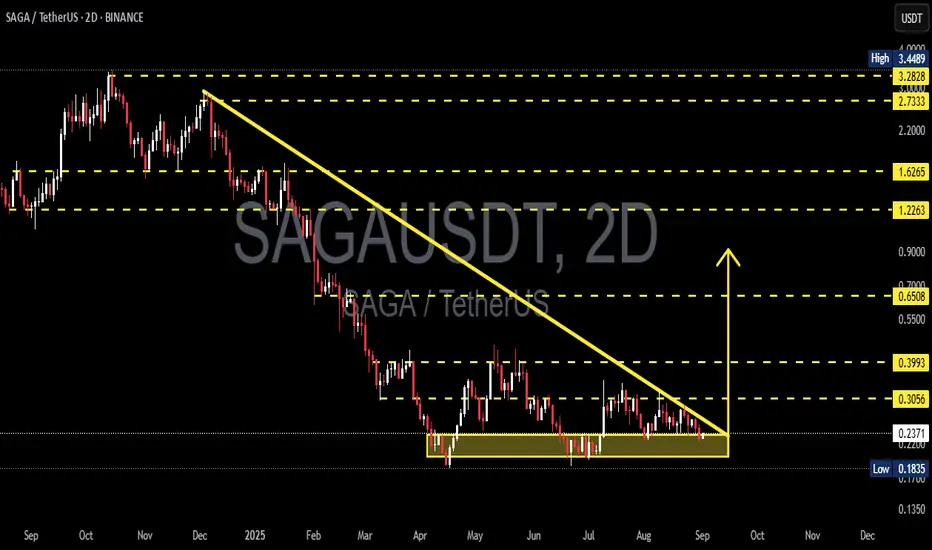
SAGAUSDT — Descending Triangle: Preparing for a Major Move?📌 Market Context
On the 2D timeframe, SAGA/USDT has been in a prolonged downtrend since late 2024 into early 2025. Recently, price action has formed a descending triangle: consistent lower highs pressing down against a flat demand zone at 0.22–0.24.
This structure reflects seller dominance (lower highs) while buyers continue to defend the same support. As price compresses into the apex of the triangle, volatility shrinks — signaling that a major move is imminent, either bullish breakout or bearish breakdown.
---
📊 Technical Structure & Key Levels
Key Demand Zone: 0.22 – 0.24 (highlighted in yellow)
Next Supports: 0.1835 (previous low), extension toward ~0.135 if breakdown accelerates
Stepwise Resistances:
0.3056 → first bullish validation
0.3993 → strong horizontal resistance
0.6508 → measured move confluence from triangle height
1.2263 → higher timeframe resistance
1.6265 → major resistance zone
2.7333 & 3.2828 → ambitious targets if macro bullish cycle resumes
Downtrend Line: descending resistance from multi-month highs, currently near 0.26–0.28
---
🟢 Bullish Scenario
Trigger:
Breakout above the downtrend line and a 2D close above 0.3056
Confirmation:
Increased volume + successful retest turning 0.27–0.305 into support
Targets:
T1: 0.3993
T2: 0.6508 (measured move projection)
T3: 1.2263 if momentum extends further
Alternative setup:
A fake breakdown below 0.22 followed by a quick reclaim above 0.23–0.24 could trigger a bear trap and squeeze price towards 0.3056/0.3993
Invalidation:
Failure above 0.3056 with price falling back under 0.26
---
🔴 Bearish Scenario
Trigger:
A decisive 2D close below 0.22 (triangle floor breakdown)
Confirmation:
Retest into 0.22–0.24 fails, flipping the zone into supply
Targets:
T1: 0.1835 (prior low)
T2: ~0.135 if sellers maintain pressure
Invalidation:
Price reclaims 0.24–0.26 with sustained strength
---
⚖️ Conclusion
The descending triangle on SAGAUSDT is now nearing completion, with price action coiling tightly around the 0.22–0.24 demand zone. Historically, this pattern favors continuation to the downside, but a bullish reversal remains possible if buyers reclaim control with a breakout above 0.3056.
In setups like this, traders often prepare for both scenarios instead of guessing direction:
React to the confirmed breakout or breakdown
Define clear invalidation levels for strict risk management
The market is reaching its decision point — the next move could be explosive.
#SAGA #SAGAUSDT #CryptoAnalysis #DescendingTriangle #PriceAction #ChartPattern #Breakout #Breakdown #CryptoTrading #SupportResistance #RiskManagement
Sagausdtanalitics
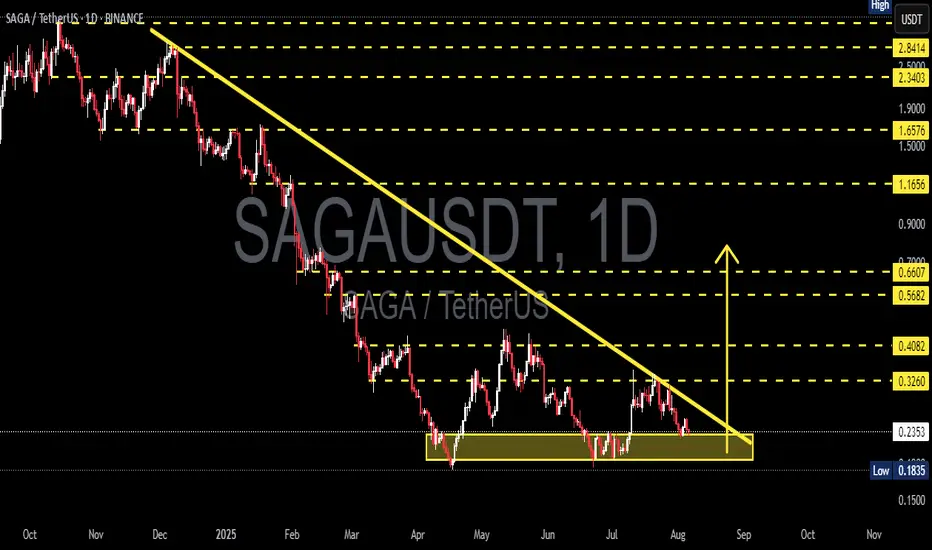
SAGA/USDT – Endgame of Descending Triangle, Big Move Coming!🧠 Overview:
SAGA/USDT has been forming a Descending Triangle pattern for nearly 6 months, reflecting sustained selling pressure while maintaining strong horizontal support between $0.2352 – $0.1835. The price is now approaching the apex of the triangle, suggesting that a major move is imminent — either a bullish breakout or a bearish breakdown.
This setup is a classic “make or break” moment that often precedes explosive price action.
---
🔍 Technical Pattern: Descending Triangle
Dynamic Resistance: Lower highs forming a clear downtrend since February 2025.
Strong Support: The base of the triangle is solidified in the $0.2352–$0.1835 zone, which has been tested multiple times.
This pattern shows increasing sell pressure, but also persistent buyer defense — tension is rising.
---
🟢 Bullish Scenario: Breakout and Trend Reversal?
A confirmed breakout above the descending trendline and resistance at $0.3260 would signal a potential trend reversal and the start of bullish momentum.
📌 Bullish Target Levels:
1. $0.4082 – first local resistance
2. $0.5682 – volume-heavy area
3. $0.6607 – measured breakout target
4. $1.1656 – medium-term resistance
5. $1.6576 to $2.34 – possible if strong altcoin rally occurs
📈 Bullish Confirmation Signals:
Strong bullish candle close above trendline
Significant volume spike
RSI bouncing from neutral or oversold area
---
🔴 Bearish Scenario: Breakdown from Support
If the price breaks below $0.2352 and fails to hold the critical level at $0.1835, it may trigger a deeper continuation of the long-term downtrend.
📌 Bearish Target Zones:
$0.1500 psychological level
Possibly lower, depending on macro sentiment
⚠️ Caution:
Watch out for false breakdowns — wait for daily candle confirmation before reacting emotionally.
---
📊 Strategic Summary:
SAGA is at a critical inflection point — either it breaks out to reverse the trend or continues the downtrend with new lows. While descending triangles are typically bearish patterns, bullish breakouts can invalidate the structure, especially if supported by volume and sentiment.
💡 Pro Tip:
Always wait for daily candle close confirmation
Use RSI/MACD to confirm momentum shifts
Set tight stop-losses, especially near support/resistance
#SAGAUSDT #CryptoAnalysis #TechnicalBreakout #DescendingTriangle #BullishSetup #Altcoins #TrendReversal #CryptoChart #BreakoutWatch #VolumeAnalysis #PriceAction
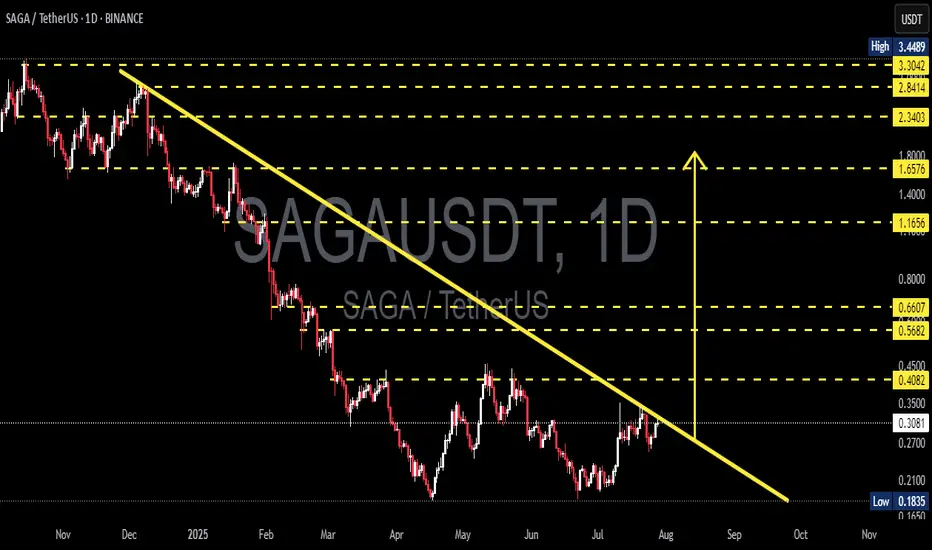
SAGAUSDT – Testing Major Trendline Resistance: Breakout?Chart Description:
SAGAUSDT (SAGA vs USDT) is currently retesting a long-term descending trendline (yellow line) that has acted as strong resistance since November 2024. The price is now approaching a critical zone, with potential for either a breakout or a strong rejection, which could define the next major move.
---
📊 Pattern & Structure Overview:
Downtrend Line (Major Resistance): The diagonal trendline reflects consistent bearish pressure over the past several months.
Current Price: ~0.30 USDT
Key Support Level: 0.1835 USDT (Yearly Low)
Immediate Resistance Zones: 0.3066 – 0.4082 USDT
Horizontal yellow lines indicate potential target levels if the price breaks out and sustains upward momentum.
---
🐂 Bullish Scenario:
A confirmed breakout above the trendline resistance would signal a possible trend reversal or a strong bullish continuation.
Bullish confirmation strengthens if the price breaks and holds above:
0.4082 (structural resistance)
0.5682 and 0.6607 (key mid-range resistance zones)
If momentum continues, extended targets lie around 1.1656 – 1.6576 USDT and beyond.
---
🐻 Bearish Scenario:
Failure to break the trendline or a clear rejection from this level could trigger another downward move.
Potential support zones include:
0.2700
0.2100
0.1835 (key yearly low)
A breakdown below 0.1835 may open the door for deeper bearish continuation.
---
🧠 Conclusion:
SAGAUSDT is at a critical decision point, approaching the descending trendline that has defined its bearish trend. A breakout could initiate a new bullish phase, while rejection could resume the downtrend. Watch for volume and price action over the coming days to confirm the direction.
#SAGAUSDT #CryptoBreakout #TrendlineResistance #AltcoinAnalysis #TechnicalAnalysis #CryptoTrading #BullishSetup #BearishSetup #SAGA #PriceAction
SAGAUSDT 2D AnalysisSAGA ~ 2D Analysis
#SAGA Buy after successfully penetrating this resistant line with a short -term target of at least 15%+ from here.
SAGAUSDT 2DSAGA ~ 2D
#SAGA If you still have Conviction on the coin,. This support block would be a very good buying place for now,. with a minimum target of 20%+
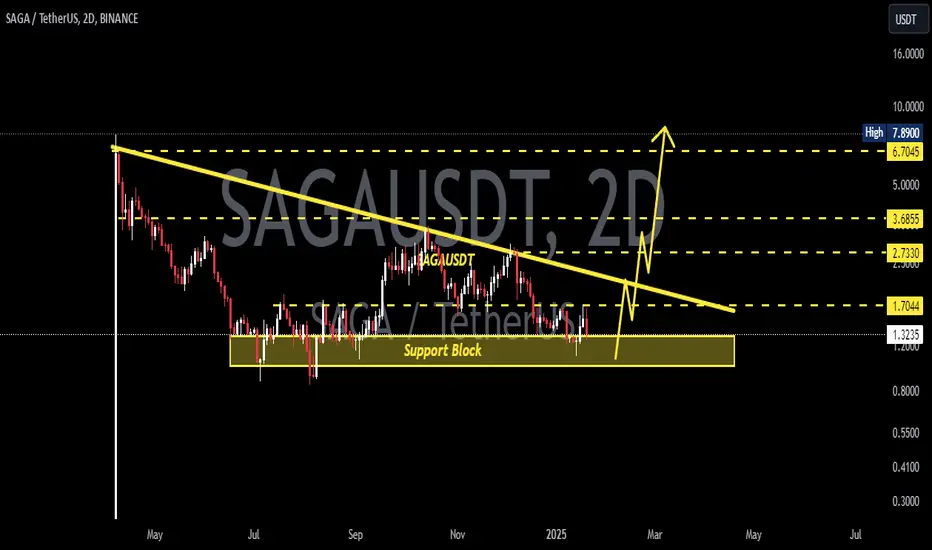
SAGAUSDT 2DSAGA ~ 2D
#SAGA If you still have Conviction on this coin, this support block will be a very good buying place for now. Buy in stages with a target of 20%++
SAGAUSDT 2DSAGA Update ~ 2D
#SAGA Our purchases are fulfilled within this support block. Target is still the same, at least 20%+
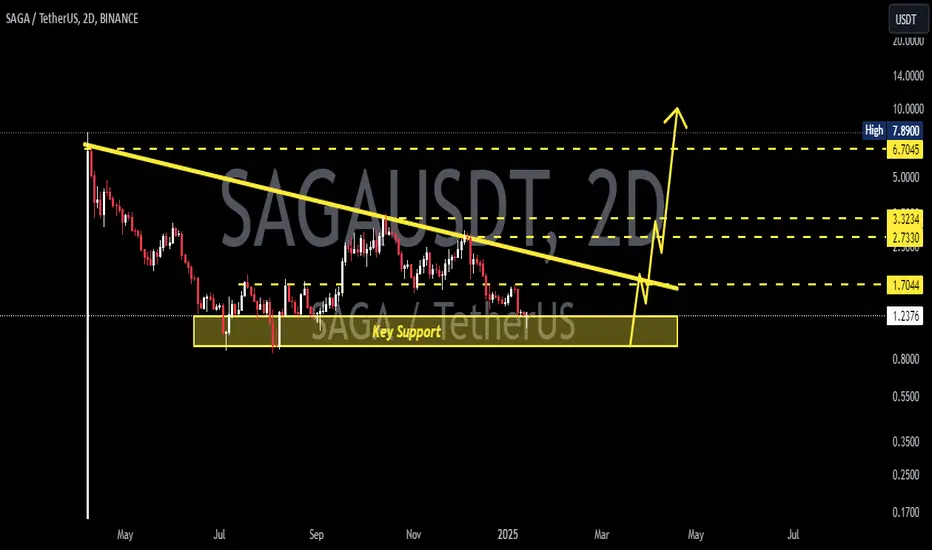
SAGAUSDT 2DSAGA ~ 2D
#SAGA this is the key support for this coin. buy in stages with a target of at least 20%+ from here.
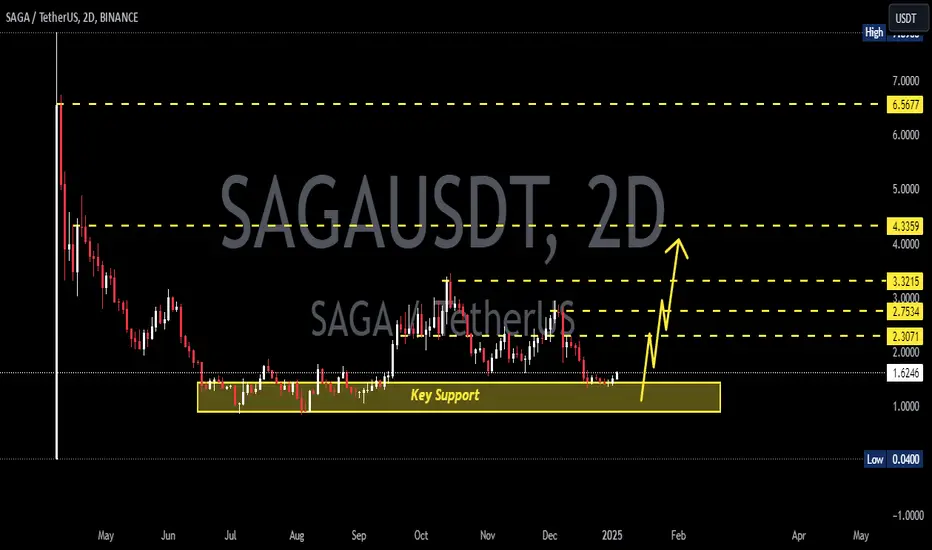
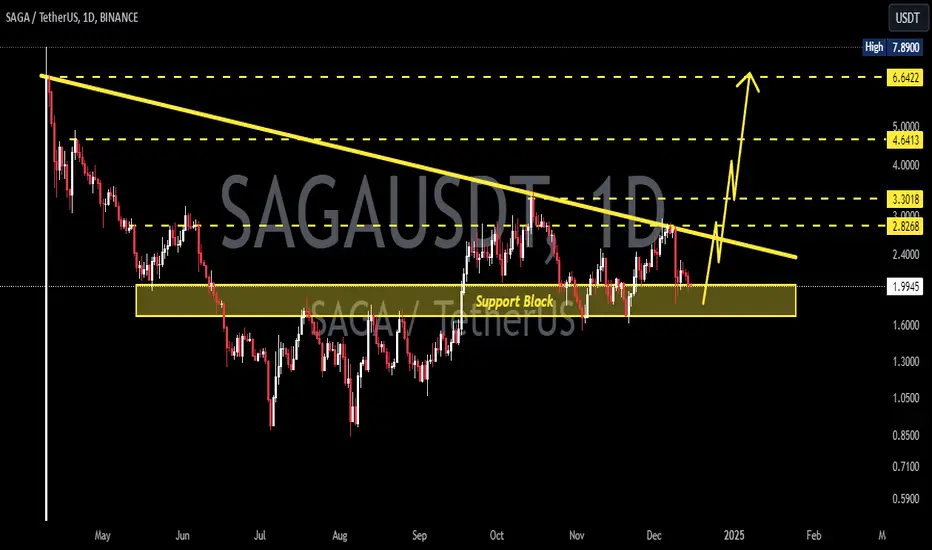
SAGAUSDT 1DSAGA ~ 1D
#SAGA Back to retesting this support block,. If you still have Conviction on this coin,. This is a very good support to start buying back gradually,. with a target of at least 20%++ from here.

SAGAUSDT 1DSAGA ~ 1D
#SAGA Back to retesting this support block,. If you still have Conviction on this coin,. This is a very good support to start buying back gradually,. with a target of at least 20%++ from here.
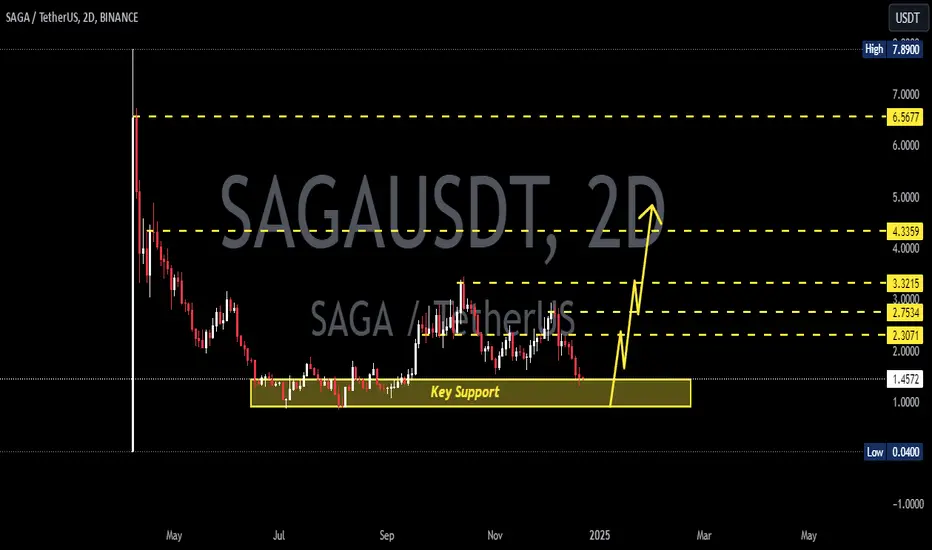
SAGAUSDT 1DSAGA ~ 1D
#SAGA If you still have Conviction on this coin,. This support block would be a very good buying place for now. buy in stages with a target of 15%++
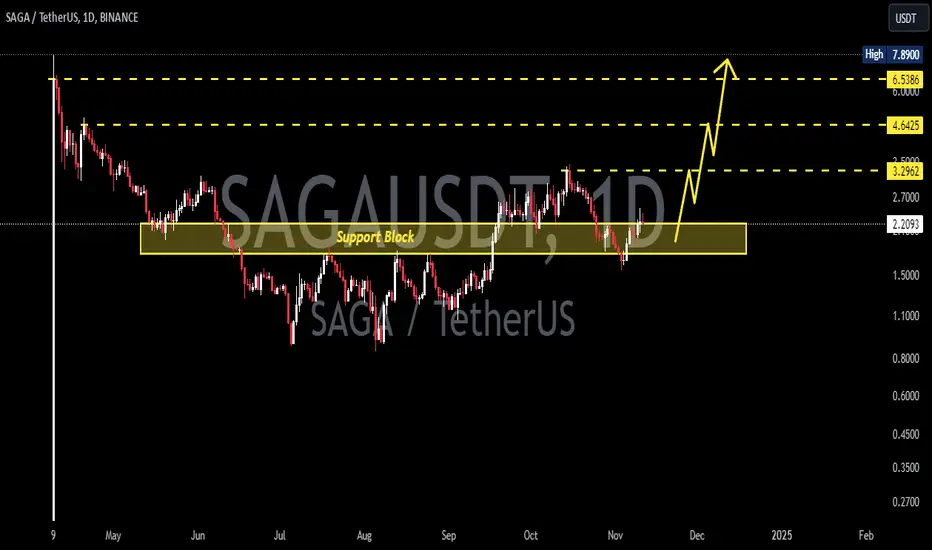
SAGAUSDTSAGA ~ 1D
#SAGA If you still have Conviction on this coin,. This support block would be a very good buying place for now. buy in stages with a target of 15%++
btc - Donalt tramp and pump SAGA- bullish structur
- a potential break out the trend line - yellow trendline
- a Bull false break out
-
