SAGAUSDT — Descending Triangle: Preparing for a Major Move?📌 Market Context
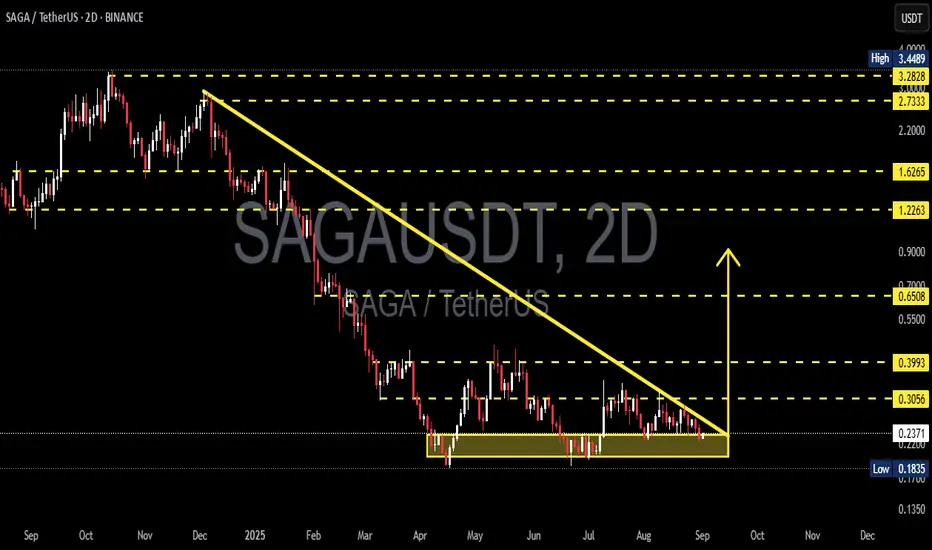
On the 2D timeframe, SAGA/USDT has been in a prolonged downtrend since late 2024 into early 2025. Recently, price action has formed a descending triangle: consistent lower highs pressing down against a flat demand zone at 0.22–0.24.
This structure reflects seller dominance (lower highs) while buyers continue to defend the same support. As price compresses into the apex of the triangle, volatility shrinks — signaling that a major move is imminent, either bullish breakout or bearish breakdown.
---
📊 Technical Structure & Key Levels
Key Demand Zone: 0.22 – 0.24 (highlighted in yellow)
Next Supports: 0.1835 (previous low), extension toward ~0.135 if breakdown accelerates
Stepwise Resistances:
0.3056 → first bullish validation
0.3993 → strong horizontal resistance
0.6508 → measured move confluence from triangle height
1.2263 → higher timeframe resistance
1.6265 → major resistance zone
2.7333 & 3.2828 → ambitious targets if macro bullish cycle resumes
Downtrend Line: descending resistance from multi-month highs, currently near 0.26–0.28
---
🟢 Bullish Scenario
Trigger:
Breakout above the downtrend line and a 2D close above 0.3056
Confirmation:
Increased volume + successful retest turning 0.27–0.305 into support
Targets:
T1: 0.3993
T2: 0.6508 (measured move projection)
T3: 1.2263 if momentum extends further
Alternative setup:
A fake breakdown below 0.22 followed by a quick reclaim above 0.23–0.24 could trigger a bear trap and squeeze price towards 0.3056/0.3993
Invalidation:
Failure above 0.3056 with price falling back under 0.26
---
🔴 Bearish Scenario
Trigger:
A decisive 2D close below 0.22 (triangle floor breakdown)
Confirmation:
Retest into 0.22–0.24 fails, flipping the zone into supply
Targets:
T1: 0.1835 (prior low)
T2: ~0.135 if sellers maintain pressure
Invalidation:
Price reclaims 0.24–0.26 with sustained strength
---
⚖️ Conclusion
The descending triangle on SAGAUSDT is now nearing completion, with price action coiling tightly around the 0.22–0.24 demand zone. Historically, this pattern favors continuation to the downside, but a bullish reversal remains possible if buyers reclaim control with a breakout above 0.3056.
In setups like this, traders often prepare for both scenarios instead of guessing direction:
React to the confirmed breakout or breakdown
Define clear invalidation levels for strict risk management
The market is reaching its decision point — the next move could be explosive.
#SAGA #SAGAUSDT #CryptoAnalysis #DescendingTriangle #PriceAction #ChartPattern #Breakout #Breakdown #CryptoTrading #SupportResistance #RiskManagement
Sagausdtbuy
SAGA/USDT – Endgame of Descending Triangle, Big Move Coming!🧠 Overview:
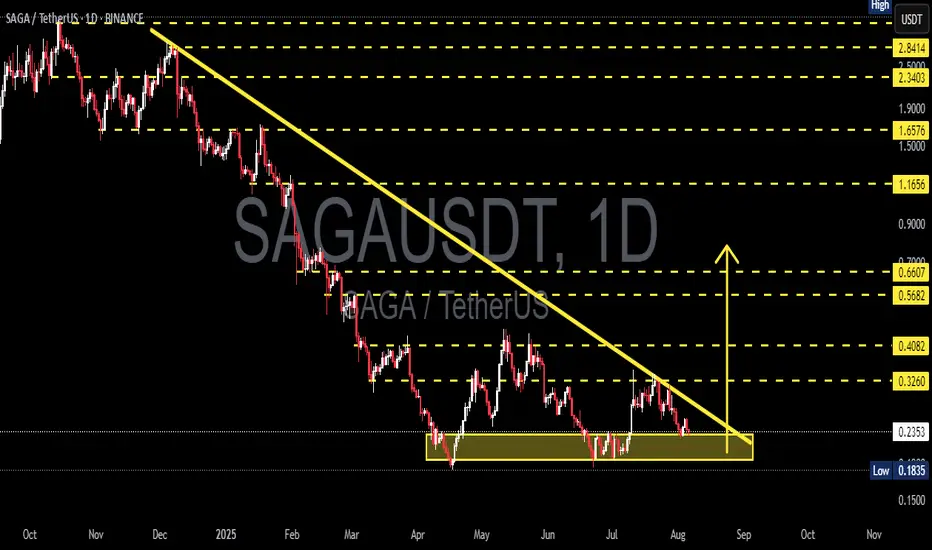
SAGA/USDT has been forming a Descending Triangle pattern for nearly 6 months, reflecting sustained selling pressure while maintaining strong horizontal support between $0.2352 – $0.1835. The price is now approaching the apex of the triangle, suggesting that a major move is imminent — either a bullish breakout or a bearish breakdown.
This setup is a classic “make or break” moment that often precedes explosive price action.
---
🔍 Technical Pattern: Descending Triangle
Dynamic Resistance: Lower highs forming a clear downtrend since February 2025.
Strong Support: The base of the triangle is solidified in the $0.2352–$0.1835 zone, which has been tested multiple times.
This pattern shows increasing sell pressure, but also persistent buyer defense — tension is rising.
---
🟢 Bullish Scenario: Breakout and Trend Reversal?
A confirmed breakout above the descending trendline and resistance at $0.3260 would signal a potential trend reversal and the start of bullish momentum.
📌 Bullish Target Levels:
1. $0.4082 – first local resistance
2. $0.5682 – volume-heavy area
3. $0.6607 – measured breakout target
4. $1.1656 – medium-term resistance
5. $1.6576 to $2.34 – possible if strong altcoin rally occurs
📈 Bullish Confirmation Signals:
Strong bullish candle close above trendline
Significant volume spike
RSI bouncing from neutral or oversold area
---
🔴 Bearish Scenario: Breakdown from Support
If the price breaks below $0.2352 and fails to hold the critical level at $0.1835, it may trigger a deeper continuation of the long-term downtrend.
📌 Bearish Target Zones:
$0.1500 psychological level
Possibly lower, depending on macro sentiment
⚠️ Caution:
Watch out for false breakdowns — wait for daily candle confirmation before reacting emotionally.
---
📊 Strategic Summary:
SAGA is at a critical inflection point — either it breaks out to reverse the trend or continues the downtrend with new lows. While descending triangles are typically bearish patterns, bullish breakouts can invalidate the structure, especially if supported by volume and sentiment.
💡 Pro Tip:
Always wait for daily candle close confirmation
Use RSI/MACD to confirm momentum shifts
Set tight stop-losses, especially near support/resistance
#SAGAUSDT #CryptoAnalysis #TechnicalBreakout #DescendingTriangle #BullishSetup #Altcoins #TrendReversal #CryptoChart #BreakoutWatch #VolumeAnalysis #PriceAction
SAGAUSDT – Testing Major Trendline Resistance: Breakout?Chart Description:
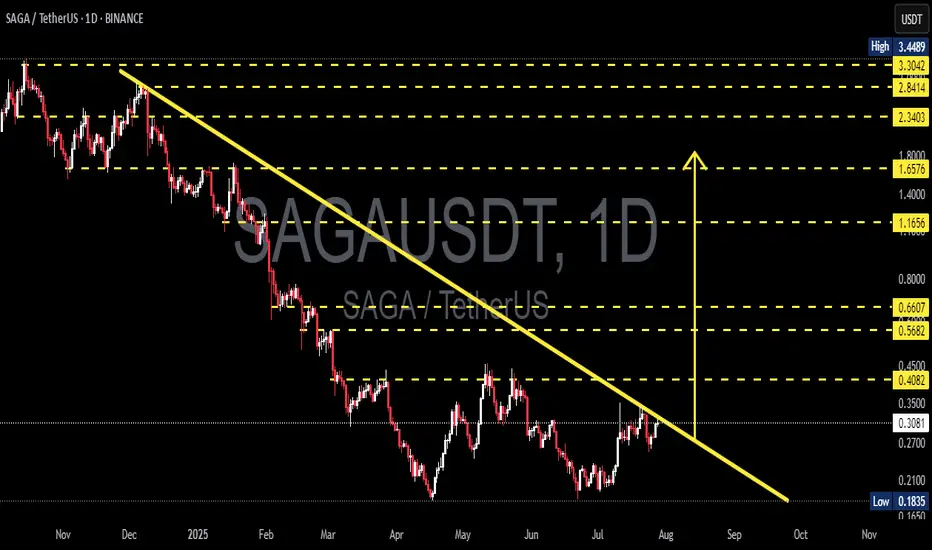
SAGAUSDT (SAGA vs USDT) is currently retesting a long-term descending trendline (yellow line) that has acted as strong resistance since November 2024. The price is now approaching a critical zone, with potential for either a breakout or a strong rejection, which could define the next major move.
---
📊 Pattern & Structure Overview:
Downtrend Line (Major Resistance): The diagonal trendline reflects consistent bearish pressure over the past several months.
Current Price: ~0.30 USDT
Key Support Level: 0.1835 USDT (Yearly Low)
Immediate Resistance Zones: 0.3066 – 0.4082 USDT
Horizontal yellow lines indicate potential target levels if the price breaks out and sustains upward momentum.
---
🐂 Bullish Scenario:
A confirmed breakout above the trendline resistance would signal a possible trend reversal or a strong bullish continuation.
Bullish confirmation strengthens if the price breaks and holds above:
0.4082 (structural resistance)
0.5682 and 0.6607 (key mid-range resistance zones)
If momentum continues, extended targets lie around 1.1656 – 1.6576 USDT and beyond.
---
🐻 Bearish Scenario:
Failure to break the trendline or a clear rejection from this level could trigger another downward move.
Potential support zones include:
0.2700
0.2100
0.1835 (key yearly low)
A breakdown below 0.1835 may open the door for deeper bearish continuation.
---
🧠 Conclusion:
SAGAUSDT is at a critical decision point, approaching the descending trendline that has defined its bearish trend. A breakout could initiate a new bullish phase, while rejection could resume the downtrend. Watch for volume and price action over the coming days to confirm the direction.
#SAGAUSDT #CryptoBreakout #TrendlineResistance #AltcoinAnalysis #TechnicalAnalysis #CryptoTrading #BullishSetup #BearishSetup #SAGA #PriceAction
SAGAUSDT Forming Falling WedgeSAGAUSDT is showing promising signs of a trend reversal as it completes a falling wedge pattern, which is a widely respected bullish continuation signal in crypto trading. This chart structure suggests that the recent downtrend could be coming to an end, with the price poised for a strong upward breakout. The current market volume looks healthy, adding weight to the possibility of this setup playing out successfully. With an expected gain of 90% to 100%+, this pair could attract significant attention from swing traders and position traders looking to capitalize on the next big move.
This crypto pair has been drawing increasing interest from investors due to the innovative vision behind the Saga ecosystem and its growing presence in the decentralized applications space. Community sentiment has turned optimistic as fresh liquidity appears to be entering the market, a critical factor for sustainable bullish momentum. As more buyers step in to accumulate around the wedge support, the likelihood of a confirmed breakout strengthens.
Traders should keep a close watch on key breakout levels and look for strong bullish candles closing above the wedge resistance line. An ideal scenario would include a volume spike accompanying the breakout, as this often validates the breakout strength and confirms that new buyers are stepping in aggressively. Proper risk management remains crucial—placing stop-losses below recent swing lows can protect capital while riding this high-probability setup.
✅ Show your support by hitting the like button and
✅ Leaving a comment below! (What is You opinion about this Coin)
Your feedback and engagement keep me inspired to share more insightful market analysis with you!
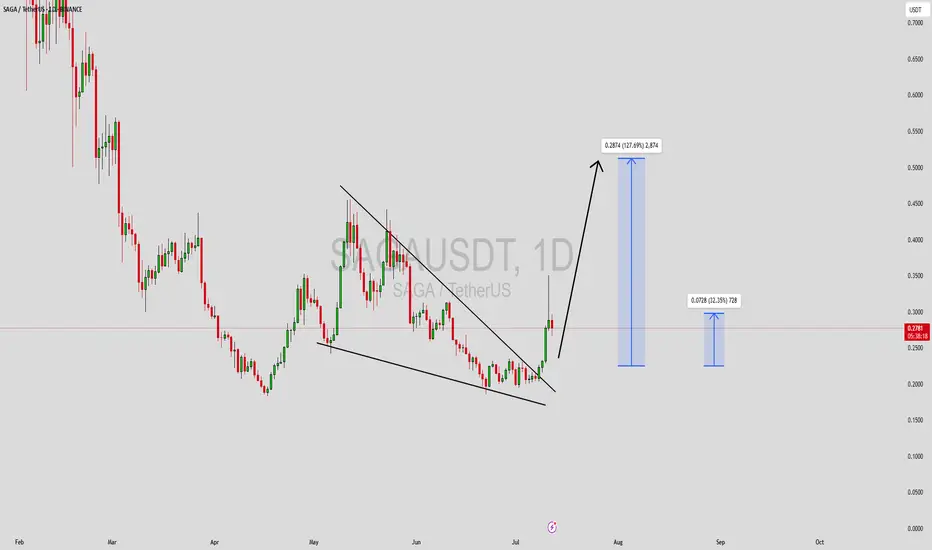
SAGAUSDT Breaks Free After Long Consolidation.Big Moves Ahead?SAGAUSDT Breaks Free After Long Consolidation.Big Moves Ahead?
BINANCE:SAGAUSDT was consolidating within a tight range for quite some time, forming a classic accumulation box. Today, it finally broke out of that zone with strong momentum, signaling the potential start of a bullish move. This breakout could be the beginning of a bigger trend, and we’re eyeing further upside in the coming sessions.
As always, risk management is key, make sure to place your stop loss wisely and protect your capital.
#SAGAUSDT Currently trading at 0.245
Buy level : Above $0.235
Stop loss : Below $0.21
Target : $0.4
Max leverage 5x
Always keep stop loss
Follow Our Tradingview Account for More Technical Analysis Updates, | Like, Share and Comment Your thoughts
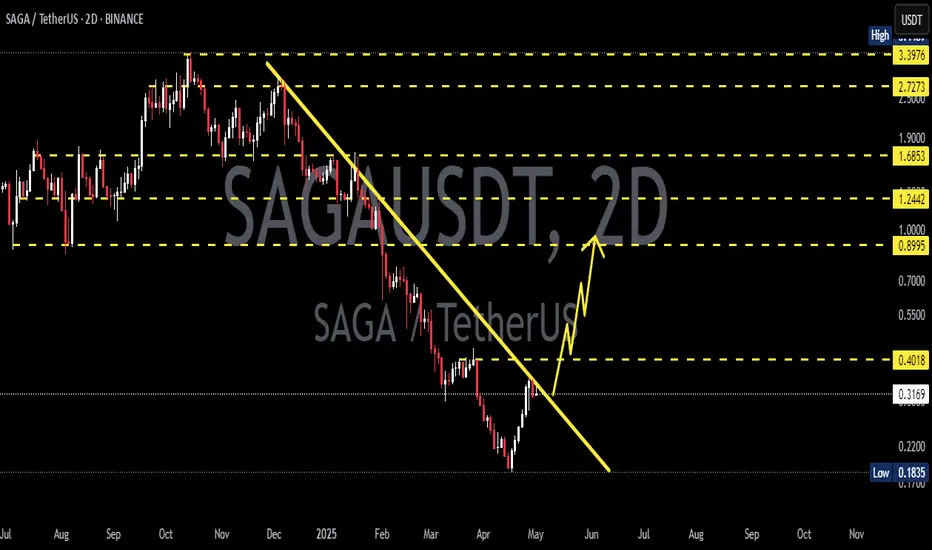
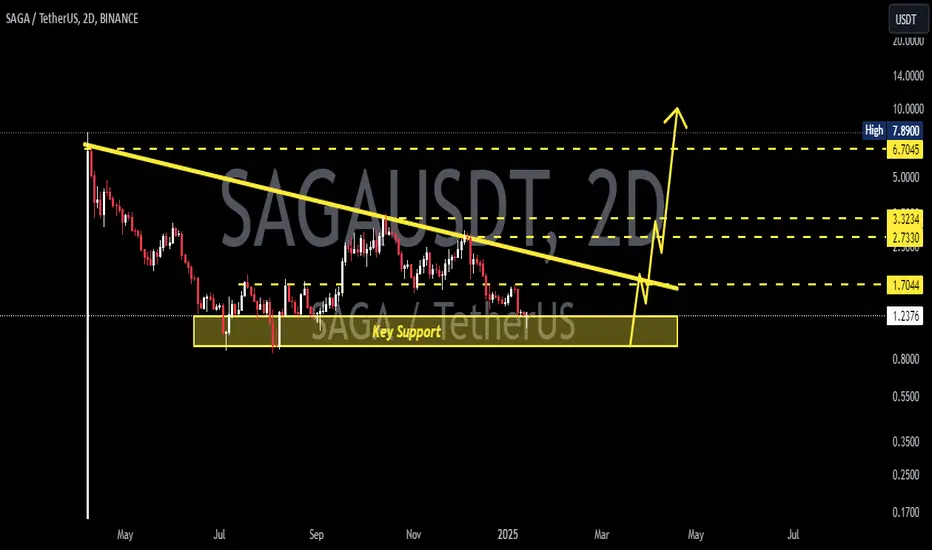
SAGAUSDT 2D AnalysisSAGA ~ 2D Analysis
#SAGA Buy after successfully penetrating this resistant line with a short -term target of at least 15%+ from here.
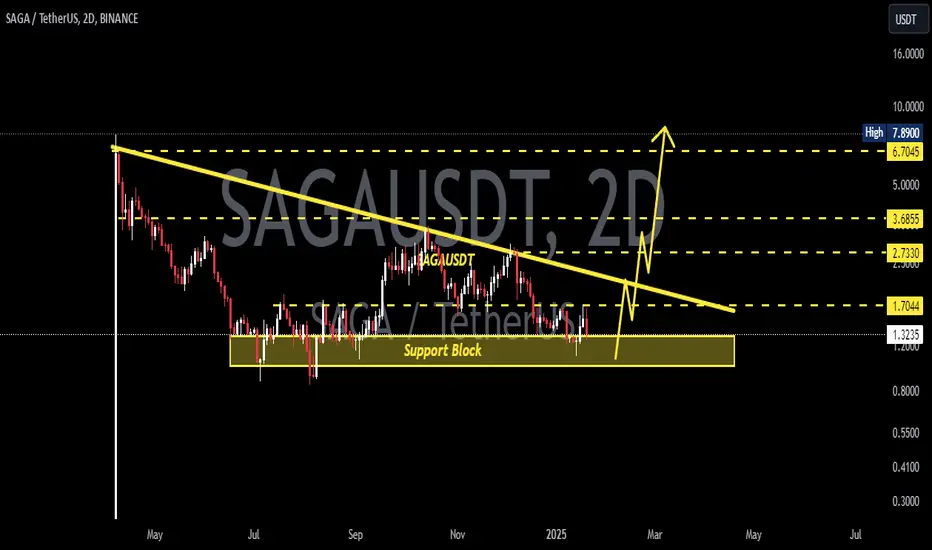
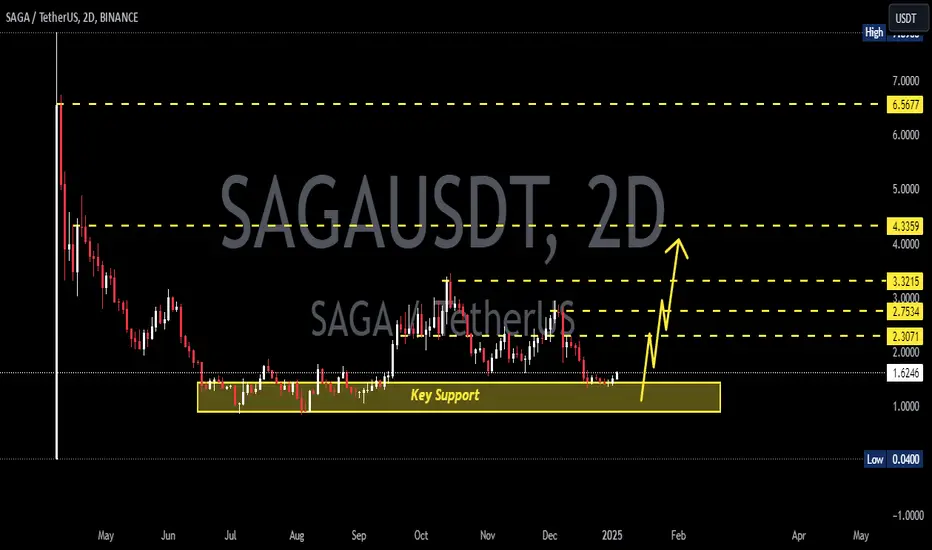
SAGAUSDT 2DSAGA ~ 2D
#SAGA If you still have Conviction on the coin,. This support block would be a very good buying place for now,. with a minimum target of 20%+
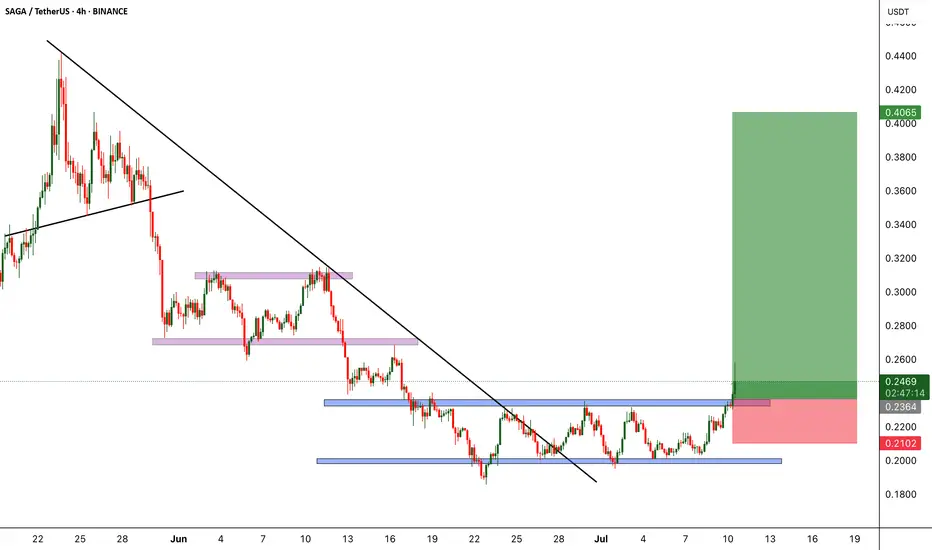
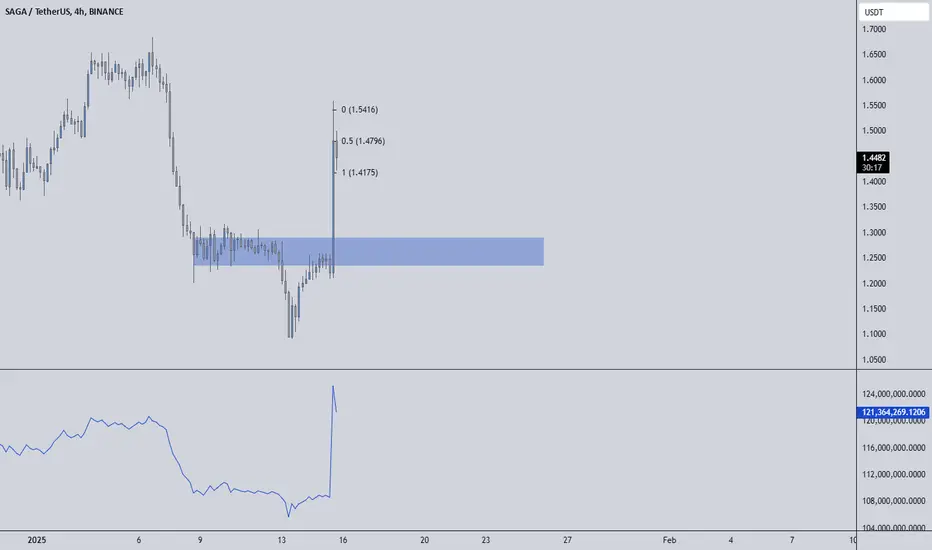
SAGAUSDT %500 HUGE VOLUME SPIKE DONT SLEEP ON THIS! SAGAUSDT Blue Box Entry Opportunity
I may join maybe around 1.315 too.
All the requirements for the blue box have been meticulously verified.
Highlights:
Volume Spike: A significant daily volume increase, confirming smart money involvement.
CDV & Heatmap Support: Positive cumulative delta volume with visible buyer activity on the liquidity heatmap.
Volume Profile: Perfect alignment with our blue box, indicating a high-probability zone.
Key Observations:
"The blue box is very carefully picked using volume footprint, volume profile, cumulative delta volume, and liquidity heatmap. When trading this zone, I will look for buyers and upward market structure breaks in lower time frames for confirmation."
Stay tuned for updates! 🚀
Let me tell you, this is something special. These insights, these setups—they’re not just good; they’re game-changers. I've spent years refining my approach, and the results speak for themselves. People are always asking, "How do you spot these opportunities?" It’s simple: experience, clarity, and a focus on high-probability moves.
Want to know how I use heatmaps, cumulative volume delta, and volume footprint techniques to find demand zones with precision? I’m happy to share—just send me a message. No cost, no catch. I believe in helping people make smarter decisions.
Here are some of my recent analyses. Each one highlights key opportunities:
🚀 RENDERUSDT: Strategic Support Zones at the Blue Boxes +%45 Reaction
🎯 PUNDIXUSDT: Huge Opportunity | 250% Volume Spike - %60 Reaction Sniper Entry
🌐 CryptoMarkets TOTAL2: Support Zone
🚀 GMTUSDT: %35 FAST REJECTION FROM THE RED BOX
🎯 ZENUSDT.P: Patience & Profitability | %230 Reaction from the Sniper Entry
🎯 DEXEUSDT %180 Reaction with %9 Stop
🐶 DOGEUSDT.P: Next Move
🎨 RENDERUSDT.P: Opportunity of the Month
💎 ETHUSDT.P: Where to Retrace
🟢 BNBUSDT.P: Potential Surge
📊 BTC Dominance: Reaction Zone
🌊 WAVESUSDT.P: Demand Zone Potential
🟣 UNIUSDT.P: Long-Term Trade
🔵 XRPUSDT.P: Entry Zones
🔗 LINKUSDT.P: Follow The River
📈 BTCUSDT.P: Two Key Demand Zones
🟩 POLUSDT: Bullish Momentum
🌟 PENDLEUSDT.P: Where Opportunity Meets Precision
🔥 BTCUSDT.P: Liquidation of Highly Leveraged Longs
🌊 SOLUSDT.P: SOL's Dip - Your Opportunity
🐸 1000PEPEUSDT.P: Prime Bounce Zone Unlocked
🚀 ETHUSDT.P: Set to Explode - Don't Miss This Game Changer
🤖 IQUSDT: Smart Plan
⚡️ PONDUSDT: A Trade Not Taken Is Better Than a Losing One
💼 STMXUSDT: 2 Buying Areas
🐢 TURBOUSDT: Buy Zones and Buyer Presence
🌍 ICPUSDT.P: Massive Upside Potential | Check the Trade Update For Seeing Results
🟠 IDEXUSDT: Spot Buy Area | %26 Profit if You Trade with MSB
📌 USUALUSDT: Buyers Are Active + %70 Profit in Total
🌟 FORTHUSDT: Sniper Entry +%26 Reaction
🐳 QKCUSDT: Sniper Entry +%57 Reaction
📊 BTC.D: Retest of Key Area Highly Likely
This list? It’s just a small piece of what I’ve been working on. There’s so much more. Go check my profile, see the results for yourself. My goal is simple: provide value and help you win. If you’ve got questions, I’ve got answers. Let’s get to work!
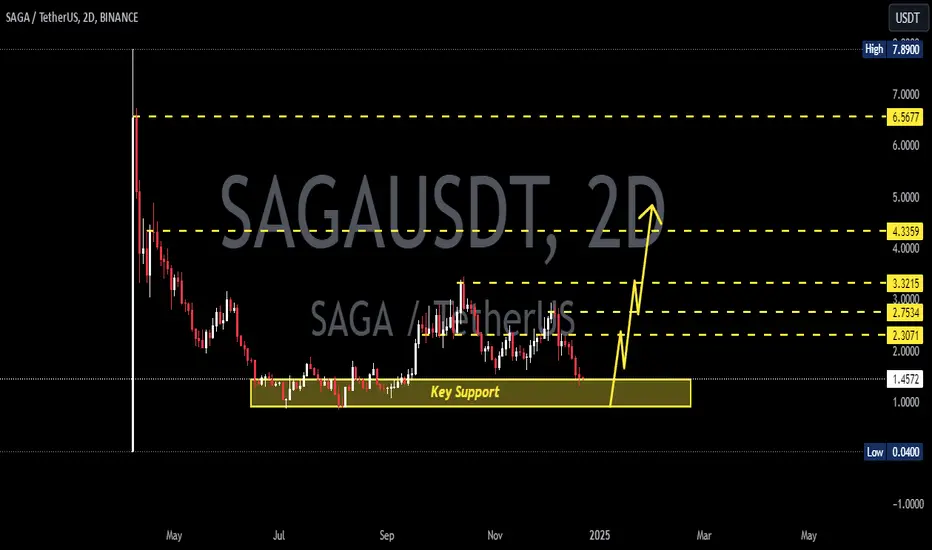
SAGAUSDT 2DSAGA ~ 2D
#SAGA If you still have Conviction on this coin, this support block will be a very good buying place for now. Buy in stages with a target of 20%++
SAGAUSDT 2DSAGA Update ~ 2D
#SAGA Our purchases are fulfilled within this support block. Target is still the same, at least 20%+
SAGAUSDT 2DSAGA ~ 2D
#SAGA this is the key support for this coin. buy in stages with a target of at least 20%+ from here.
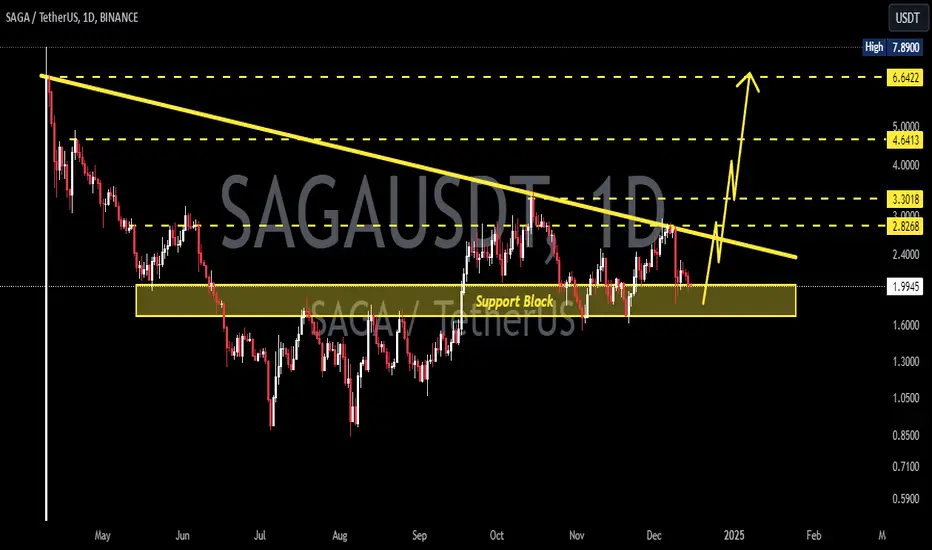
SAGAUSDT 1DSAGA ~ 1D
#SAGA Back to retesting this support block,. If you still have Conviction on this coin,. This is a very good support to start buying back gradually,. with a target of at least 20%++ from here.

SAGAUSDT 1DSAGA ~ 1D
#SAGA Back to retesting this support block,. If you still have Conviction on this coin,. This is a very good support to start buying back gradually,. with a target of at least 20%++ from here.
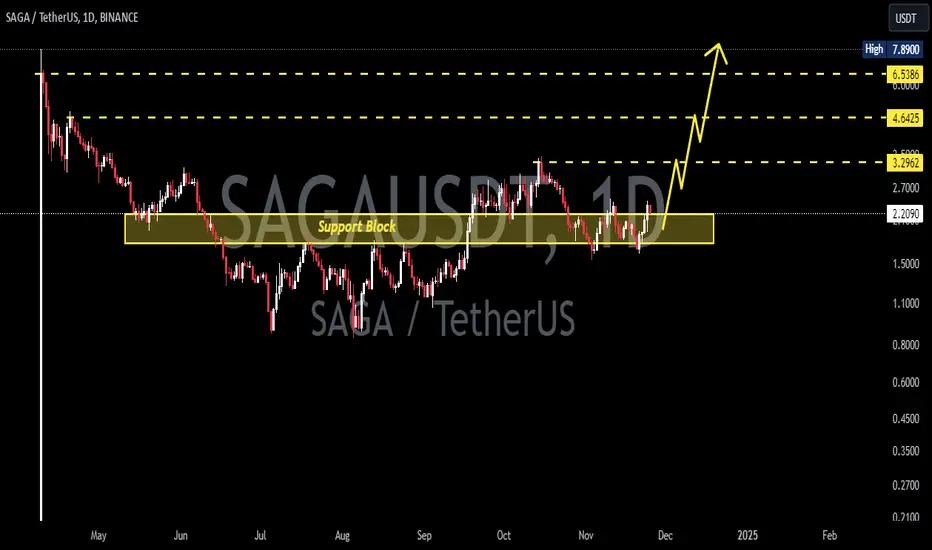
SAGAUSDT 1DSAGA ~ 1D
#SAGA If you still have Conviction on this coin,. This support block would be a very good buying place for now. buy in stages with a target of 15%++
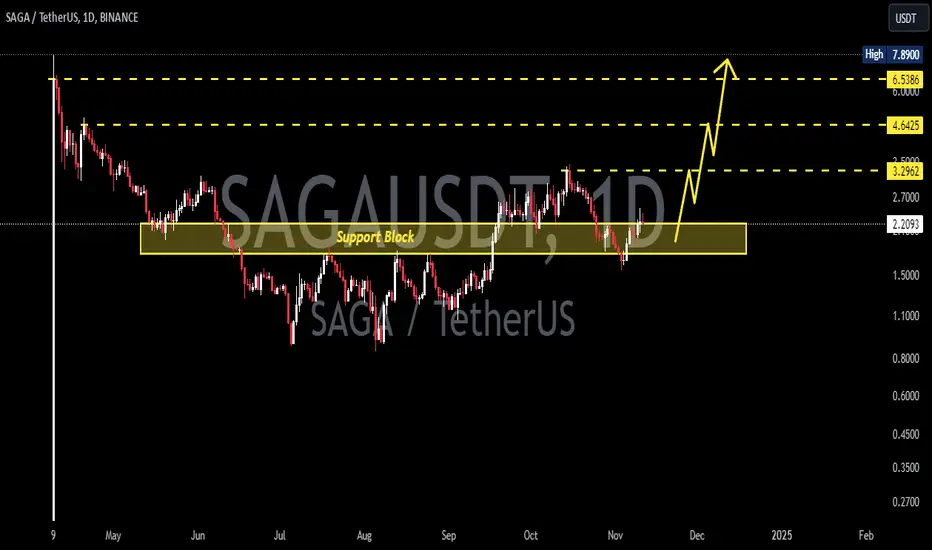
SAGAUSDTSAGA ~ 1D
#SAGA If you still have Conviction on this coin,. This support block would be a very good buying place for now. buy in stages with a target of 15%++
Is SAGA About to Drop? Key Levels to Watch Now!Yello, Paradisers! Is #SAGAUSDT preparing for a potential downturn? Here's what we're eyeing right now.
💎#SAGA After a significant breakout from a critical resistance level, looks poised to revisit the demand zone at $2.21-$2.05. This retest would align with a bullish reversal, potentially pushing the price towards our target in the Bearish Order Block area.
💎However, if SAGA fails to bounce from the demand zone, we could see the price test the support level between $1.78-$1.88. This zone was previously a key resistance level, and a strong rebound from here is likely as the price has yet to retest this support following the recent breakout.
💎If SAGA doesn't rebound and the daily candle closes below $1.77, the bullish outlook will be invalidated, and the price may reverse back into a bearish trend, continuing its downward move.
Only the patient traders who stick to sound strategies will thrive. Discipline is key.
MyCryptoParadise
iFeel the success🌴

btc - Donalt tramp and pump SAGA- bullish structur
- a potential break out the trend line - yellow trendline
- a Bull false break out
-

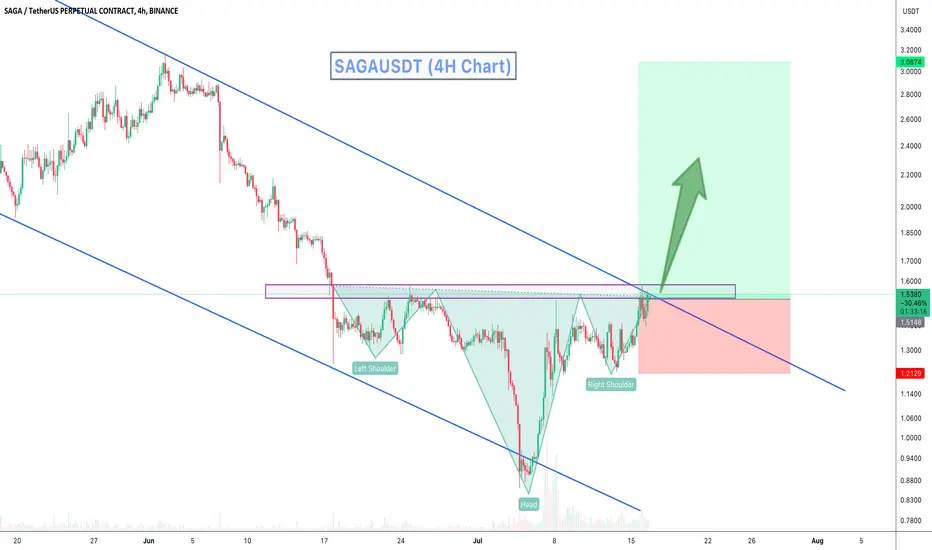
SAGAUSDT Bullish Head and Shoulders PatternSAGAUSDT Technical analysis update
SAGA has formed an inverse head and shoulders pattern on the 4H chart, with the price moving towards the neckline for a breakout. On the daily chart, the price has formed a descending channel. Both breakouts could occur simultaneously. If the price breaks out, we can expect a strong bullish move.
Buy zone : Below $1.55
Stop loss : $1.21
Always Keep Stop Loss
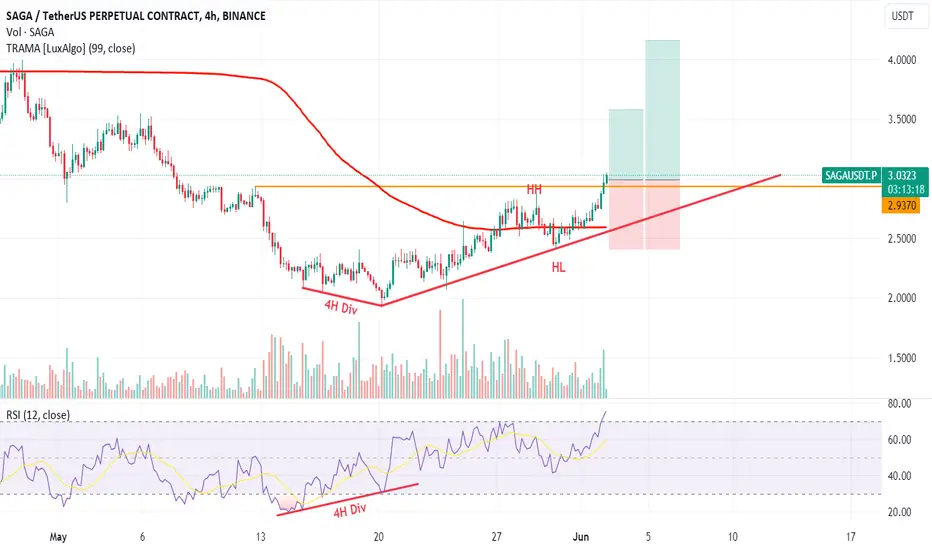
SAGAUSDT BULLISH (Dow, Divergence, Volume)SAGAUSDT shows bullish momentum with 4H Divergence and break of HH based on DOW THEORY. Trade is executed with an entry at CMP, SL at previous HL and R:R of 1:1 & 1:2.
Strategy: Faraz Crypto
What do you think, will it be bullish enough hit 2 TP's.