Saham

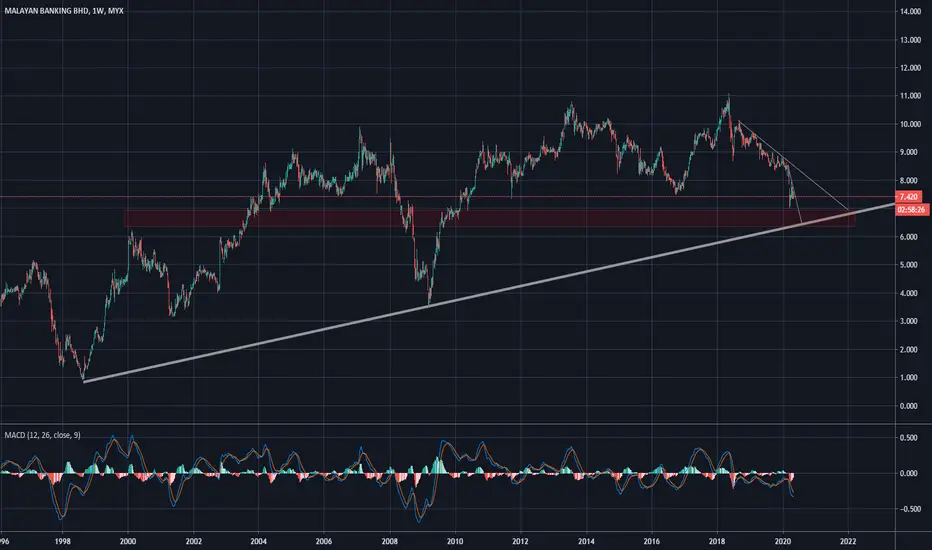
Maybank is interested to test The main Trendline @ RM6.5It could be the best price level to buy and to keep for a few years.
The economy is not collapsing yet,
just a little hiccup caused by a global pandemic
But if it breaks the Trendline then I'll recommend every investor to increase their Gold Reserves quickly.
ADA YANG NUNGGU KEPASTIAN TAPI BUKAN BUAT JADIAN! Overview #IHSG
Sebelum #IHSG break ke atas dan melebihi level resistennya, jangan terlalu banyak berharap deh bakalan ngelanjutin trend (secondary) nya bakalan naik lagi.
Kumpulin Cash dulu aja sementara, jangan gegabah, ntar diambil orang. Eh'
Yang mau belajar dan tau2 info Investasi, yuk mampir ke grup tele kami:
t.me/investmentgeekz
#investmentgeekz

Pos Malaysia RM2.00 by end of 2020.Reason:
Increase in demand
High volume at this level.
Trade at your own risk

Longest Bear market in history for FBMKLCI is about to be made.Bearish market until 2024?
the trader is having no trouble making money in the bearish market but an investor who aims for long term investment is having trouble with this.
EPF, Tabung Haji and ASB earning will be lower each year in this coming few years.
I wish I could be wrong about this as our Rakyat will suffer more than ever but they don't know why.
Everyday is a struggle.
Let me know in the comment section below if you have any questions, the entry will be taken only if all rules of the strategies will be satisfied.
I suggest you keep this pair on your watchlist and see if the rules of your strategy are satisfied.
Buy at your own risk.

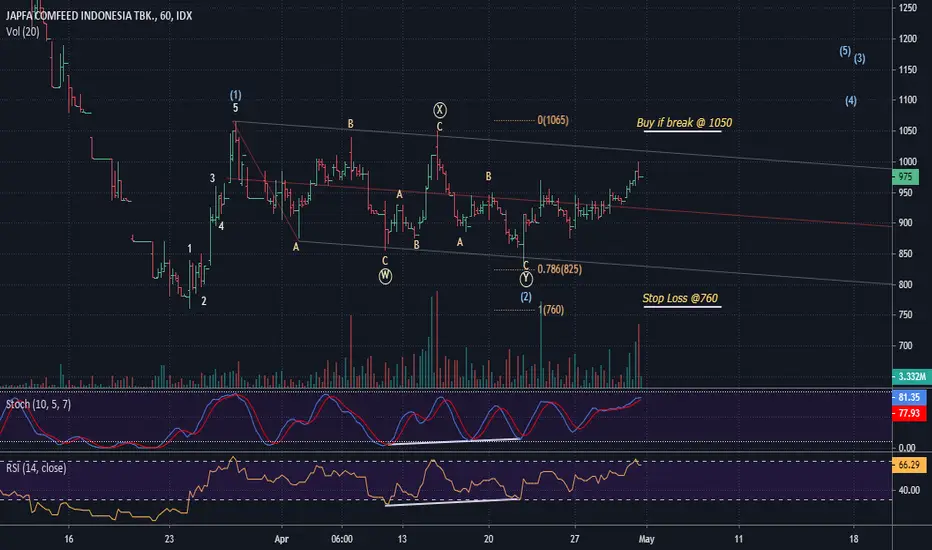
JPFA : Possible upside1 hour chart shows a possible buy setup.
Based on elliott wave principle.
Wave 2 is ended with W-X-Y structure and nicely touch the 0.786 fibonacci retracement level. The price need to break peak of X wave to validate the counting.
Plan
Buy if break 1050
stop loss at 760.
This idea is also supported with bullish divergence on RSI and stochastic.
Cheers & god bless.
Bahasa Indonesia
Chart 1 jam memberikan kesempatan untuk buy dengan alasan perhitungan wave elliott untuk wave (2) bisa jadi sudah selesai dan lanjut naik ke atas (lanjut wave (3))apabila harga tembus puncak X dan keluar dr channel sideway. Pertimbangan wave (2) mungkin sudah selesai adalah dari angka fibo 0.768 yg disentuh ujung Y lalu terpantul ke atas. Plan nya adalah buy saat break 1050 dan stop loss di 760.
Analysis diperkuat juga oleh indikator RSI dan stochastic yang menunjukkan bullish divergence. Semoga analysis ini bermanfaat, god bless.
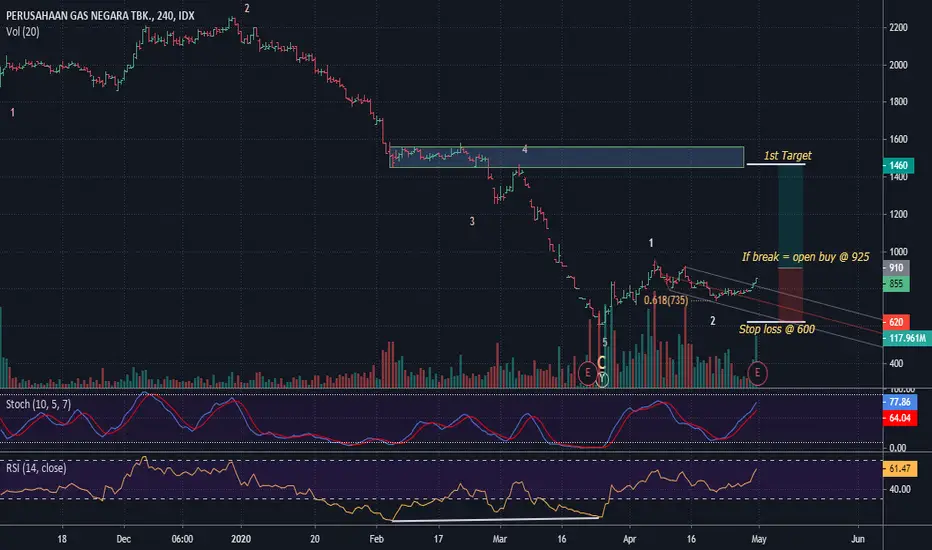
PGAS: Buying Opportunity5 waves down is completed with RSI showing bullish divergence , expect future trend reversal.
The big picture of the major correction may have ended in a complex W-X-Y structure.
The plan is to enter long when price break 925 which is peak of wave b inside of wave 2. Stop loss is set at 600, the first target is at resistance level coincides previous peak of wave 4.
This idea is align with the natural gas price analysis bellow in the description link, hopefully helps, god bless.
Bahasa Indonesia
Trend turun kemungkinan sudah selesai sesuai perhitungan 5 wave, struktur gambaran besarnya seblumnya adalah kompleks wave koreksi W-X-Y . Strategi kali ini dengan masuk saat harga tembus 925 ke atas yang mana adalah peak dari wave b dalam wave 2. Stop loss di 600, target awal di resisten level yang bersinggungan dgn peak wave 4 sebelumnya. Analisis ini sesuai dengan pergerakan harga gas alam pada link di bawah, semoga bermanfaat.

Al-Radjhi Stock Perfect Time To LongOne of the best of my stock which I made tons of money is Al-Radjhi Stock. The price already started to bullish. It is a perfect time to purchase it this 2020 in the beginning of the year. This stock will rise up above SAR80. I am strongly believe this stock will go up in the future.

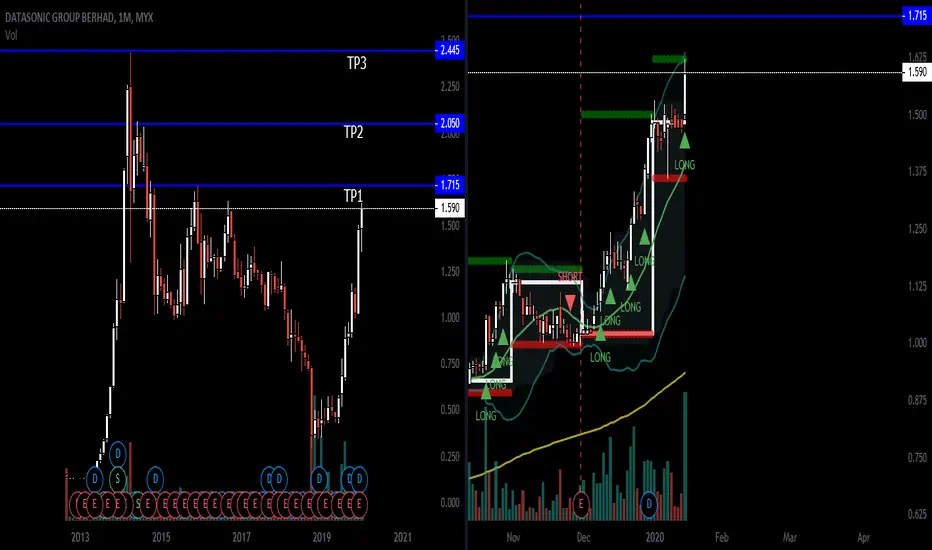
DSONICBreakout from consolidation, stop loss below the swing fractal low. May result in big trend but may take profit in tp1 tp2 or tp3 if the swing still intact. TAYOR.
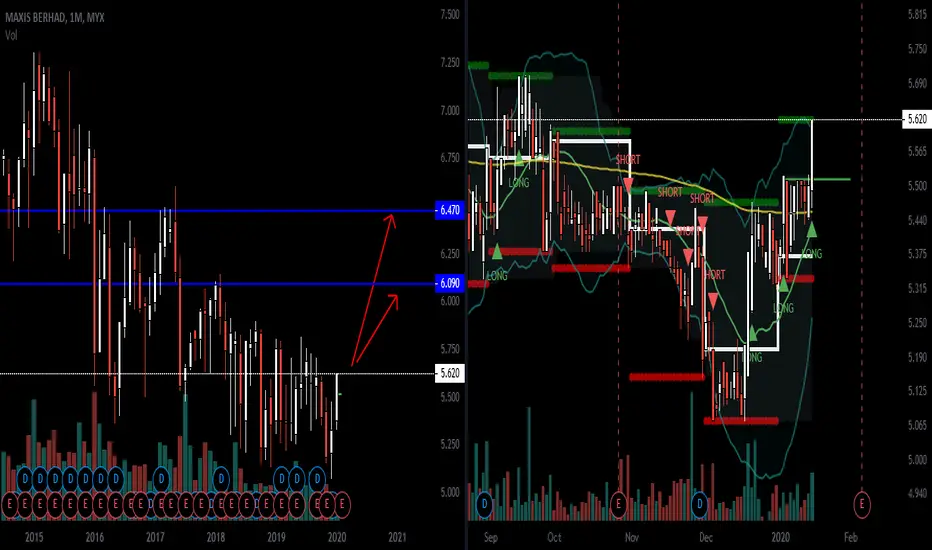
MAXISBreakout after consolidation. Bullish still intact until price close higher low. Good looking breakout, TAYOR.
TOPGLOVGot a lot of volume and making higher high bullish trend is still intake. More room for upside.

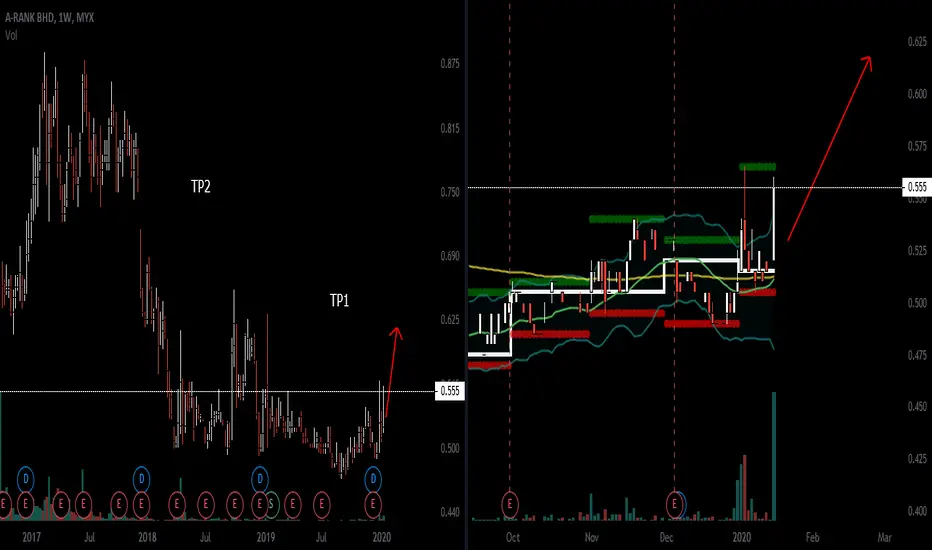
ARANKPossible bullish trend, trail higher low if breakouts occur. Day close bullish above many candles with high volume. TAYOR.
JFTECH breakoutGood looking breakout stocks put stop loss below the higher low and trail it to the moon.

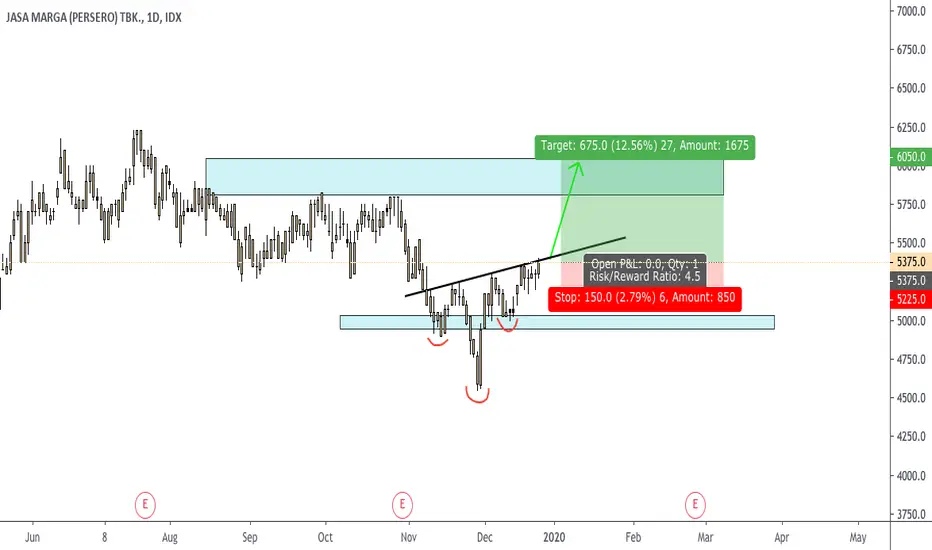
Saham #JSMR - GAS TEROSS SAMPE 12% BOSSQUE!BUY
Range:
5400 - 5450
Stop Loss:
5225 atau dapat disesuaikan dengan PROFIL RISIKO teman2 semua.
Target Profit:
Range:
6000 - 6050
Keterangan:
Membentuk pola Inverted Head and Shoulders.
Berpotensi meneruskan kelanjutan trend naik.
Disclaimer ON
#investmentgeekz
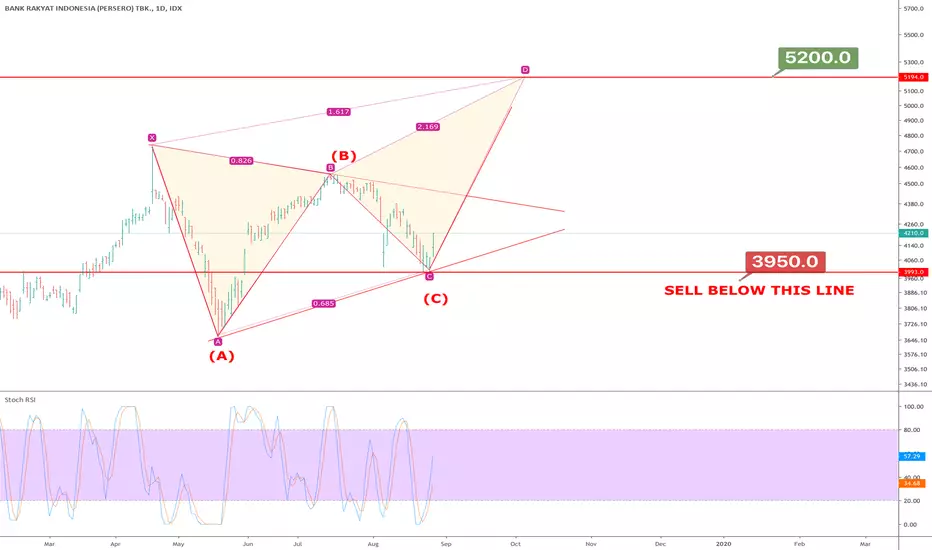
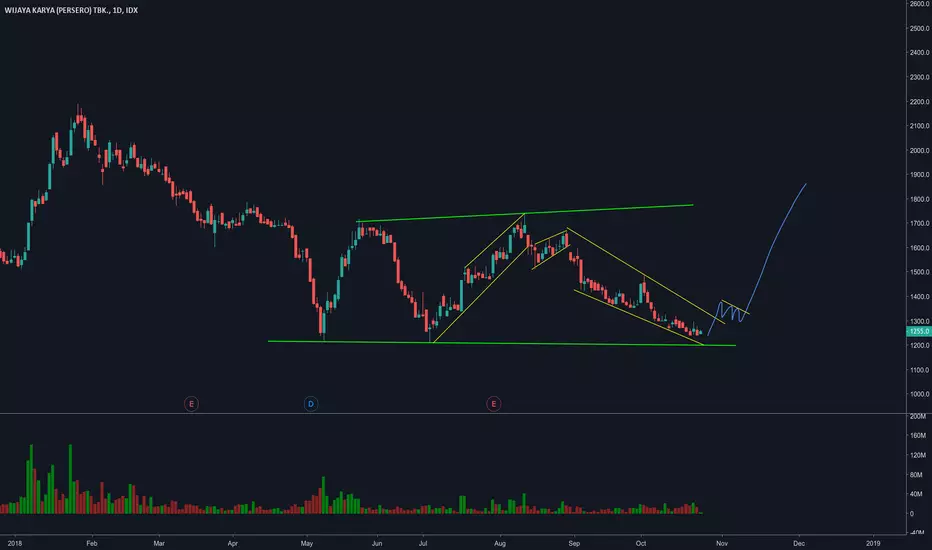
BELI! BBRI KEMBALI KE TREND BULLISH DENGAN TARGET RP5,000Saham BBRI saat ini mulai akan melanjutkan trend bullishnya dengan target harga pada Rp5,200 . Pennant pattern pada skala besar ditambah dengan Hidden bullish divergence menjadi alasan besar saham BBRI untuk berlanjut dalam trend bullish. Buy on weakness. selama tidak turun dibawah 3,950.
Gema Goeyardi,CAT,CFTe,MFTA,CWM
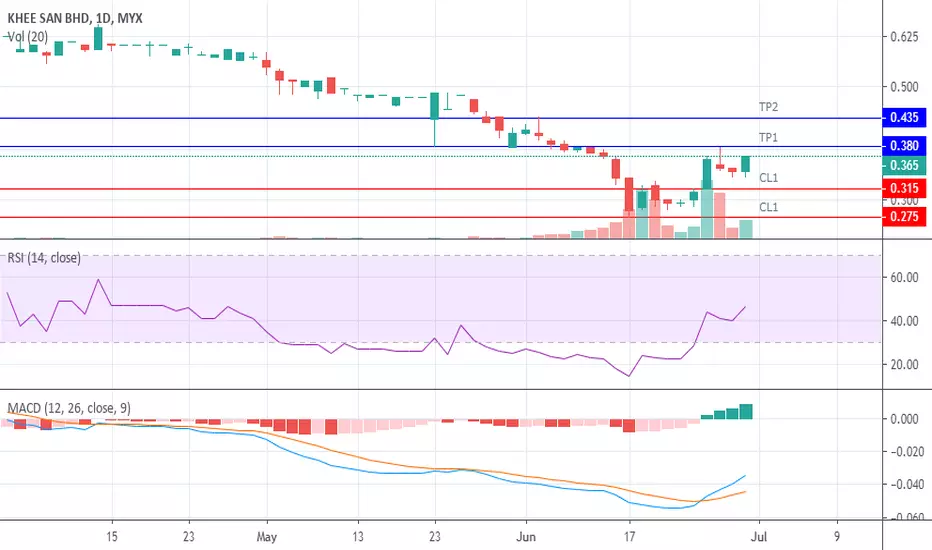
KHEESAN 28 JUN 2019 - Menanti vol buyer untuk tolak harga naikSetelah mengalami fasa downtrend sepanjang 2 bulan lepas, Kheesan di lihat menemui paras support di harga sekitar 0.28-0.285. Minat belian yang
tinggi melalui volume besar sepanjang minggu ini mengambarkan seolah harga mahu menaik lebih tinggi.
Buy : 0.32-0.36
Sell :
TP1 0.380
TP2 0.435
Cut loss :
below 0.315 / below 0.275
Got Debts? let me help you. Here you go MYR 6 billion.Too big to fail.
New PH government will use this company to prove their ability to recover Malaysia GLC and economy.
Buy at your own risk.
let's profit/loss together.


STOCK REVIEW : FRONTKEN CORPORATION BHD (0128)INTRADAY ANALYSIS
Potential buy price above 0.470, on our analysis if they will break the trend line and find the nearest resistance which is R1 (0.510). At this zone (blue), the decision price either to continue bullish break the resistance zone to find another resistance R2 (0.550) or do rejection at this zone. If rejection, you must TP in here.
Analysis from our team, Ghibli & Co. Hedge Fund Capital (Malaysia).
Any inquiries about investment/analysis please contact us ghiblico.my@gmail.com

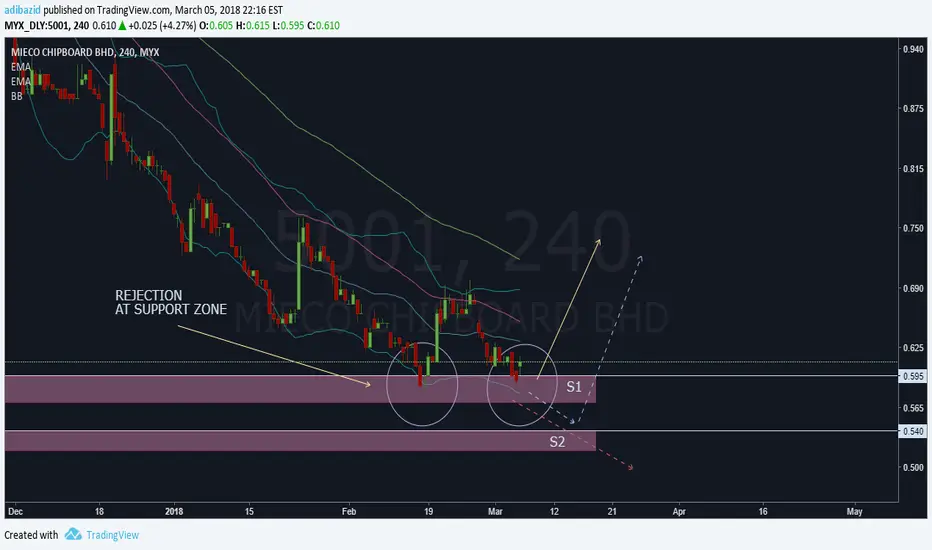
STOCK REVIEW : MIECO CHIPBOARD BHD (5001)INTRADAY ANALYSIS
Two times rejection? possibility change the trends? We will see, if they break through support zone S1 & S2. It means, the continue bearish trend. But if they do rejection at this zone. It's time to BUY this stock.
Analysis from Ghibli & Co. Hedge Fund Capital (Malaysia).
Any inquiries about investment/analysis please contact us ghiblico.my@gmail.com
STOCK REVIEW : MIKRO MSC BHD (0112)INTRADAY ANALYSIS
Bearish mood is ON, because they already break support zone at price 0.385.
They will continue find the nearest strong support, at price 0.345.
After that we can make decision from that, continue bearish or change to bullish mood.
Analysis from Ghibli & Co. Hedge Fund Capital (Malaysia).
Any inquiries about investment/analysis please contact us ghiblico.my@gmail.com
