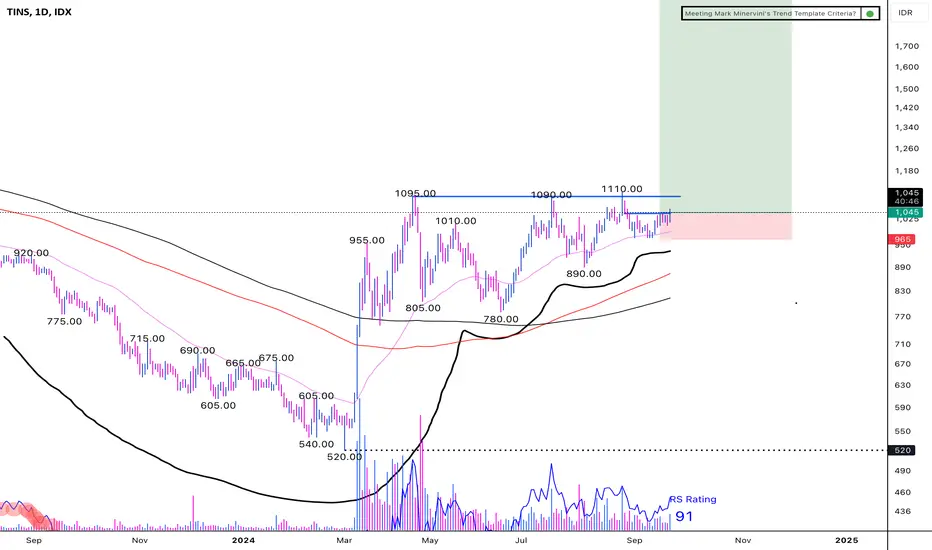
TINS - (VCP 61W 110/14 4T)IDX:TINS (VCP)
23-09-2024
(+):
1. Low risk entry point, cheat buy on pivot point
2. Volume dries up
3. Confirmed Stage 2
4. Price above MA 50 > 150 > 200 over 10 weeks
5. Price is within 25% of 52 weeks high
6. Price is over 30% of 52 weeks low
7. 200 day MA trending up over 1 month
8. RS Rating is over 70 (91)
(-):
1. The breakout on pivot point is not big enough
Saham
PEVE - VCPIDX:PEVE - VCP
13-09-2024
1. Low risk entry point
2. Cheat buy on pivot point
3. Volume dries up
4. Price above MA 50 and 200
5. VCP characteristic

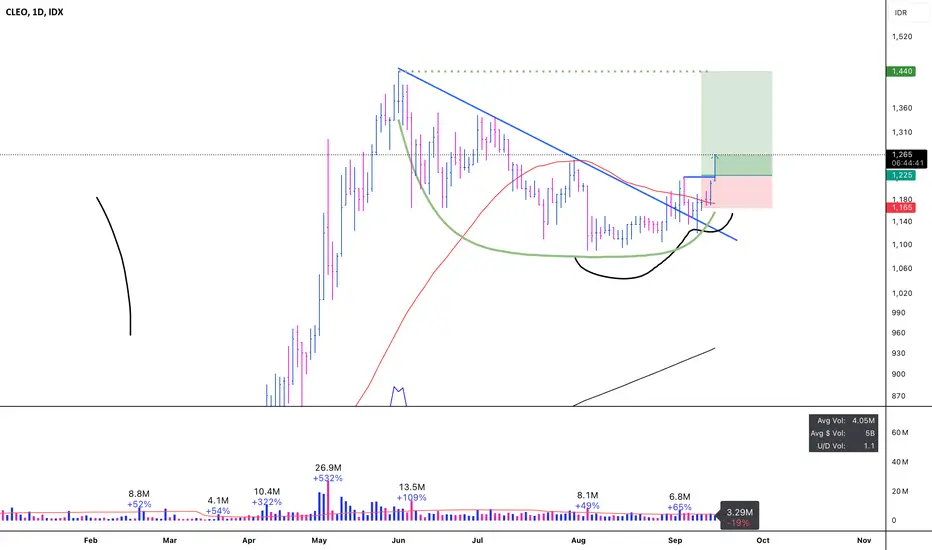
CLEO - CUP WITH HANDLEIDX:CLEO - CUP WITH HANDLE
I bought this stock
13-09-2024
Reason to buy:
1. Cup with handle breakout
2. Confirmed stage 2
3. Volume dried up
4. RS Rating > 80
5. Price above MA 50 and 200
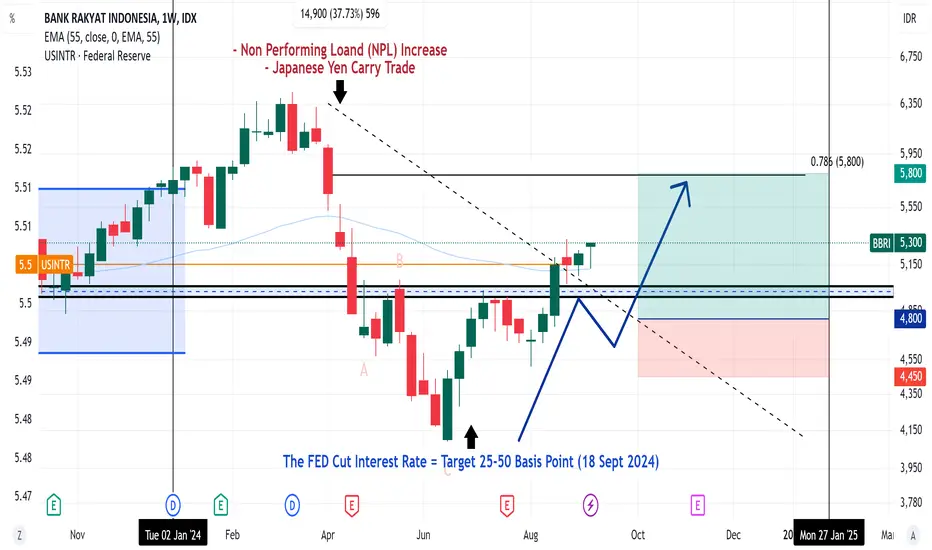
BBRI Signal Strong Bullishbuy, sleep, 2025=WakeUp
kalian dapat set stop lost sesuai analysis berikut
let's go Q4 Rally !!!!
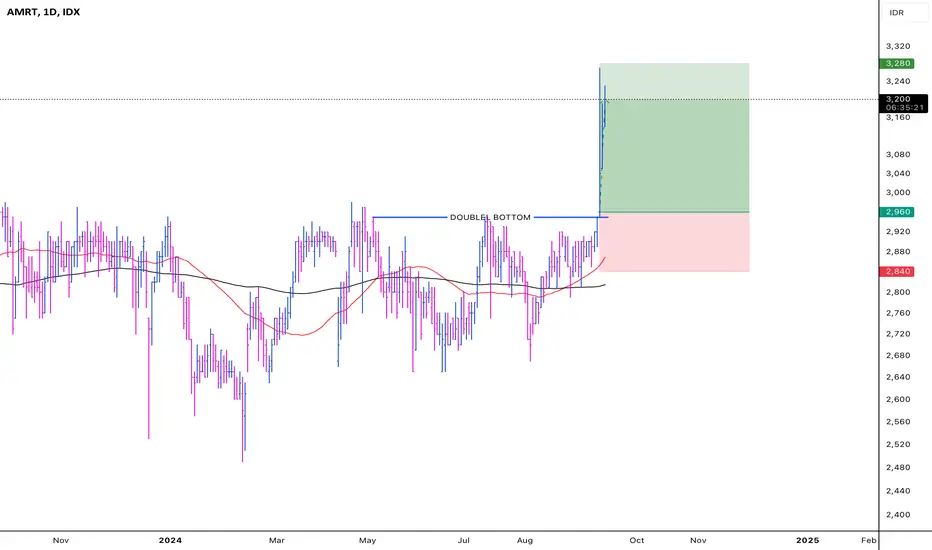
AMRT - Double BottomIDX:AMRT - DOUBLE BOTTOM
I bought the stock
10-09-2024
Reason to buy:
1. Double bottom break out with huge volume
2. Price over 50 and 200 MA
3. Low risk entry point
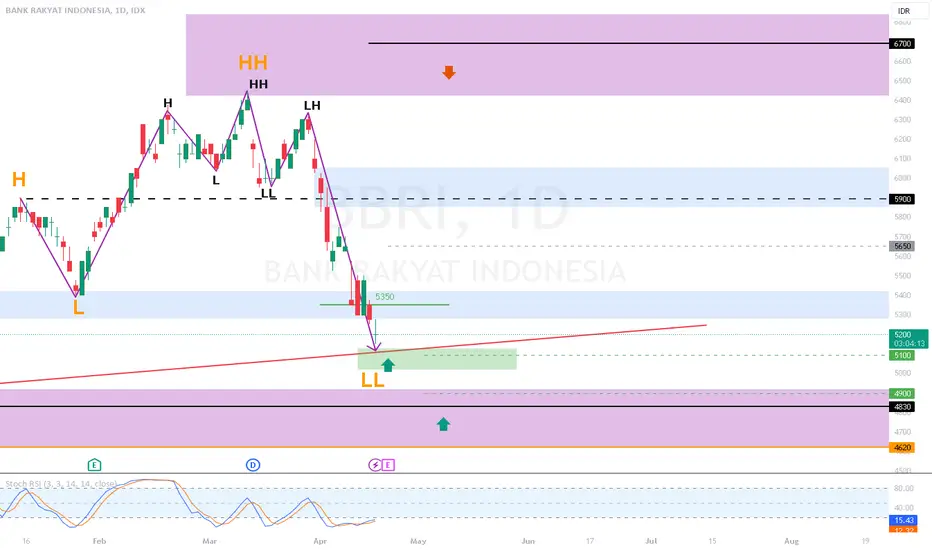
BBRI 22 Apr overall risk:
the price already creating LL (orange) the risk is higher for me.
Strong support range 4830~ 4620 bottom purple box
but this is our chance to get discount price at LL / shadow MN. hoping it can reach the shoulder at minimum next month.
24Apr Earning & Revenue
Buy price:
-H4 fib & TL can be our buy range: 5100
-Also prepare for avg down if 24Apr report is red / under than estimate.
safety buy, wait D1 closed above 5350 then buy at retrace.
Target:
T1 5650
T2 5900
T3 as invest
no CL for me as long as the price D1 still above 4600 (+-10% SL). just play with the cap as long as your holding Avg price under 5650.
Disc: SL max at your own Money management plan
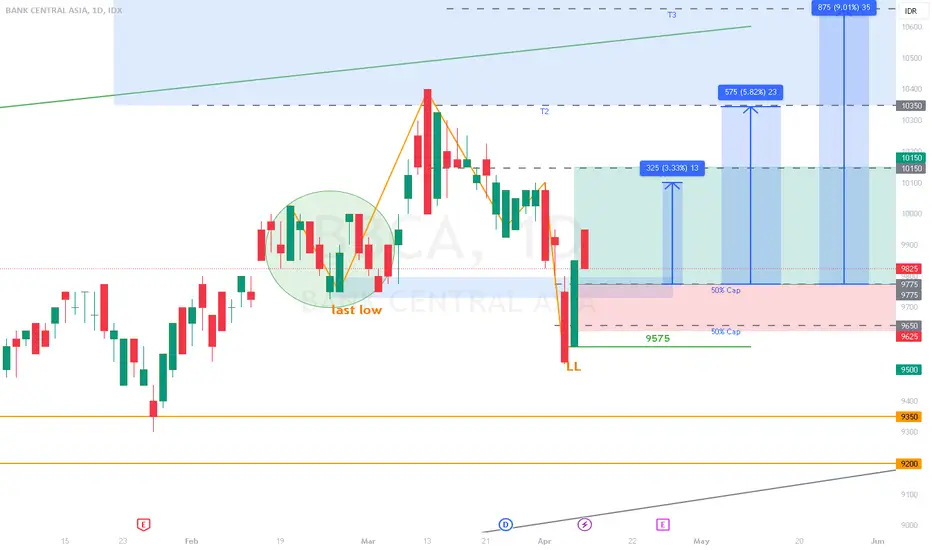
BBCA 5 APRthe last BBCA map already closed BEP (-0%)
yesterday price closed above 9775
this chart is 2nd try with new buy area.
remember that at this time, the wave already create new LowerLow means the risk is higher.. do your MM
or wait when the price near 9300 or above 10100 area if you dont want to take risk at current position.
Buy area 9775 ~ 9625
Price under 9575 = CL BEP or 9700
risk still the same, lower TL and SBR higher TF 9350 ~9200
ADRO 18 April 24Break up R & TL MN
Buy or Avg up 2720 50%cap ; 2700 50% cap
T1 2820 (Inside bar)
T2 2930 (next R)
T3 wait break up T2
Escape plan:
D1 closed under 2660 = CL BEP or at 2690.
SL is your MM tolerance
Risk : Wedge , liquidation
Support 2620

ICBP (MONTHLY) ELLIOT WAVE PREDICT : END OF ABC CORRECTION?ICBP most likely will make an impulsive movement (5 wave rally) after the big correction (ABC correction).
The new 5 impulsive movement is on the way and will take ICBP to new All Time High.
There is Falling Wegde Pattern too (Continuation Pattern), and the Stochastic in monthly indicate the price is already in Oversold area and start crossing + Bullish Divergence
But this is Monthly Chart we are talking about so just be Patient because it will takes Months or maybe Years.
But we know the Trend will became Bullish in Long game.
In Short ICBP Have
Trend : Bullish 5 Wave Rally
Pattern : Falling Wedge
Stochastic : Oversold (Already Crossing) + Bullish Divergence
TARGET PRICE 12575 or HIGHER (ALL TIME HIGH)
DISCLAIMER ON

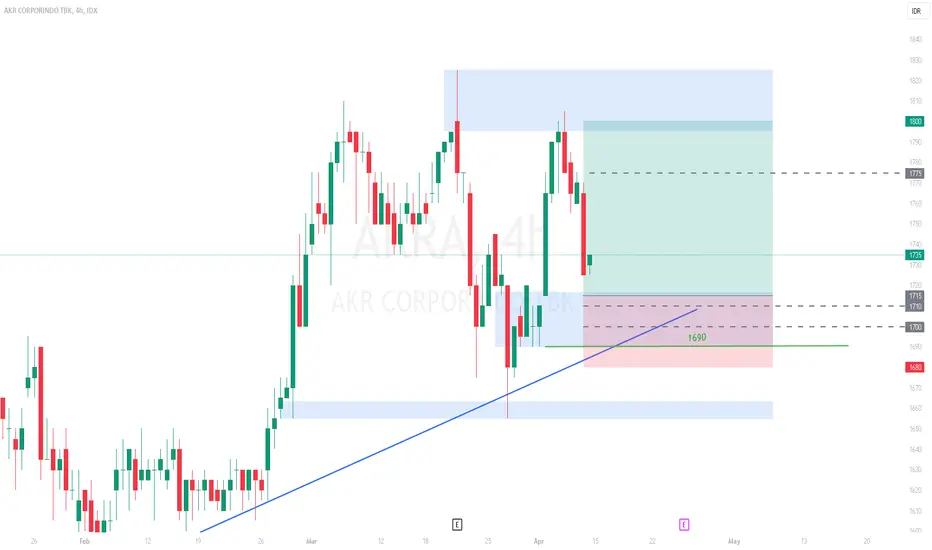
AKRA 5 Apr 24AKRA watch under 1715 or above 1825
Buy area 1715 ~ 1690..
H4 closed under 1690 OR D1 closed under Blue TL = CL BEP. then wait for price closed above 1700
GOTO: Price Action Analysis After TikTok's AcquisitionTikTok, owned by ByteDance Ltd., has entered into a significant agreement to invest $1.5 billion in a joint venture with Indonesia's GoTo Group. As part of this deal, TikTok will acquire 75.01% of GoTo's PT Tokopedia for $840 million. This strategic move involves integrating TikTok Shop's Indonesia business into the expanded entity, marking TikTok's return to the e-commerce landscape in Indonesia. The partnership aims to navigate and strengthen the online retail market, presenting a substantial investment by TikTok in the region. The acquisition is set to reshape the e-commerce landscape and boost market competition.
The initial market response has been negative, potentially influenced by profit-taking after a strong run-up. Some analysts believe the negative sentiment could stem from concerns regarding the impact of the acquisition on both TikTok and Tokopedia's market positions.
Now, Let's delve deeper into the technical analysis of GOTO
After facing multiple rejections around a significant resistance area and a dynamic resistance line (EMA 200 Line), the price exhibited the formation of a rising wedge pattern. This pattern, marked by two converging upward-trending lines, saw a subsequent breakout characterized by a bearish Marubozu candlestick and a notable increase in trading volume. This occurrence suggests a continuation of the bearish trend, emphasizing the strong selling pressure in the market. The confirmation of this potential bearish scenario is further supported by the MACD Indicator, which exhibited a death cross. The convergence of these technical signals indicates a robust indication of ongoing bearish momentum toward the target area.
It is essential to note that the analysis will no longer hold validity once the target/resistance area is reached.
Disclaimer:
"Please note that this analysis is solely for educational purposes and should not be considered a recommendation to take a long or short position on IDX:GOTO ."
Please support the channel by engaging with the content, using the rocket button, and sharing your opinions in the comments below!

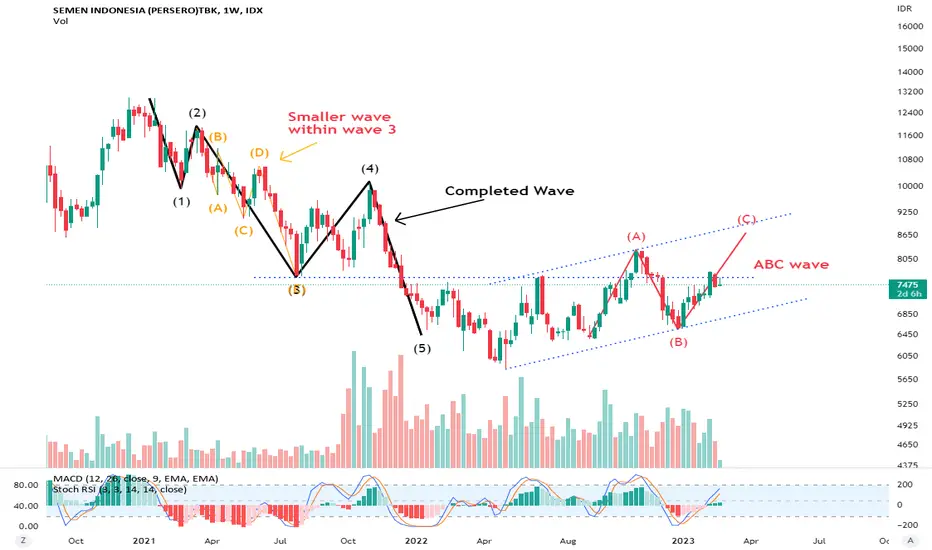
SMGR completed wave and in progress of ABC waveSMGR look to complete the ABC wave.
I'm not export in wave, just share my personal ideas only.
Hope it works out.
AUTO journey to complete next wave. See previous post as wellAs stated in previous posting, AUTO has completed the small wave and looking for bigger wave completion.
Still long journey but hope for the best.

BBRI : Rebound, Targeting Rp5750 pre-2024 Election VolatilityOn November 1, 2023, Bank Rakyat Indonesia (BBRI) stock exhibited a notable touch on the lower trendline at Rp4930. This technical analysis delves into the implications of this touch, marked by a bullish pattern and rapid ascent, further substantiated by the stock's position above the Exponential Moving Average (EMA) 200 and a positive MACD crossover. The objective is to explore the basis for the continuation of the upward trend with a potential target range of Rp5750 before the anticipated market volatility preceding the 2024 Indonesian elections.
Technical Analysis:
Lower Trendline Touch and Bullish Pattern:
- The touch on the lower trendline at Rp4930 signals a substantial support level, suggesting a potential trend reversal.
- The emergence of a bullish pattern reinforces the positive sentiment, indicative of a swift upward movement.
EMA 200 Position:
- The stock's positioning above the EMA 200 signifies a robust long-term momentum.
- The close proximity of the stock price to the EMA 200 provides additional confirmation of the potential for a sustained upward trend.
MACD Conditions:
- The MACD exhibits a bullish condition with a crossover of the signal line to the upside and a positive histogram.
- The bullish signal from MACD supports the notion that buyer momentum is on the rise.
Upside Target:
Upper Target (Resistance):
- Given the confirmation from the trendline, EMA 200, and MACD, the initial upside target is set around Rp5750 or higher.
- This level encapsulates potential technical resistance that the BBRI stock may encounter during its upward trajectory.
Additional Analysis:
Supplementary Indicators:
- Further confirmation from auxiliary indicators like RSI and trading volume is recommended to provide a comprehensive view of trend strength and market participation.
Market News Monitoring:
- The potential for market volatility leading up to the 2024 Indonesian elections underscores the importance of vigilantly monitoring market news and political developments.
Risk Considerations:
Stop-Loss:
- Effective risk management involves placing a stop-loss beneath the trendline or support level.
Conclusion:
In conclusion, BBRI stock presents a compelling case for a continuation of its upward trajectory, supported by the confirmation from the trendline, EMA 200, and MACD. With a potential upside target of Rp5750, investors should remain vigilant as the market navigates the uncertainties leading up to the 2024 Indonesian elections. Regularly updating analyses in response to evolving market conditions and seeking advice from financial professionals is advisable before making investment decisions.

SIDO: Breakout of Bearish Channel, Bullish Outlook Ahead?Hello Fellow Stock Traders, Here's a Technical Analysis of SIDO!
Industri Jamu & Farmasi Sido Muncul (SIDO) has demonstrated significant price development by breaking out of its bearish channel. This price action indicates the beginning of a bullish trend in the stock, accompanied by a bullish candlestick pattern and increased trading volume.
Moreover, the bullish outlook is further supported by the appearance of a golden cross on the MACD Indicator. The presence of a golden cross in this context typically suggests a higher probability of upward movement toward the target area.
Considering these technical factors, the current price action, and the indicators, a positive outlook is projected for SIDO. This suggests a potential upward trajectory in the near term.
It is essential to note that the analysis will no longer hold validity once the target/support area is reached.
Please support the channel by engaging with the content, using the rocket button, and sharing your opinions in the comments below!
Disclaimer:
Please note that this analysis is solely for educational purposes and should not be considered as a recommendation to take a long or short position on $SIDO.

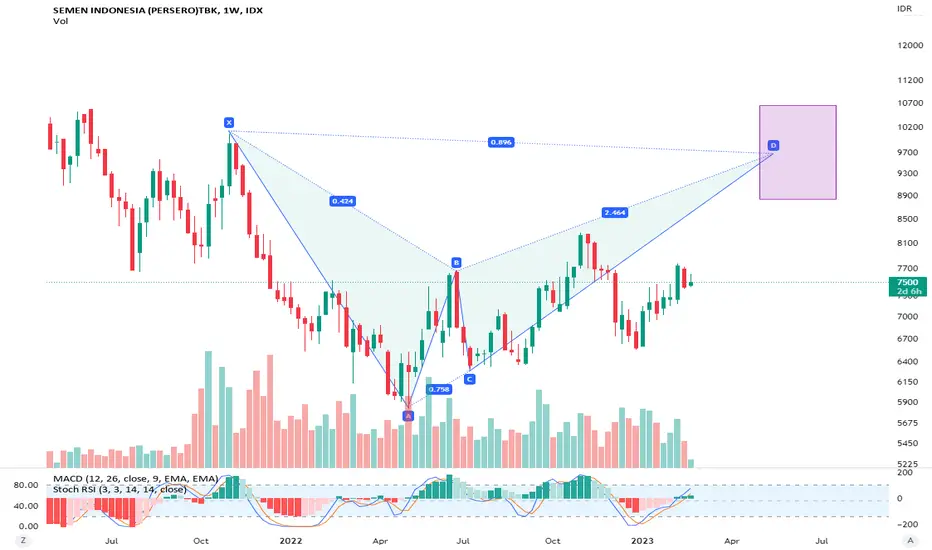
SMGR bearish BAT pattern. inline with ABC wave posted earlierSMGR on the way forming the bearish BAT pattern, happens to be inline with completing ABC wave posted earlier. (see earlier post)
Not harmonic or wave expert. Just sharing my personal ideas.
Hope it works out well.
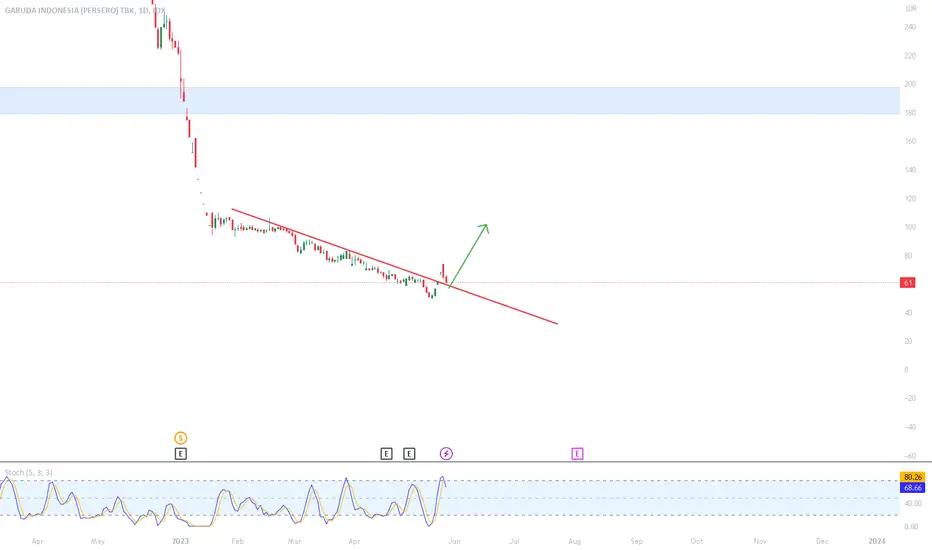
GIAA garudaCP down . a bit risk, but consider this big company with cheap price now.. 1 hit 1 kill minimum to 100 up to 180, above this consider investment , GGIA will Collab with Singapore Airlines
Price to buy, under 60
Resist / TP @ 100 , 150 , 180
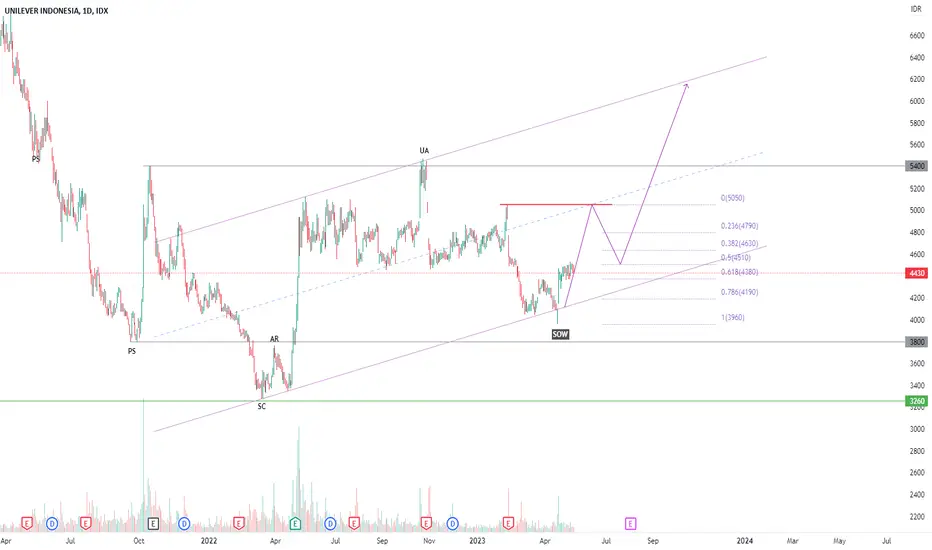
UNVR forms a wyckoff diagonal accumulation scheme ??UNVR is a consumer goods stock listed on the Indonesia Stock Exchange. UNVR forms a wyckoff diagonal accumulation scheme ?? currently the diagonal scheme is still unstable and may form horizontal. while waiting for that certainty, the price will try to touch the level of Rp. 5,000 before falling again.
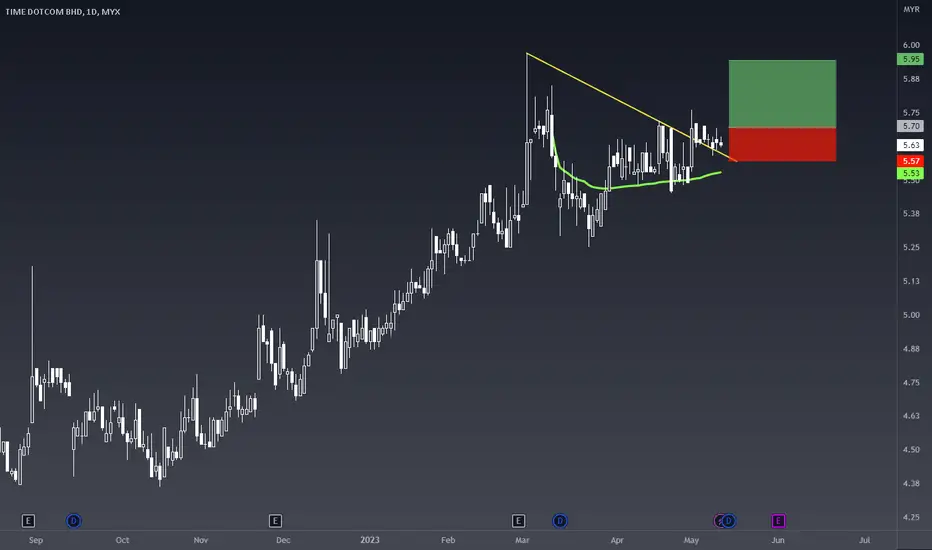
TIMECOM awaiting breakout to the upsideMYX:TIMECOM awaiting a breakout of RM5.70 to the upside. Initial targets being RM5.95 with stops below RM5.58.
These are my views and analysis and is only used for educational purposes. I am not a financial advisor.
Nothing in the information posted here is intended to be or should be interpreted as trading advice.
HEXTECH awating breakout2022's multibagger stock MYX:HEXTECH has seen consolidation since the start of 2023. Keeping my eye on a breakout of 23.66, with stops at 22.26 and targeting towards 27.06 area.
These are my views and analysis and is only used for educational purposes. I am not a financial advisor.
Nothing in the information posted here is intended to be or should be interpreted as trading advice.

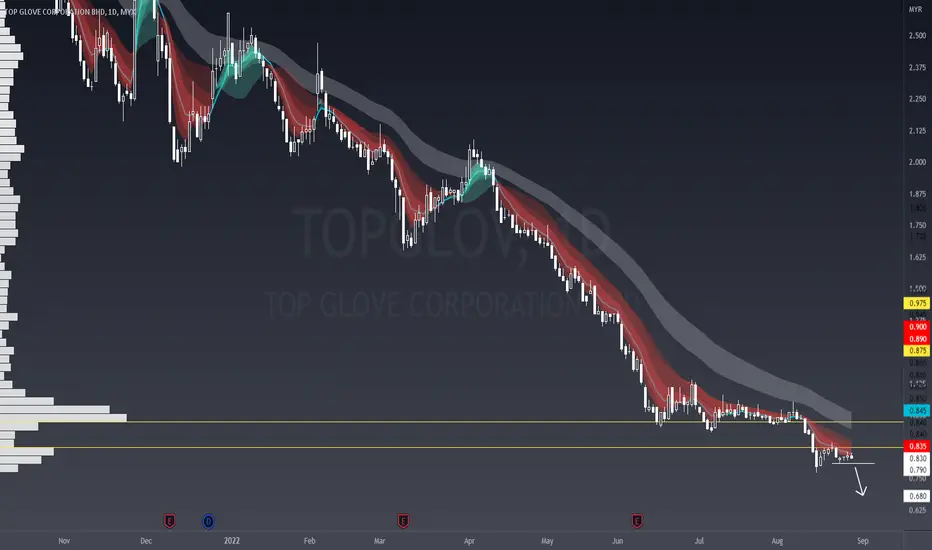
TOPGLOV: Downtrend continues?Back when MYX:TOPGLOV was trading at RM7.29, I posted and idea of a downtrend forming. People laughed.
After a few more other update posts, it is now trading below the RM1 mark. Expecting prices to tumble further if it manages to break below RM0.81.
Denial does not make the stock rebound. Why not trade what we see instead of what we think?
TLKM: Inverted Head & Shoulders, Trend Reversal Scenario?Hello Fellow Global Stock Trader, Here's a Technical outlook for TLKM!
Price Action Analysis
On the Daily Timeframe, TLKM is moving above EMA200. Then, the stock created a breakout of the inverted head & shoulder, indicating a trend reversal. The MACD Indicator created a hidden bullish divergence, signifying a possible upside movement to the target area.
All other explanations are presented on the chart.
The roadmap will be invalid after reaching the target/support area.
Support the channel by smashing the rocket button and sharing your opinions in the comment below!
"Disclaimer: The outlook is only for educational purposes, not a recommendation to put a long or short position on the TLKM"

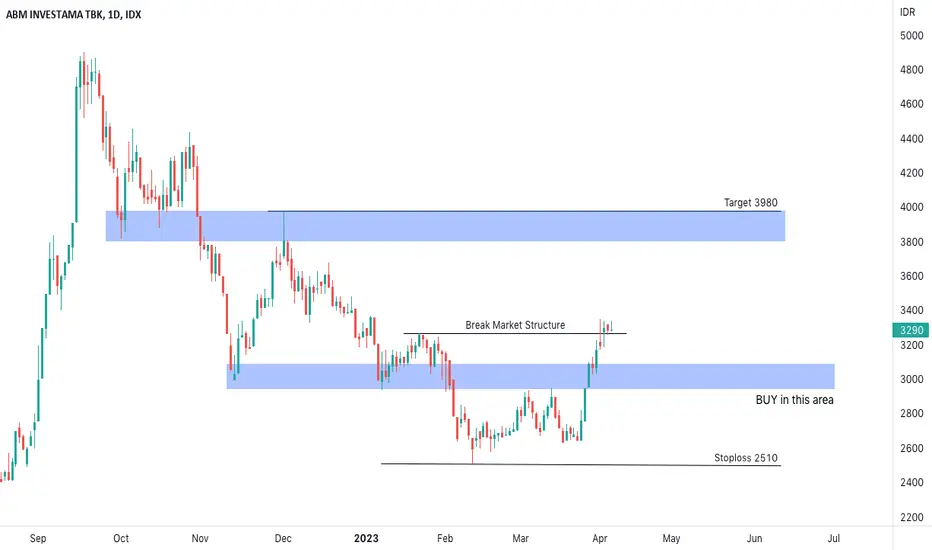
ABMM Breakout Market StructureABMM finally breakout major market structure which is good indication as reversal trend. Waiting for the confirmation, BUY if throwback to the blue area.
Watch out for the Target Zone and StopLoss area.
*disclaimerON