MEDC: Commodity Stocks Still Has a Chance to Create New High?Hello Fellow Stock Trader and Investor!
Price Action Analysis
MEDC has moved above the dynamic trendline and bullish trendline. The breakout of a falling wedge pattern indicates a possible upside movement ahead. Furthermore, the momentum indicator makes a golden cross, signifying a possible upside movement to the target area.
All other explanations are presented on the chart.
The roadmap will be invalid after reaching the target/ support area.
"Disclaimer: The outlook is only for educational purposes, not a recommendation to put a long or short position on the MEDC"
Saham

PMMP: Breakout With Volume Spike,Sign of Optimism in the Market?Hello Fellow Stock Global Trader/Investor!
Price Action Analysis
PMMP has broken out of the bearish channeling pattern. The breakout accompanies by the Volume Spike and Bullish Marubozu Candlestick. The MACD Indicator made a death cross, signifying a possible upside movement to the target area.
Fundamental Drives
1. Indonesia Ended the Covid Restrictive Policy on December 2022
2. Indonesia's economy advanced by 5.72% YoY in Q3 of 2022, indicating a recovery from the pre-pandemic era.
3. PMMP Target a 25% Revenue Growth By the End of 2023.
All other explanations are presented on the chart.
The roadmap will be invalid after reaching the target/support area.
"Disclaimer: The outlook is only for educational purposes, not a recommendation to put a long or short position on the PMMP"

CPIN: Poultry and Consumer Defensive Stocks Possible Bull Run?Hello Fellow Stock Global Trader/Investor! Here's Technical Outlook on CPIN
Chart Perspective
CPIN is moving in the bullish continuation. The breakout of the bearish trendline and bullish flag indicated a potential bullish bias ahead. Furthermore, the momentum indicator made a golden cross, indicating a possible upside movement to the target area.
All other explanations are presented on the chart.
The roadmap will be invalid after reaching the target/support area.
"Disclaimer: The outlook is only for educational purposes, not a recommendation to put a long or short position on the CPIN"

Long Term Outlook about BBRI - BULLISH TREND# First of all, Disclaimer on. This is not advice to buy or sell the stock. Only sharing about my outlook point of view.
Here, let me explain my long term analysis about BBRI banking stock in Indonesia in Technical Point of View.
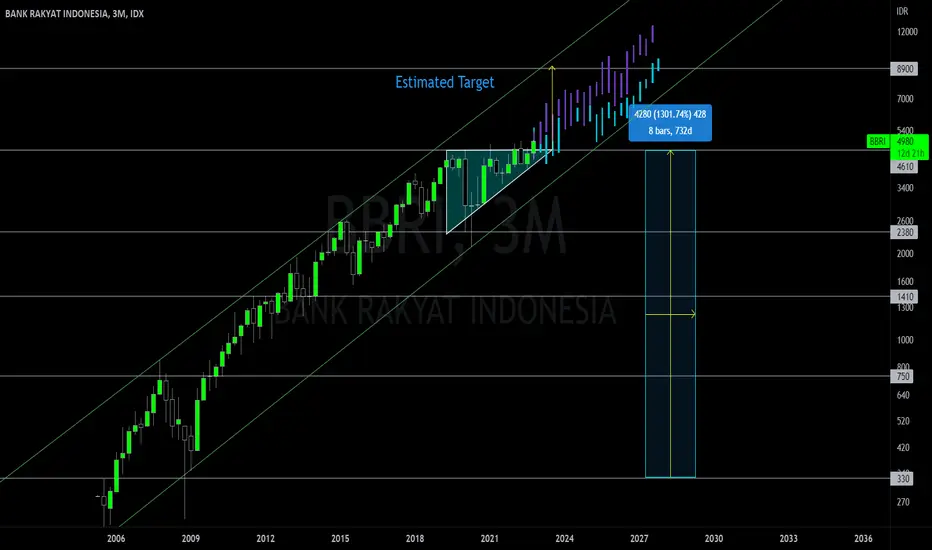
1. So the first, I draw my support and resistance line based on candlestick on 12M or 1 Year timeframe. You can also look at the 12M timeframe. I put it in 5 line, there are 330, 750, 1410, 2380, and 4610 IDR.
2. Next step, I will predict the next resistance using average return between 5 line (4 step return in log), You can see the return between 4610 and 330 is 1300%. That's so amazing return for invesment. Then, because I use logarithmic SnR, I can calculate the next resistance based on this formula.
Avg return SnR = (1 + return )^(1/4) - 1
we've got the avg return is 93,5%.
3. After that, I will do the price resistance projection using avg return that we have done before. 4610 * 1,935 = 8920 around 8900
4. The others perspective using chart pattern, you can also look on the chart. That is ascending triangle pattern. So we can predict the next price target with copying the length of triangle to the next upper 4610 . Also we've got the value around 9000.
5. I have copied the chart to do the projection of price movement with optimism scenario and slow scenario. The price target result of 8900 IDR will be achieve between 2025 and 2028.
LQ45: POTENTIAL BRIGHT BULLISH OUTLOOK FOR INDONESIA STOCKSHello Enthusiast Indonesia Stock Investor/Trader. Here's free outlook for potential Index Movement. Please give us thumbs up, follow, and comment your opinion on the outlook to support the channel. Let's GROW TOGETHER to become matured trader :)
LQ45 is an Indonesia Stock Market Index which consists of 45 liquid traded stocks. LQ45 could be use as an indicator for forecasting potential Indonesia stock outlook.
LQ45 has broken out of the bullish flag. Afterwards, LQ45 retested the structure and broke out of the near resistance. The MACD indicator already crossed above the zero level area, it signify the potential bullish bias on the index.
The roadmap will invalid after exceeding the support/target area.
DISCLAIMER:
THIS IS NOT A RECOMMENDATION TO BUY OR SELL THE INDEX.

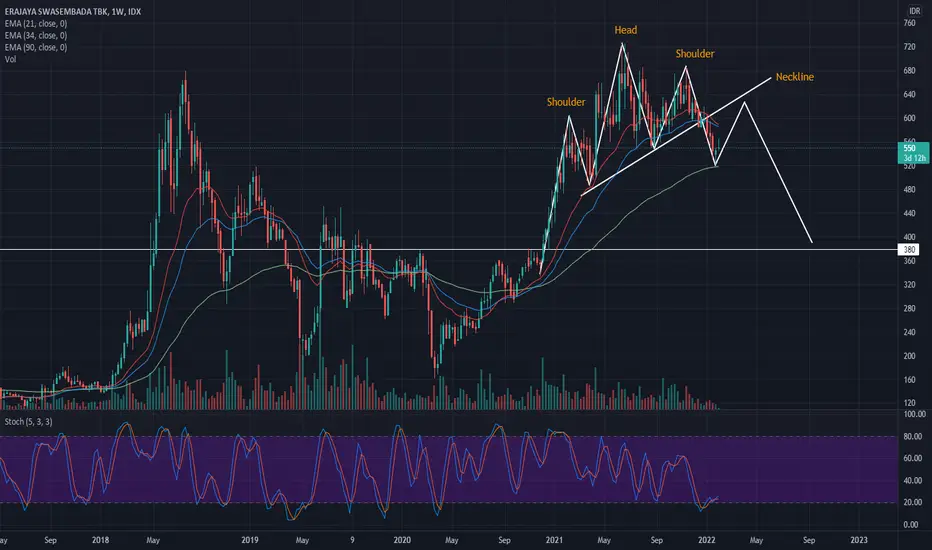
IDX : ERAA BREAKING THE HEAD N SHOULDER PATTERN !!ERAA weekly chart show us that there is Head and Shoulder pattern (Reversal Pattern From Bullish To Bearish) and already break the H n S neckline.
Thats mean ERAA will going to the target area HnS at price 380-390 in the long game (Weekly).
Stochastic indicator in weekly already Oversold, so there is a chance price will have a short Rebound to the Neckline Area.
Disclaimer ON.
INKP: The Advancing Phase & Recovery After Covid-19 Pandemic EraHello Fellow Global Stock Investor/Trader, Here's a Technical outlook on Indah Kiat Pulp & Paper!
Support the channel by giving us a thumbs up and sharing your opinions in the comment below!
Technical Analysis
The Previous Breakout of the Bearish Trendline is confirmed as the starting point of the bullish trend. After breaking out of the bearish trendline, INKP has broken out of the bullish continuation pattern (Pennant) with an impulsive rebound on the upper trendline, indicating a possible upside movement ahead. Furthermore, stochastic made a golden cross, signifying a potential upside movement to the target area.
Fundamental Drives
Increased 65.58% of its Net Income (Compared to his latest 9 Months Performance in 2021)
All other explanations are presented on the chart.
The roadmap will be invalid after reaching the target/support area.
"Disclaimer: The outlook is only for educational purposes, not a recommendation to put a long or short position on the INKP"

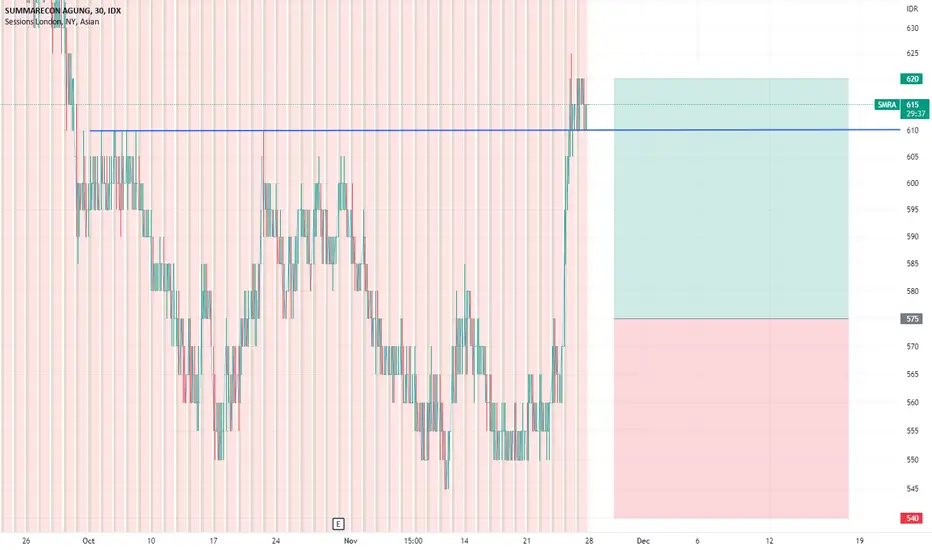
Beli SMRA!Beli SMRA area 575-570 karena sudah menembus Resistence 610.
Stoploss di 540 dengan Target Profit di 620.
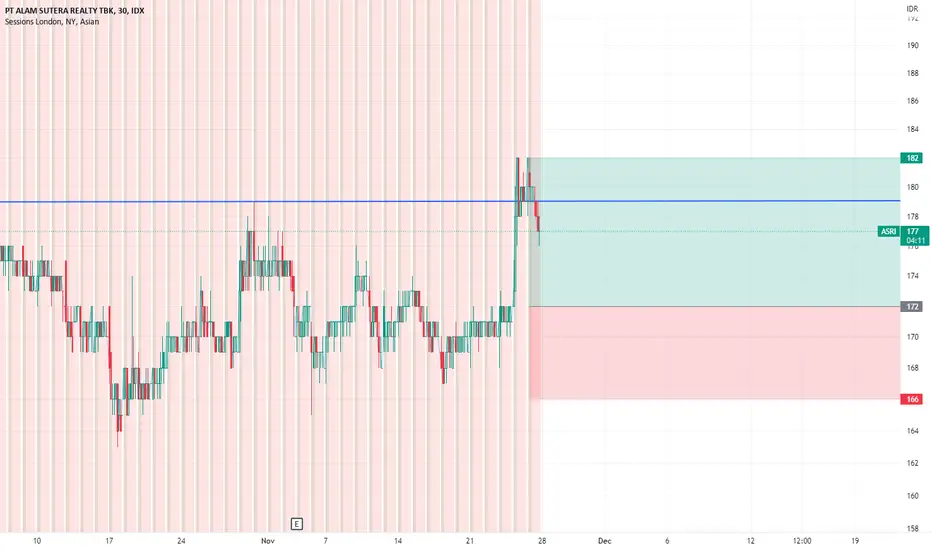
Beli ASRI!Beli ASRI di area 172-170 karena sudah menembus Resistence di 179.
Stoploss di 166 dan Target Profit di 182.
ADMR: Can it Be The Start of the Markup Phase?Technical Analysis
After moving in the sideways trend for a while, ADMR made a descending broadening wedge pattern. Furthermore, ADMR has broken out of the Falling Wedge Pattern. The Breakout could indicate a possible starting point for the Markup Phase. The Markup Phase is the stage of price breakout of the trading range and starts to rise steadily. Therefore, we are forecasting a potential upside movement to the target area.
All other explanations are presented in the chart.
The roadmap will be invalid after reaching the target/support area.
"Disclaimer: The outlook is only for educational purposes, not a recommendation to put a long or short position in the ADMR"
Support the channel by giving us a thumbs up and sharing your opinions in the comment below!

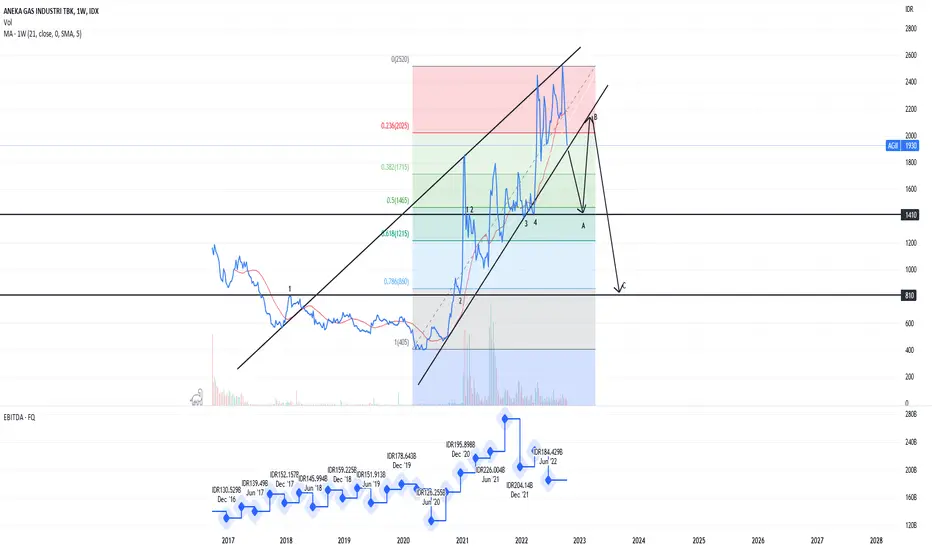
IDX $AGII Rising Wedge Potential Breakdown$AGII of IDX
Technical:
Rising Wedge breakdown followed a textbook ABC pattern
Breakdown will result in freefall to a strong first support at 1400 area, followed by a failed attempt to push past the bottom channel of the wedge and will start another freefall to the next support at 800 area inside 0.618 fib area.
Fundamental:
The trigger would likely be the (next) earning report as evidence in decline of EBITDA over the subsequence quarter which has little hope to reclaim record earning at Q3 2021
Q4 2021 exhibit a poor earning performance(-25% from Q3) but followed by a to new ATH at 2500. The (low volume) markup most likely mark the start of distribution phase to from institution to retail whom realized the declining performance of the company and increasingly unhealthy interest payment coverage by its operating cash flow (EBIT/debt interest : 1.7x)
AGII's EBITDA
Q3 2021 275
Q4 2021 204 ↓
Q1 2022 184 ↓
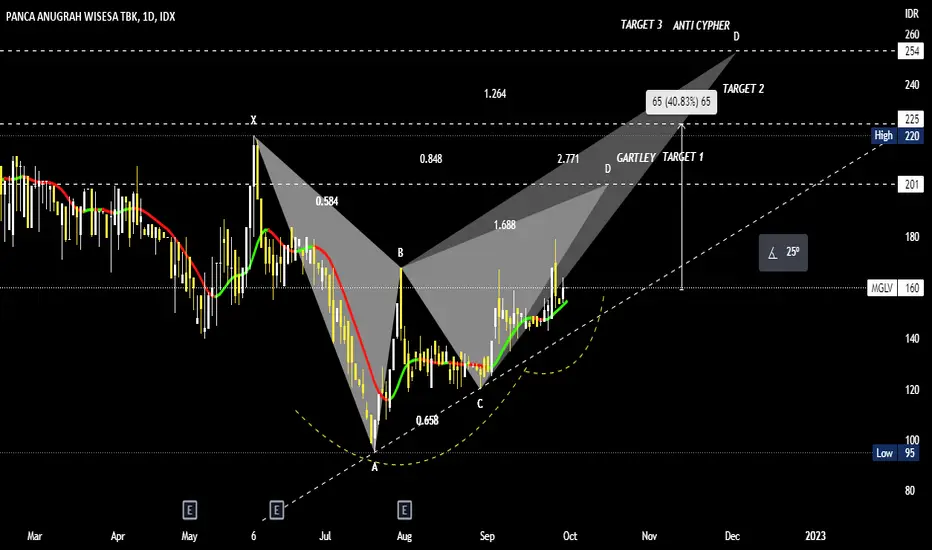
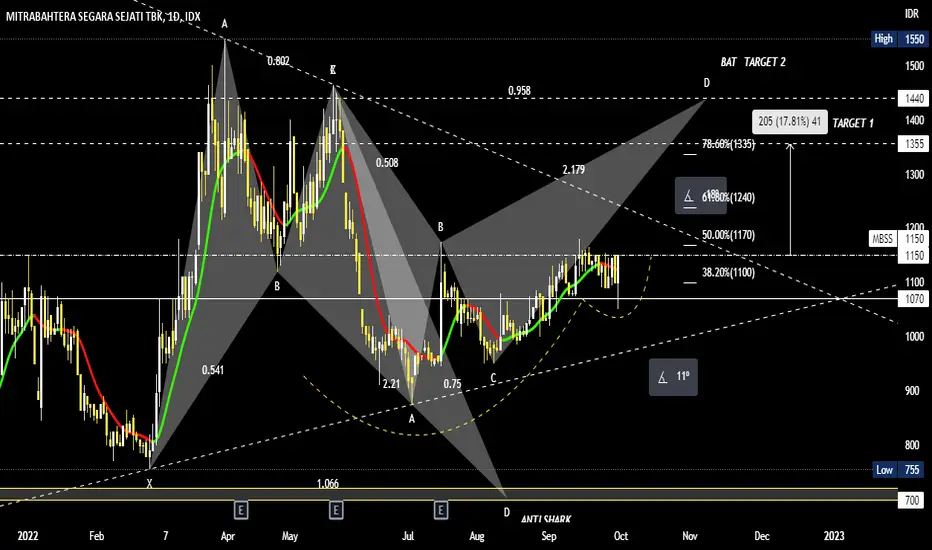
MBSS My Bullish PredictionMBSS My Bullish Prediction. Harmonic Pattern. Anti Shark. Bat. Cup and Handle. VCP
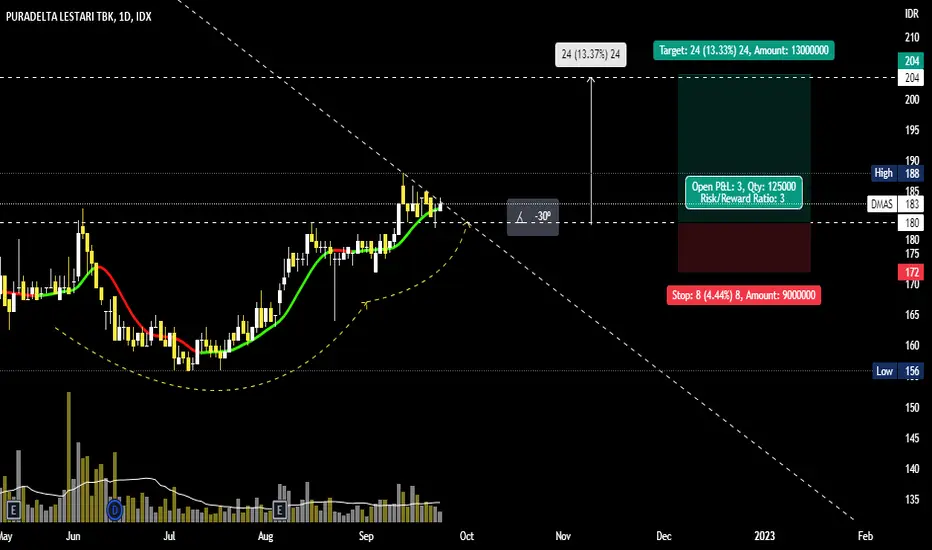
DMAS My Bullish PredictionDMAS My Bullish Prediction. Cup and Handle. Volatility Contraction Pattern

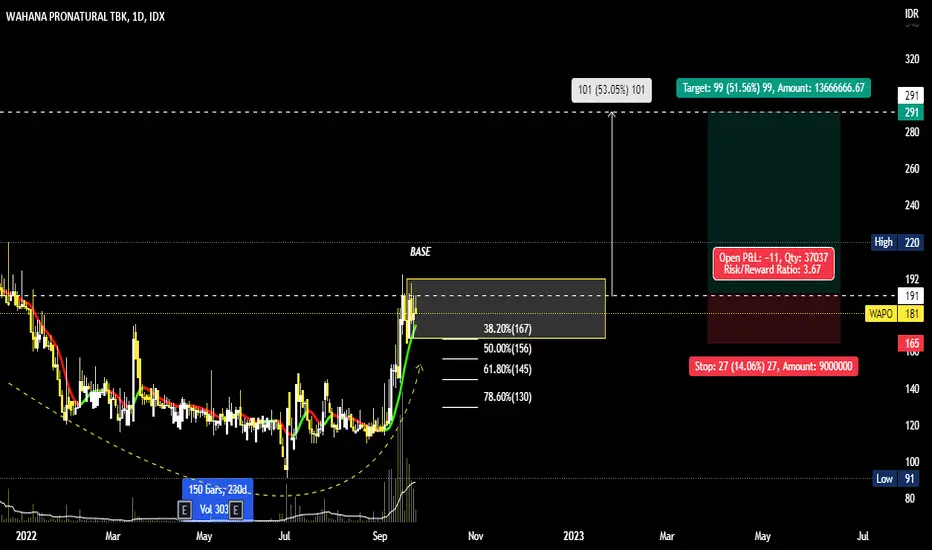
WAPO My Bullish PredictionWAPO My Bullish Prediction. Cup and Handle. Volatility Contraction Pattern.
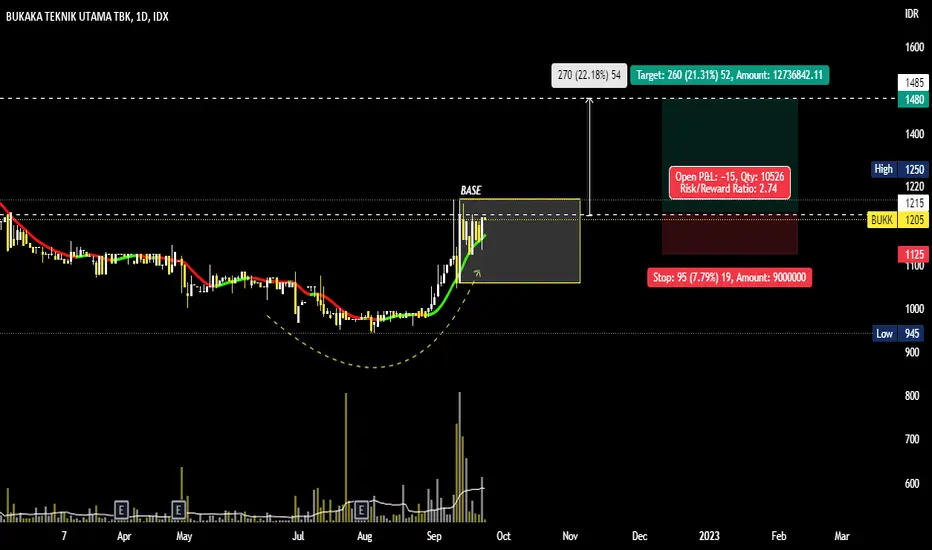
BUKK My Bullish PredictionBUKK My Bullish Prediction. Cup and Handle. Volatility Contraction Pattern.
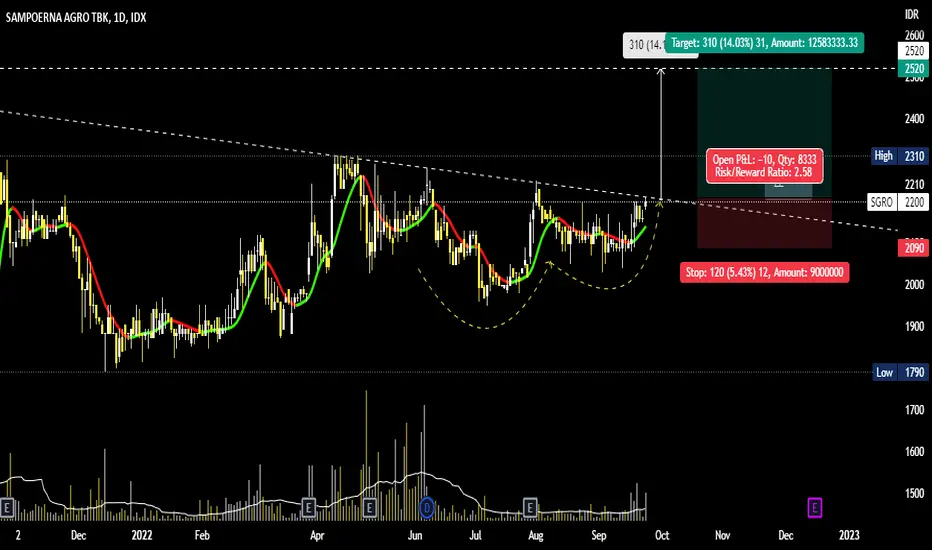
SGRO My Bullish PredictionSGRO My Bullish Prediction. Cup and Handle. Volatility Contraction Pattern.