$BTC : Bull or Bear ? READ THE CAPTIONAccording to the previous analysis of Bitcoin, the current price support is in the range of $18,800 to $19,100, the previous analysis is still valid! The new supply zones are $19,680, $19,900 and $20,170 to $20,470 respectively! The demand zones will be $18,600 and $17,700 respectively!
Follow me for more analysis & Feel free to ask any questions you have, I'm here to help.
⚠️ This Analysis will be updated ...
👤 Arman Shaban : @ArmanShabanTrading
📅 10.19.2022
⚠️(DYOR)
❤️ If you apperciate my work , Please like and comment , It Keeps me motivated to do better ❤️
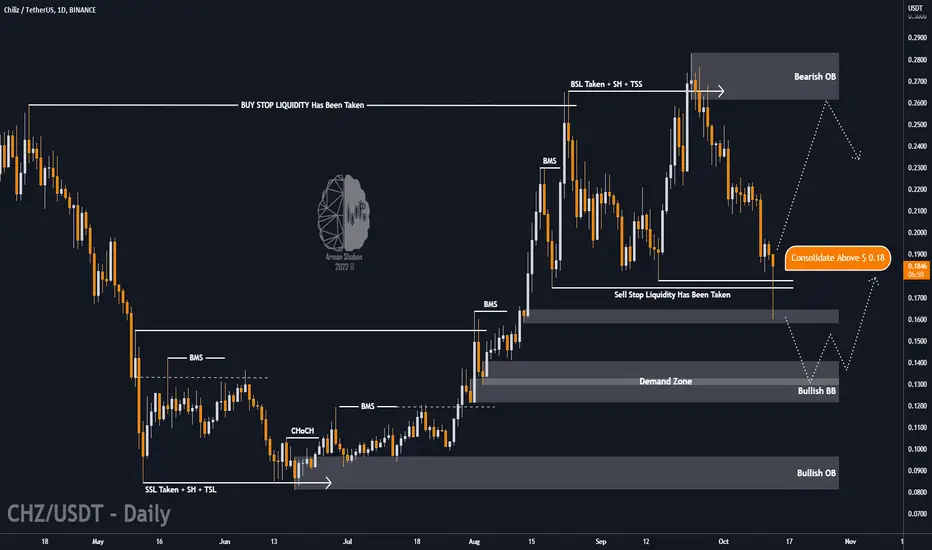
Sandbox

Chiliz 🌶 : Bullish or ... ? Let's See! If the price can consolidates above 18 cents, we can expect a Bullish scenario! Otherwise, the next appealing range for buying is 12 to 14 cents!
Follow me for more analysis & Feel free to ask any questions you have, I'm here to help.
⚠️ This Analysis will be updated ...
👤 Arman Shaban : @ArmanShabanTrading
📅 10.14.2022
⚠️(DYOR)
❤️ If you apperciate my work , Please like and comment , It Keeps me motivated to do better ❤️
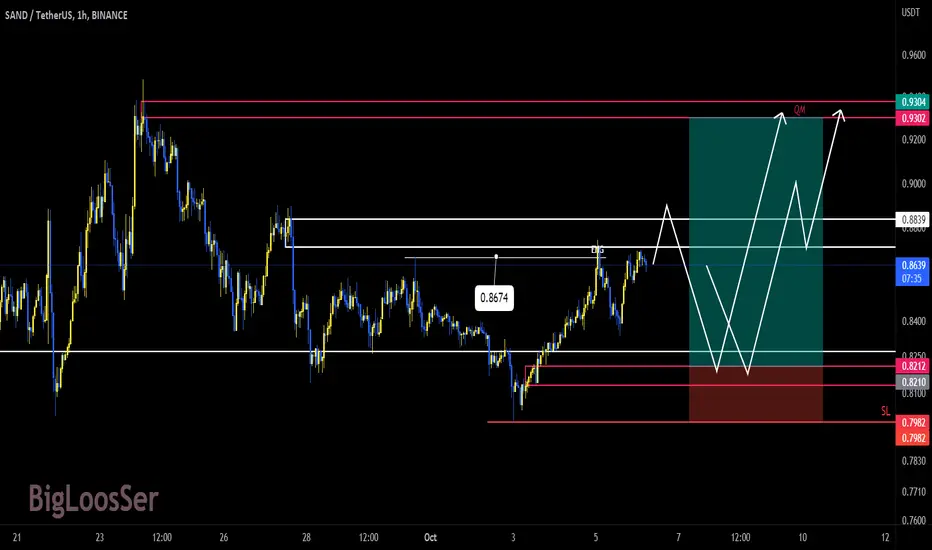
SANDUSDTHello friends
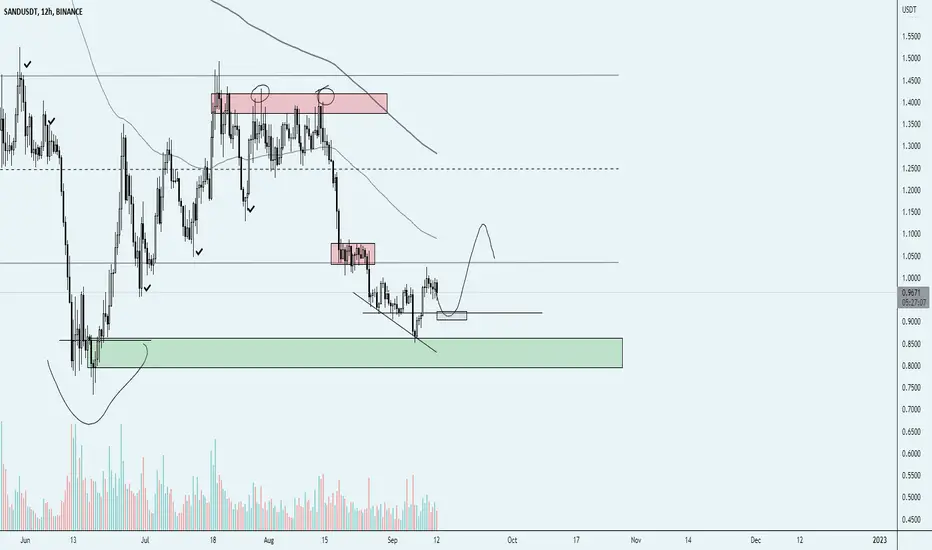
Considering that the current trend is not above the range of $0.8839, the possibility of continuing the upward trend from this range is weak.
There are two situations, or an increasing trend is formed from this range and the white area ($0.8839) is completely consumed.
Or from this price range, a corrective trend can be formed up to the area of $0.8212.
If the first mode is implemented, that is, the range of $0.8839 is consumed in the same movement, the validity of the area of $0.8212 will increase.
In the upward trend, the range of $0.8674 has been completely consumed, as a result, the pink area is valid and the probability of reaction to this range is high.
What do you think?
SANDBOX : Day trade (LONG)SANDBOX: Day trade (LONG)
Some trends show some increased trends coming time for SAND
Its very hard to find the right coins in a moment where most coins don't move really, and same time we are in a time where the take profits are faster than before. but trends change with time
If there is real breakout trends or high increase, for 90% we will find them with our trading algorithmic including volume study
We use 10% of work depending on algorithmic the rest studies.
When we add coins it means not it will increase: but the coins that we add have the most chance at that moment to change or in the short term.
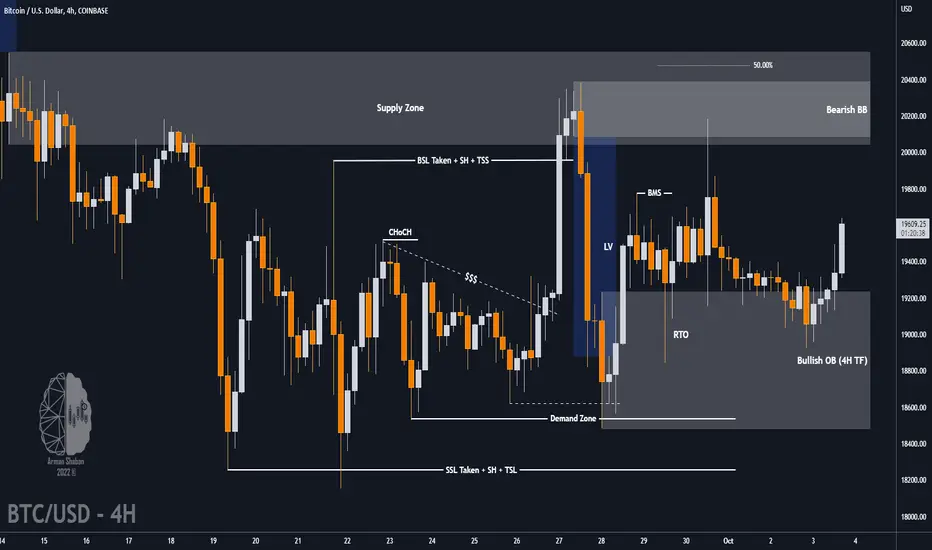
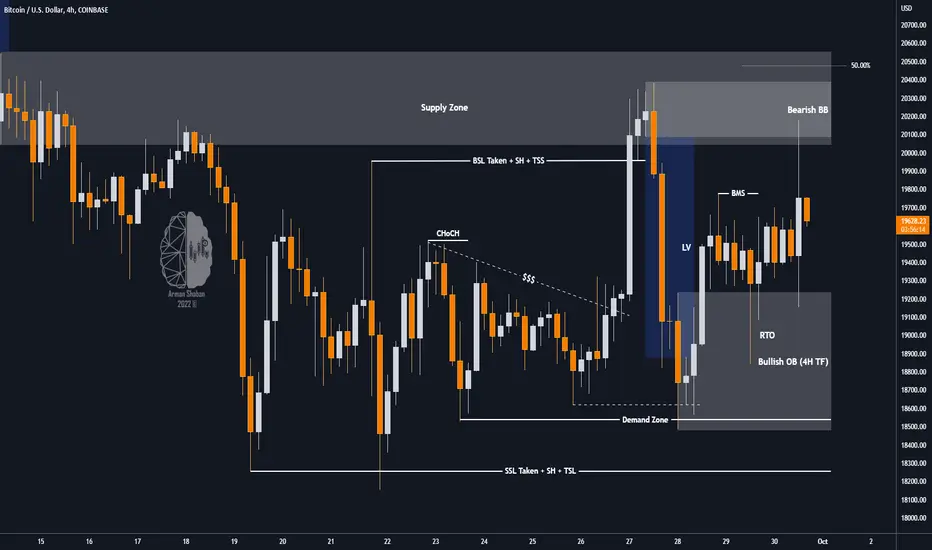
BITCOIN 4H TA : $ 20,000 ? Again ?As you can see the price may see 20050$ again ! after that we can look for a trigger for Sell Position ! So , Let's See !
Follow me for more analysis & Feel free to ask any questions you have, I'm here to help.
⚠️ This Analysis will be updated ...
👤 Arman Shaban : @ArmanShabanTrading
📅 10.03.2022
⚠️(DYOR)
❤️ If you apperciate my work , Please like and comment , It Keeps me motivated to do better ❤️

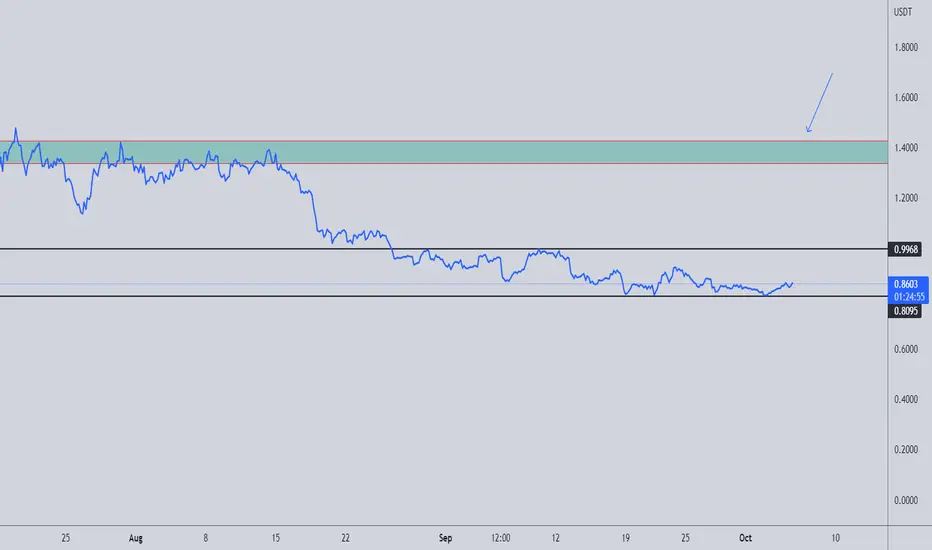
Sandbox SAND Bear Market RallyFriday the S&P hit a new 52 week low, being oversold right now.
I expect a bounce in the stock market next week, which will determine a bear market rally in the crypto space too!
Hedera HBAR is one of the cryptocurrencies that have a lot of potential for a bull run.
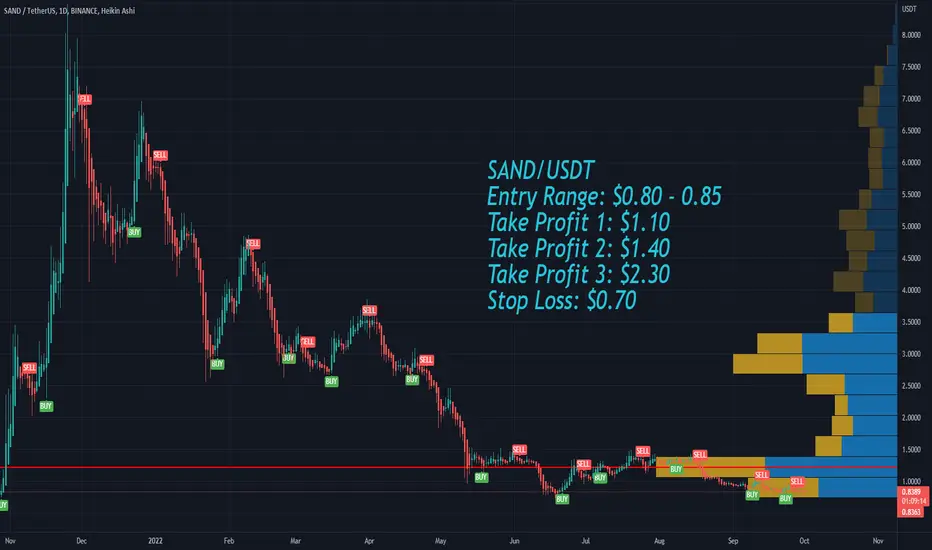
SAND/USDT
Entry Range: $0.80 - 0.85
Take Profit 1: $1.10
Take Profit 2: $1.40
Take Profit 3: $2.30
Stop Loss: $0.70
$BTC 4H TA : NEW ANALYSISAs you can see, after the last analysis and the reaction it showed, the price came back with the demand, today the price was able to penetrate the range of $20100 and has faced the first selling pressure! Now we have to see if the price stops here or goes to hit the $20500 and $22190 targets!
Follow me for more analysis & Feel free to ask any questions you have, I'm here to help.
⚠️ This Analysis will be updated ...
👤 Arman Shaban : @ArmanShabanTrading
📅 09.30.2022
⚠️(DYOR)
❤️ If you apperciate my work , Please like and comment , It Keeps me motivated to do better ❤️
The momentum of the trend is still bearishSAND had a range trend during the past weeks. The price of Sandbox has fluctuated within the price range of $0.85. The trend's momentum is still bearish, and the resistance considered in the range of $0.84 to $0.860 has not yet been broken. We can also consider a short-term downward channel for the price. If the support in the $0.82 range is lost, further declines could continue to the previous floor range of $0.740 - $0.660.
For the price trend to enter the upward phase again, a high trading volume is needed to break the resistance of the rand at $1. Otherwise, at best, the trend of the sandbox currency can be in the current support range. In the 4-hour time frame, minor support has been drawn in the range of $0.837 to $0.845, and for the short term, as long as this support is maintained, the direction of the price movement can continue to the range of $0.90 to $0.94.

0.4$ target 95% will be the first target for sand box (0.4$)
Second 0.2$ it may not reach depends on btc move
GOOD LUCK

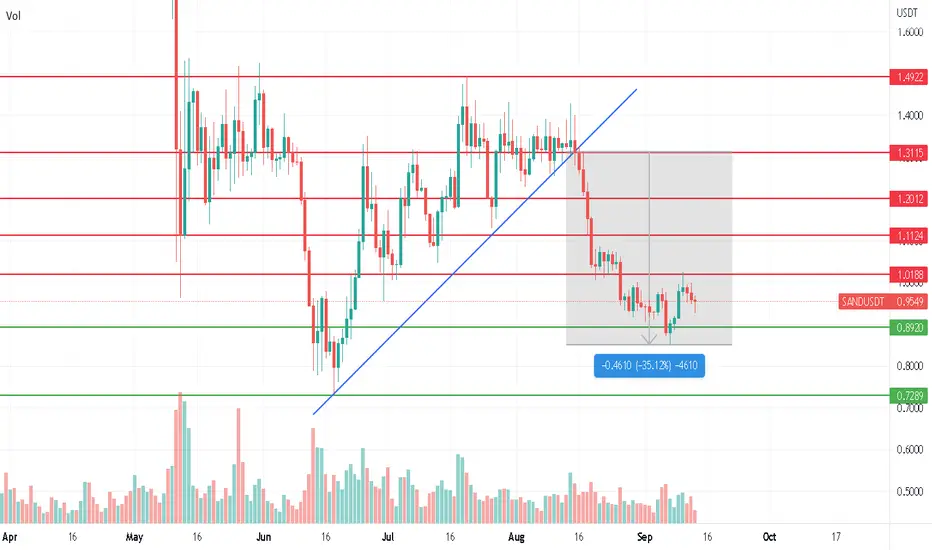
SANDUSDT LEVELS TO WATCH CURRENTLY.SANDUSDT LEVELS TO WATCH CURRENTLY.
After a nice recovery last month, since sand broke below this blue trendline and confirmed it as a resistance. It has retraced around 35% & now holding support of 0.89 cents.
The nearest resistance is around 1.02 area.
green horizontal lines - Support
red horizontal lines - resistance.
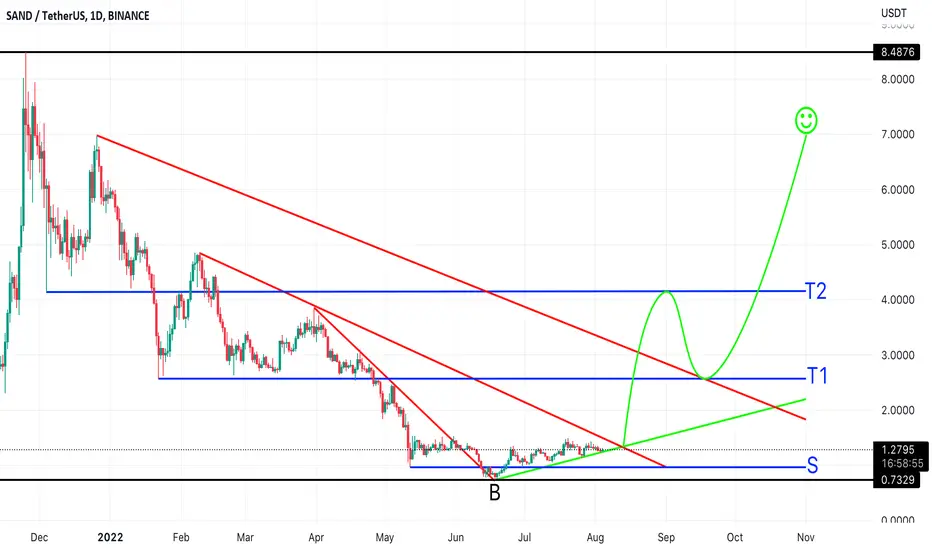
SAND- Lets All Play In The SandboxAnalysis:
- Support & Resistance
- Trend Line
- Supply & Demand
- Fibonacci Retracement
- Order Block Flow
T1: Target 1
T2: Target 2
B: Bottom / End of Correction / Beginning of Bull Run
S: Support
:) Breakout / Bull Run
Opinion:
The correction for Sandbox is over and price will rise the next few weeks/months
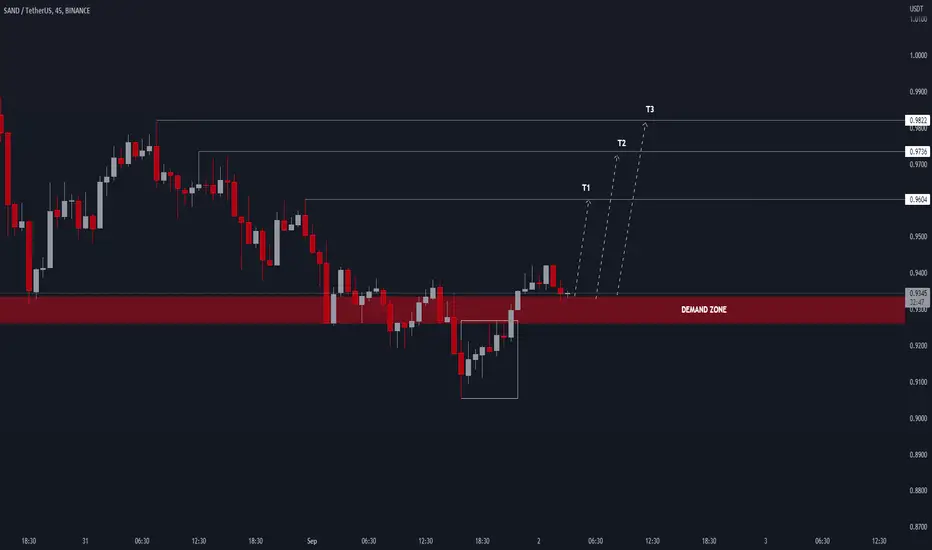
Sandbox - Long playWhat I want for a long on Sand - especially given the relative strength were seeing now in the market today.
A retest of demand (grey box) where we broke previous MS and have triggered a micro trend reversal for now would be my entry. This grey box lines up with the break of MS and also the 618 fib level of the recent move off the local bottom (the sweet spot).
Then want to see a strong reaction to punch above resistance from prior bearish consolidation and back INTO the range. If we don't get a strong reaction I will start to debate if this momentum is real or not (what we're seeing on other coins atm).
Tight SL would be set below the low or just below where we broke the market structure.
Or we punch sooner and I don't get filled, have to keep this in mind as well.
V
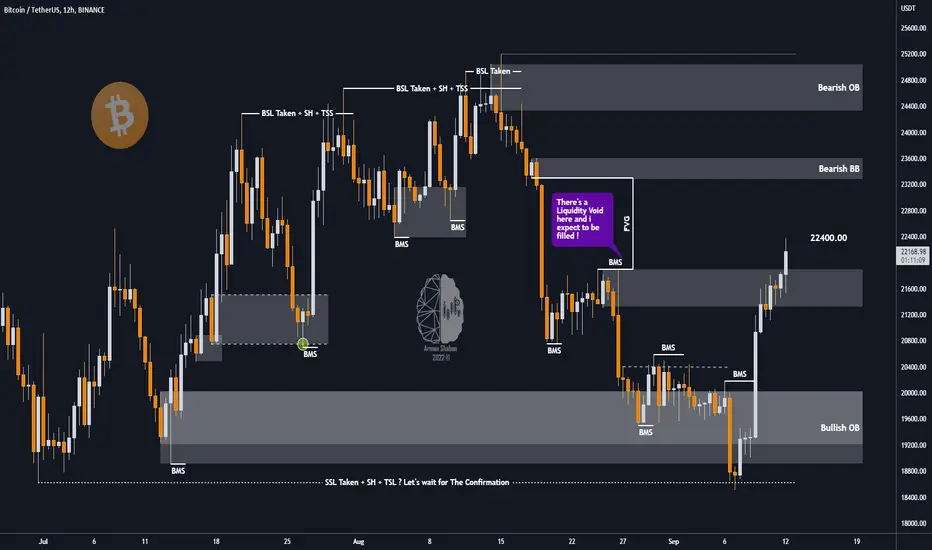
₿ BITCOIN : NEW WEEK UPDATE ₿Well, as you can see, the price finally hit the next important target, that was $21,700 ! The results of this analysis has been +20% ✅ so far! We were waiting for a negative reaction in this range since yesterday, but we still did not see an appealing bearish trigger for the SELL position! In fact, according to the current price trend, if Bitcoin manages to consolidates above $22,400, we can expect growth up to the range of $23,100 to $23,630 ! Otherwise (non-Consolidation above $22400) we can look for a suitable trigger for the SELL position!
Follow us for more analysis & Feel free to ask any questions you have, we are here to help.
⚠️ This Analysis will be updated ...
👤 Arman Shaban : @ArmanShabanTrading
📅 09.12.2022
⚠️(DYOR)
❤️ If you apperciate my work , Please like and comment , It Keeps me motivated to do better ❤️
SAND potential to increase +300%#SAND/USDT
$SAND broke out from falling wedge pattern, and have a sideways move between support zone around $0.76 and resistance zone around $1.5.
now price is at support zone which is the same with long-term ascending trend line.
🐮 holding this zone as support will increase price to resistance zone which is the same with descending trend line and breaking out this zone will increase price toward +$3.
👌🏻 so current price has a great R/R to enter.
🐻 break down from support zone will drop price to descending trend line and I think it will take time to survive from this drowning.

SANDBTC 4HSANDBTC has been accumulating since August 23, 2022. The longer this accumulation rectangle resists and is not broken and the more times it is tested, the greater the strength of the breakout, and as SAND is brutally undervalued, the breakout will be upwards reaching quickly $0.00005291.

SANDBOX- Updated LevelsSandbox is a project we like to Buy but always in good time and the timing ain't good at this stage.
Here is the charts with my 3 entry levels I'm looking at next.
0.59 is a strong support as much as 1.43 ended up being a strong rejection/resistance.
Patience Snoop and remember: smoking weed kills your brain cells, pass more than you puff.
One Love but no puff here yet,
the FXPROFESSOR

Bear Markets Are Always The Greatest Buying Opportunities. Why!Our Goal is to bring the Blockchain to the mainstream, Our Mission is mass adoption of cryptoS and Our Dream is to advance human civilization with QBAR (Quantum, Blockchain, AI and Robotics)

SAND/BTC 4HSAND/BTC = SAND broke the LTB that had been dragging for a long time and is now on an escalation to the congestion layer above. The big resistance that will be the MM200 is above our target of 5292
Sandbox is an Ethereum-based metaverse game that allows users to buy virtual land and customize it with playable games and experiences. Celebrities and brands filled the space, including Snoop Dog., Adidas, Paris Hilton, The Walking Dead, Gucci and more.

SANDBOX - Snoop, pass pass passRejection at 1,43 was harsh and persistent, Powell brought SAND and the market lower and unfortunately this is not a dip to buy (yet)
With Mt Gox fears being valid (nobody knows for sure how and when the event will take place) and after Powel's gloomy projections/tone we need to be worried.
I would be Long over 0.99or at 0,75 again. Grand support very far away at 59 cents.... can't guarantee nor wish that we can see this level again but reality says we could.
Let's keep our cool and be aware that markets opening in Asia tonight (Sunday midnight hours for Europe) could add to worries.
We be careful and hedged here. SANDBOX is a crypto I like to Buy.
One Love,
the FXPROFESSOR

The last bastion of supportHello, dear TradingView members.
SAND has hit a support range at $1.13 to $1.185 over the past week as it continues its downward trend. Due to the strong selling pressure, the support strength was not enough to hold the price, and after breaking this support, we saw a further drop to the $1 range. In the past few days, the price trend of the sandbox has ranged, and the previous day, the $1 support of the sandbox was also broken due to negative news that had a negative impact on the entire market.
The price has now hit support in the $0.94 range, and if this range holds, another bearish trend is expected for the currency. But if the selling pressure increases, by breaking this support, the price can continue the downward trend to the previous floor in the range of 0.69 to 0.76 dollars. In the weekly time frame, the main support is the floor of its last rising wave, and if it is broken, the $0.61-$0.65 range will be its last support level for the medium term.
Good luck!

LOOKING FOR A BUY STEP ON SANDBOX ...!Sand looks bearish for short now, due to the probable bearish signals on btc. Despite the growth of the market is expected. In this case, we must look for appropriate reversal levels for entry before the bullrun !
Stay tuned for more post and my updates... >_-
