Equity Markets Ahead of the US Inflation ReportEquity Markets Ahead of the US Inflation Report
Today at 15:30 GMT+3, the US inflation report (Consumer Price Index, or CPI) is scheduled for release. According to ForexFactory, analysts expect the inflation rate to rise from 2.4% to 2.6%.
The actual figures will provide market participants with grounds to debate not only the likelihood of a Federal Reserve rate cut, but also the evolving tensions between Donald Trump and Jerome Powell.
Should the report deliver any surprises, it will almost certainly trigger heightened volatility across the equity markets. For now, however, investors are seemingly optimistic about the upcoming fundamental data — especially given the commencement of Q2 earnings season, which lends additional weight to today’s macroeconomic indicators.
Technical Analysis of the S&P 500 Chart
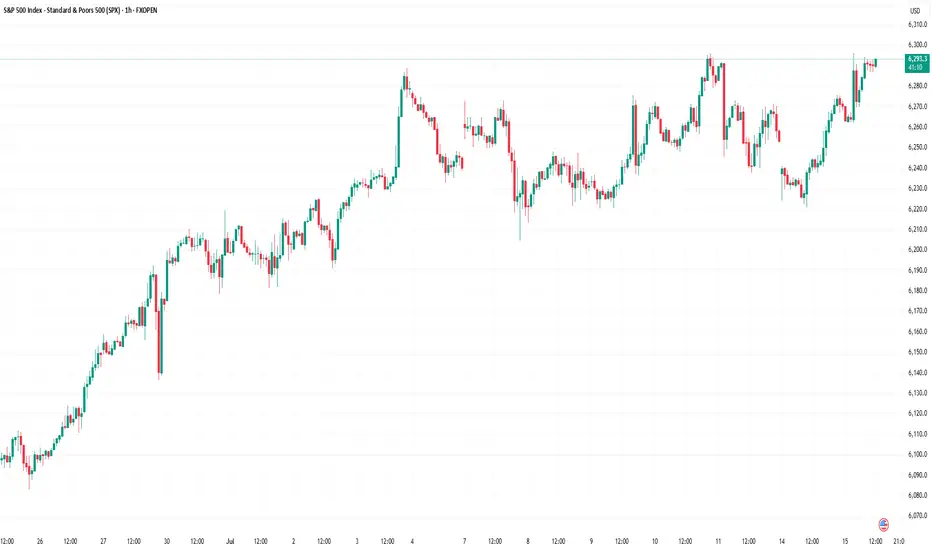
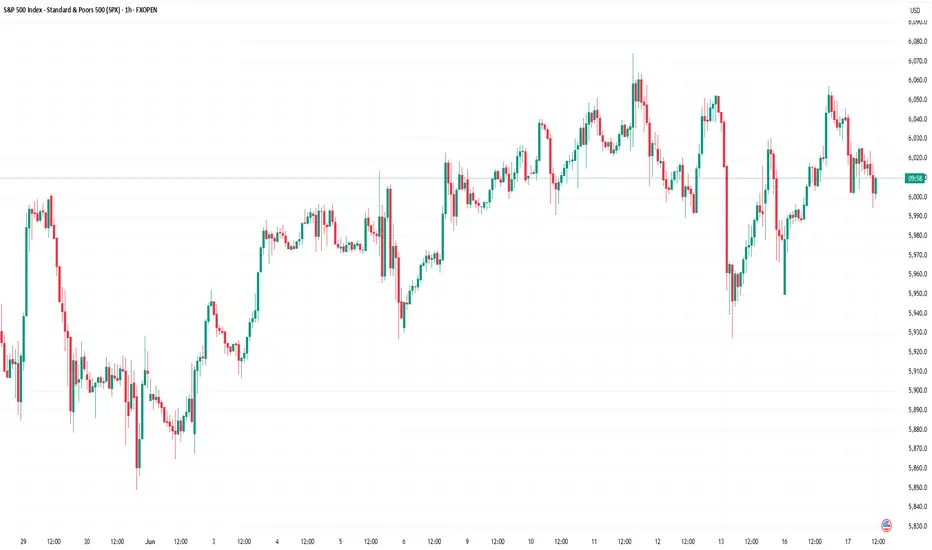
The S&P 500 chart (US SPX 500 mini on FXOpen) shows the index fluctuating within a range defined by support at 6,222 and resistance at 6,290.
The upward impulses (as indicated by arrows) suggest that:
→ current market optimism, combined with the CPI release, may lead to a bullish breakout above resistance and the establishment of a new all-time high;
→ in a broader context, such a breakout could be interpreted as a continuation of the rally that began in April, following a period of consolidation between the aforementioned levels.
This article represents the opinion of the Companies operating under the FXOpen brand only. It is not to be construed as an offer, solicitation, or recommendation with respect to products and services provided by the Companies operating under the FXOpen brand, nor is it to be considered financial advice.
Sandp500
S&P 500 Hit Record High Ahead of Holiday BreakS&P 500 Hit Record High Ahead of Holiday Break
Today, financial markets in the United States are closed in observance of Independence Day. Investor sentiment was likely buoyed by the latest rally in the S&P 500 index (US SPX 500 mini on FXOpen), which set a new all-time high yesterday, surpassing 6,280.
The bullish momentum has been driven by robust labour market data in the US. According to ForexFactory, analysts had anticipated a rise in the unemployment rate from 4.2% to 4.3%, but instead, it unexpectedly declined to 4.1%.
Can the stock market continue to climb?
Technical Analysis of the S&P 500 Chart
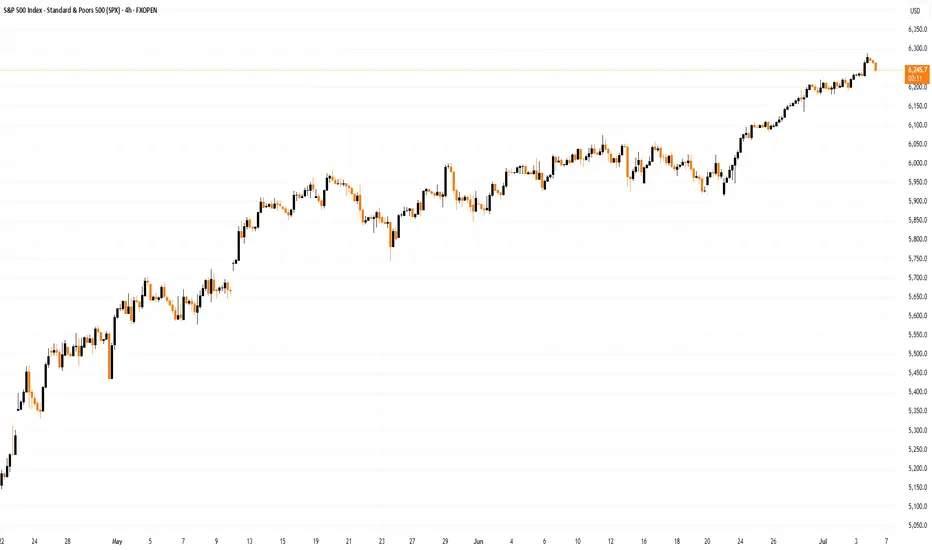
Analysing the 4-hour chart of the S&P 500 index (US SPX 500 mini on FXOpen)on 30 June, we observed the following:
→ An ascending channel was formed (indicated in blue);
→ A developing bullish impulse (marked with an orange line) suggested the price would move towards the upper boundary of the channel – a scenario that materialised with yesterday’s rally (as shown by arrow 1).
However, from a price action perspective, the recent downward move (arrow 2) has now gained significance. It may indicate that sellers are becoming more active around the identified resistance level.
Should the price decline towards the lower orange line, this could negate the current bullish impulse altogether, effectively reflecting a classic bearish engulfing pattern.
Given the above, there is reason to believe that bears are attempting to regain control after the S&P 500 (US SPX 500 mini on FXOpen) surged over 5% in the past 10 days. As such, a potential breakout below the orange line cannot be ruled out, with price action possibly targeting the median of the blue ascending channel.
What happens next?
The market’s trajectory will largely hinge on developments related to tariffs. Trade policy will remain in the spotlight next week, as key deadlines set by the White House approach — events that traders will be closely monitoring.
This article represents the opinion of the Companies operating under the FXOpen brand only. It is not to be construed as an offer, solicitation, or recommendation with respect to products and services provided by the Companies operating under the FXOpen brand, nor is it to be considered financial advice.
S&P 500 Sets New All-Time High, Surges Above 6200S&P 500 Sets New All-Time High, Surges Above 6200
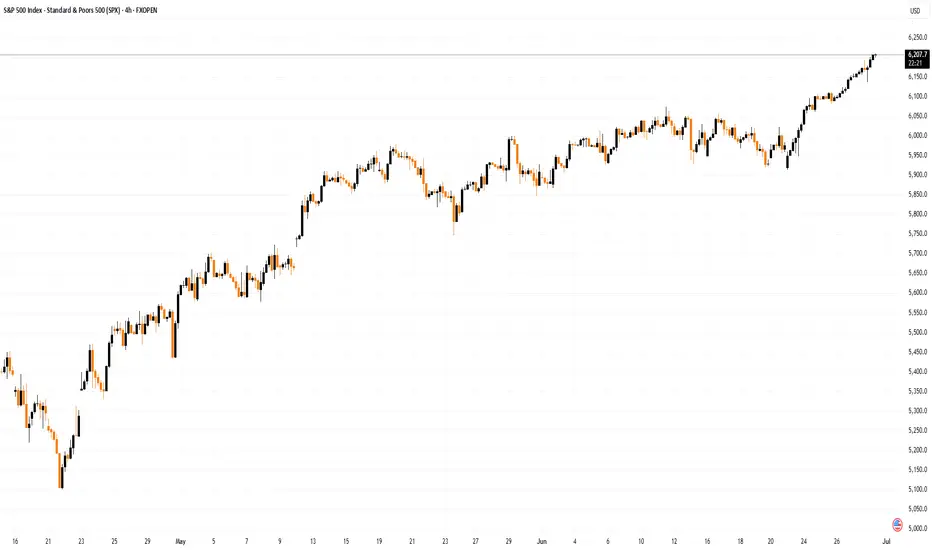
The S&P 500 index (US SPX 500 mini on FXOpen) started the week by reaching a fresh all-time high. As shown on the chart, the index hit 6,210 points earlier this morning.
In addition to a reduced risk of US involvement in a large-scale war in the Middle East, market optimism has been fuelled by:
→ Tariff-related news. Last week, the US President announced the signing of a trade deal with China, while Treasury Secretary Scott Bessent expressed hope that the US would conclude trade negotiations with over a dozen countries by early September.
→ Strong corporate performance. On Friday, Nike (NKE) shares led the stock market, rising by more than 15% following an earnings report that exceeded analysts’ expectations. This could be boosting investor sentiment ahead of the upcoming earnings season.
Technical Analysis of the S&P 500 Chart
Evaluating the 4-hour chart of the S&P 500 index (US SPX 500 mini on FXOpen) in the context of June’s price movements reveals key reference points (marked on the chart) that outline an ascending channel. A consolidation zone, marked with an arrow, highlights a temporary equilibrium between supply and demand—after which buyers gained the upper hand, pushing the price upward.
It is possible that the ongoing bullish momentum could carry the price toward the upper boundary of the channel. However, attention should be paid to the RSI indicator, which suggests the market is heavily overbought; in fact, Friday’s reading marked the highest level of the year. In such conditions, a price correction cannot be ruled out—potentially back toward the local ascending trendline (shown in orange).
This article represents the opinion of the Companies operating under the FXOpen brand only. It is not to be construed as an offer, solicitation, or recommendation with respect to products and services provided by the Companies operating under the FXOpen brand, nor is it to be considered financial advice.
Stock Markets Rebound Following Trump’s Ceasefire AnnouncementStock Markets Rebound Following Trump’s Ceasefire Announcement
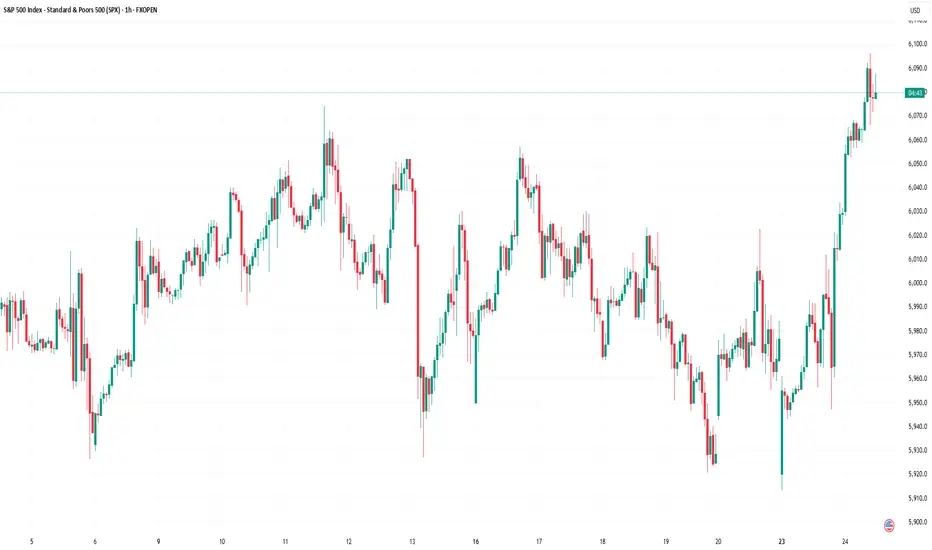
Last night, U.S. President Donald Trump made a social media post announcing a ceasefire agreement between Iran and Israel. According to his own words, the ceasefire is set to last “forever.” This announcement triggered a sharp bullish impulse (indicated by the blue arrow) on the S&P 500 index chart (US SPX 500 mini on FXOpen), pushing the price to a new high above the 6074 level.
Just yesterday, traders feared that the United States could be drawn into yet another costly war following bomber strikes on Iran’s nuclear facilities. However, today the stock markets are recovering, signalling growing optimism and a waning of fears over a major escalation of the conflict.
Technical Analysis of the S&P 500 Chart
When analysing the S&P 500 index chart (US SPX 500 mini on FXOpen) seven days ago, we identified an ascending channel. The angle of the trend remains relevant, while the width of the channel has expanded due to the downward movement caused by tensions in the Middle East.
Notably:
→ the price marked the lower boundary of the channel as well as the internal lines (shown by black dots) dividing the channel into quarters;
→ the latest bullish impulse suggests that the upward trend is resuming after breaking out of the correction phase (indicated by red lines).
It is possible that in the near future, the S&P 500 index (US SPX 500 mini on FXOpen) could reach the median line of the channel. There, the price may consolidate, reflecting a balance between buyers and sellers—particularly if the peace in the Middle East proves to be lasting.
This article represents the opinion of the Companies operating under the FXOpen brand only. It is not to be construed as an offer, solicitation, or recommendation with respect to products and services provided by the Companies operating under the FXOpen brand, nor is it to be considered financial advice.
How Financial Markets Are Reacting to Middle East EscalationHow Financial Markets Are Reacting to the Escalation in the Middle East
The exchange of strikes between Iran and Israel continues. However, judging by the behaviour of various assets, market participants do not appear to expect further escalation:
→ Oil prices are falling. Monday’s candlestick on the XBR/USD chart closed significantly below the opening level.
→ Safe-haven assets are also retreating: the Swiss franc weakened during Monday’s U.S. session, while a bearish candle formed on the daily XAU/USD chart.
Equity markets, too, have largely held their ground.
The S&P 500 index (US SPX 500 mini on FXOpen) climbed on Monday (A→B) following reports of potential talks between Iran and the U.S. However, it pulled back (B→C) after the U.S. President urged citizens to evacuate Tehran.
Technical Analysis of the S&P 500 Chart
News of Israeli strikes on targets inside Iran led to a bearish breakout from the rising channel (marked with a red arrow), though the downward move failed to gain traction.
At present, the S&P 500 chart (US SPX 500 mini on FXOpen) shows the formation of an ascending triangle — a signal of temporary balance between supply and demand.
Still, given the elevated geopolitical uncertainty, this balance remains fragile. It could be disrupted by:
→ Further developments in the Iran–Israel conflict (notably, Donald Trump left the G7 summit early due to the situation in the Middle East);
→ U.S. retail sales data , due today at 15:30 GMT+3.
It is possible that the S&P 500 may soon attempt to break out of the triangle , potentially triggering a new directional trend.
This article represents the opinion of the Companies operating under the FXOpen brand only. It is not to be construed as an offer, solicitation, or recommendation with respect to products and services provided by the Companies operating under the FXOpen brand, nor is it to be considered financial advice.
S&P 500 Breaks UptrendS&P 500 Breaks Uptrend
Only yesterday we questioned the sustainability of the stock market’s upward trend amid alarming news from the Middle East and the evacuation of the US embassy in Iraq — and today, the S&P 500 chart (US SPX 500 mini on FXOpen) shows a break below the lower boundary of the ascending trend channel.
According to media reports:
→ Steve Witkoff, US President Donald Trump’s special envoy to the Middle East, was expected to meet Iran’s Foreign Minister in Oman on Sunday.
→ Friday the 13th became the date when Israel launched strikes on Iran’s nuclear facilities, dramatically altering the outlook for a potential US-Iran nuclear agreement.
→ Secretary of State Marco Rubio stated that the US was not involved in the operation, while Israel’s state broadcaster reported that Washington had been informed ahead of the strikes.
Technical Analysis of the S&P 500 Chart
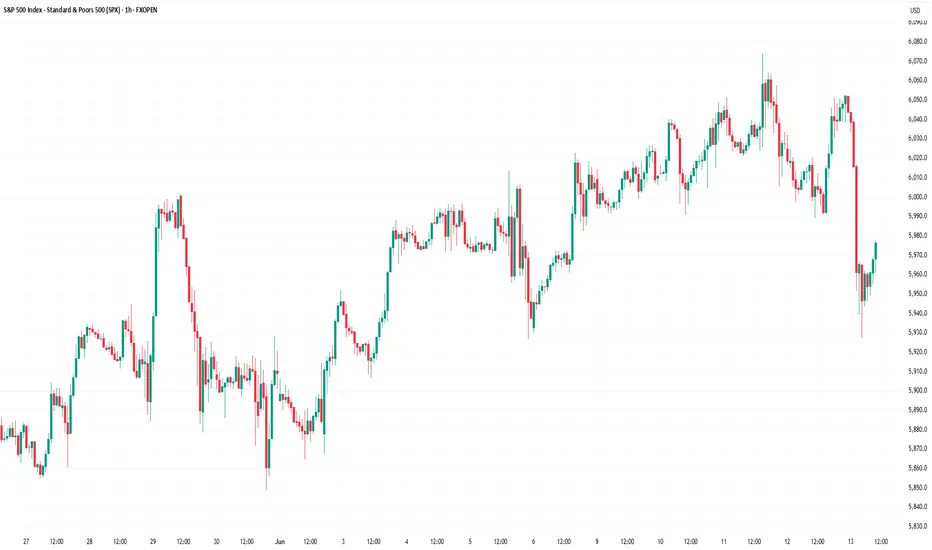
Yesterday morning, we noted that the Q-line, which divides the lower half of the channel into two quarters, had shifted from acting as support to becoming resistance. This was confirmed during the US trading session (as indicated by the arrow).
Selling pressure intensified, and the psychologically important 6,000 level — which showed signs of support earlier in June — now appears to be acting as resistance. It is in this area that the E-Mini S&P 500 (US SPX 500 mini on FXOpen) broke below the lower boundary of its uptrend channel.
In addition to ongoing discussions about potential Fed rate cuts this summer, geopolitical risk assessments are now also in focus. It remains unclear how Washington will respond if Iran retaliates.
Meanwhile, Israel’s Defence Minister has declared a state of emergency, warning of an imminent missile and drone attack — further fuelling fears of a possible escalation.
This article represents the opinion of the Companies operating under the FXOpen brand only. It is not to be construed as an offer, solicitation, or recommendation with respect to products and services provided by the Companies operating under the FXOpen brand, nor is it to be considered financial advice.
S&P 500 Maintains Uptrend — But for How Long?S&P 500 Maintains Uptrend — But for How Long?
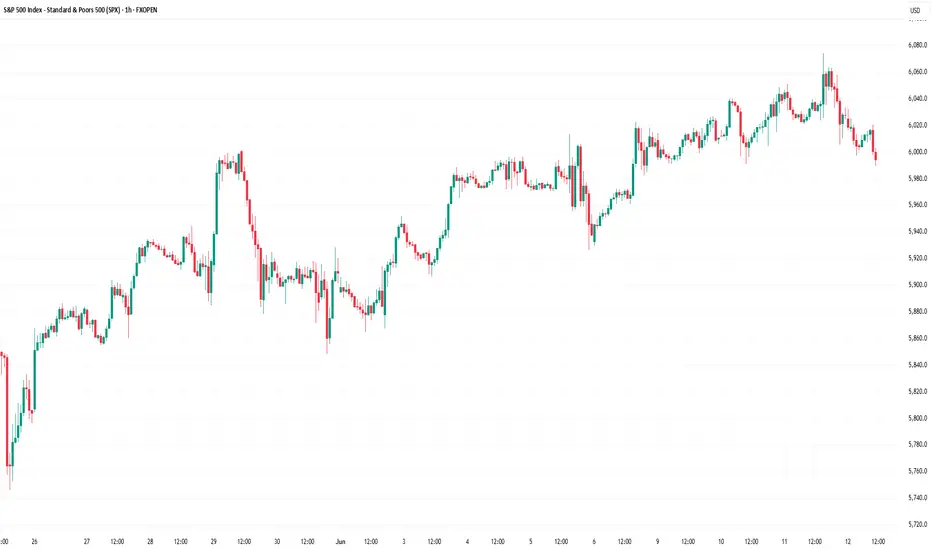
As the chart of the S&P 500 (US SPX 500 mini on FXOpen) shows, price movements in June continue to form an upward trend (highlighted in blue).
The bullish momentum is being supported by:
→ News of a potential trade agreement between the United States and China;
→ The latest inflation report. Data released yesterday showed that the Consumer Price Index (CPI) slowed from 0.2% to 0.1% month-on-month.
President Donald Trump described the inflation figures as “excellent” and said that the Federal Reserve should cut interest rates by a full percentage point. In his view, this would stimulate the economy — and serve as another bullish driver.
However, as illustrated by the red arrow, the index pulled back yesterday from its highest level in three and a half months, falling towards the lower boundary of the channel. This decline was triggered by concerning developments in the Middle East. According to media reports, the US is preparing a partial evacuation of its embassy in Iraq, following statements by a senior Iranian official that Tehran may strike US bases in the region if nuclear talks with Washington fail.
Technical Analysis of the S&P 500 Chart
Currently, the price remains near the lower boundary of the ascending channel, reinforced by the psychologically significant 6,000-point level.
However, note that line Q — which divides the lower half of the channel into two quarters — has flipped from support to resistance (as indicated by black arrows). This suggests increasing bearish pressure, and there is a possibility that sellers may soon attempt to push the price below the channel support.
Be prepared for potential spikes in volatility on the E-Mini S&P 500 (US SPX 500 mini on FXOpen) chart as markets await the release of the Producer Price Index (PPI) at 15:30 GMT+3 today.
This article represents the opinion of the Companies operating under the FXOpen brand only. It is not to be construed as an offer, solicitation, or recommendation with respect to products and services provided by the Companies operating under the FXOpen brand, nor is it to be considered financial advice.
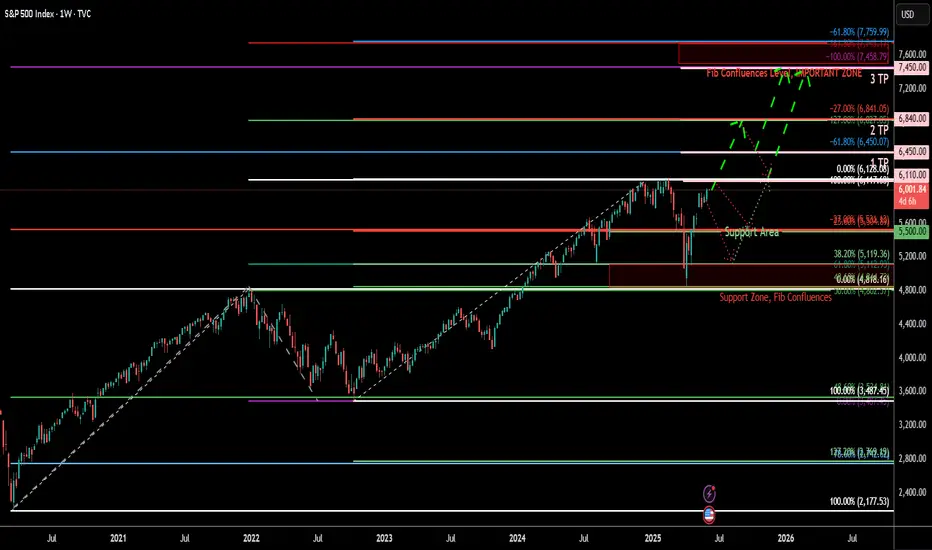
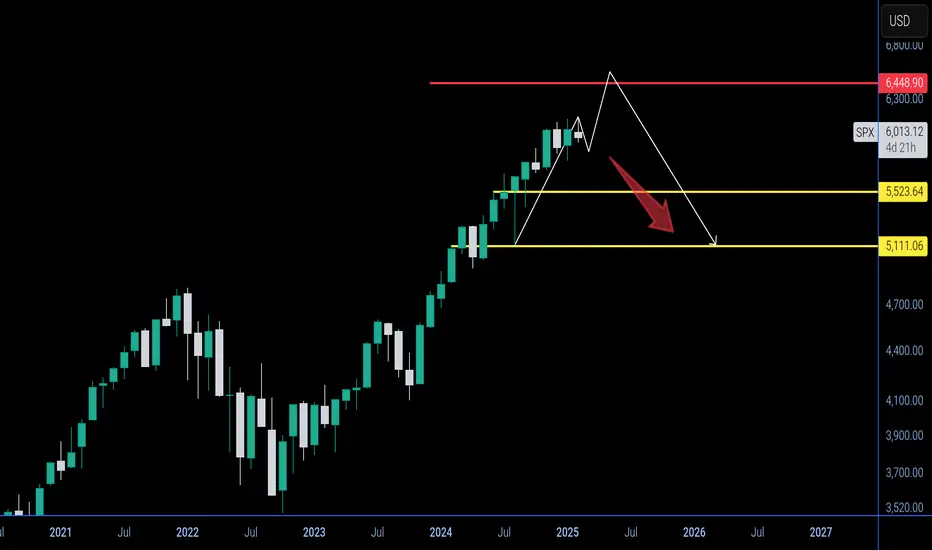
S&P 500 Index (SPX) Weekly TF – 2025
Chart Context:
Tools Used: 3 Fibonacci Tools:
1. One **Fibonacci retracement** (from ATH to bottom)
2. Two **Trend-Based Fibonacci Extensions**
* Key Levels and Zones:
* **Support Zone** (Fib Confluence): \~4,820–5,100
* **Support Area (shallow pullback)**: \~5,500–5,600
* **Resistance & TP Zones:**
* TP1: **6,450** (Fib confluence & -61.8%)
* TP2: **6,840** (-27%)
* TP3: **7,450–7,760** (Major Confluence)
Technical Observations:
* SPX is approaching a **critical resistance** near previous ATH (\~6,128) with projected upward trajectory.
* The **green dashed path** suggests a rally continuation from current \~6,000 levels to TP1 (\~6,450), TP2 (\~6,840), and eventually TP3 (\~7,450–7,760), IF no major macro shock hits.
* The **purple dotted path** suggests a potential retracement first to \~5,600 (shallow correction) or deeper into \~5,120 or even 4,820 zone before continuing the bullish rally.
* The major support zone around **4,820–5,120** includes key Fib retracement levels (38.2% and 61.8%) from both extensions and historical breakout levels.
Fundamental Context:
* US economy shows **resilience** amid soft-landing narrative, though inflation remains sticky.
* The **Federal Reserve** is expected to cut rates in **Q3–Q4 2025**, boosting equity valuations.
* Liquidity expansion and dovish outlook support risk assets, including **equities and crypto**.
* However, **AI-driven tech rally** may be overstretched; a correction could follow earnings disappointments or macro surprises (e.g., jobs or CPI shocks).
Narrative Bias & Scenarios:
**Scenario 1 – Correction Before Rally (Purple Path)**
* If SPX faces macro pushback (e.g., high CPI, hawkish Fed), expect retracement to:
* 5,600 = Fib -23.6% zone
* 5,120–4,820 = Major Fib Confluence Zone
* These would act as **accumulation zones**, setting up next leg up toward TP1 and beyond.
* **Effect on Gold**: May rise temporarily due to risk-off move.
* **Effect on Crypto**: Could stall or correct, especially altcoins.
**Scenario 2 – Straight Rally (Green Path)**
* If Fed confirms cuts and macro remains soft:
* SPX breaks ATH (\~6,128)
* Hits TP1 (\~6,450), TP2 (\~6,840)
* Eventually reaches confluence at **TP3 (7,450–7,760)**
* **Effect on Gold**: May struggle; investor preference for equities.
* **Effect on Crypto**: Strong risk-on appetite, altseason continuation.
Indicators Used:
* 3 Fibonacci levels (retracement + 2 extensions)
* Trendlines (macro and local)
* Confluence mapping
Philosophical/Narrative Layer:
This phase of the market resembles a test of collective confidence. Equity markets nearing ATHs while monetary easing begins reflect a fragile optimism. The Fibonacci levels act as narrative checkpoints — psychological as much as mathematical. Will we rally on faith or fall for rebalancing?
Bias & Strategy Implication:
Bias: Bullish with caution
* Strategy:
* Await **confirmation breakout >6,128** for fresh long entries
* Accumulate on dips in the **5,100–5,500** zone if correction unfolds
* Use **TP1, TP2, TP3** as staged exits
Related Reference Charts:
* BTC.D Analysis – Bearish Bias:
* TOTAL:Bullish Bias
*TOTAL3 – Bullish Bias:
* US10Y Yield – Falling Bias Impact:https://tradingview.sweetlogin.com/chart/US10Y/45w6qkWl-US10Y-10-Year-Treasury-Yield-Weekly-TF-2025/
S&P500 Chasing a Retrace - Waiting for Equilibrium After Rally🗓️ Yesterday, I mentioned watching the S&P 500 for a retrace to find a potential long entry. But with the US-China tariff agreement announced, the market rallied hard 🚀—a clear positive for stocks. We didn’t get much of a pullback, and right now, I see the S&P 500 as overextended. I’m not looking to jump in at these premium levels. Instead, I’m waiting for a Fibonacci retrace back down into equilibrium on the current swing for a better opportunity. 👀
My plan: I’ll watch for a bearish break of structure to signal a retrace, then monitor price action as we approach support. If support holds and we get a bullish break of structure, that’s when I’ll look to get involved. 🔄
Just sharing my idea here—this isn’t financial advice! 📢

Stock Markets Consolidate Ahead of the HolidaysStock Markets Consolidate Ahead of the Holidays
A lull is expected on the financial markets today due to a shortened trading week related to the Easter holiday celebrations.
It is reasonable to assume that traders will get a “breather” after a news-heavy April, which caused a volatile “shakeout” in the stock markets.
US Stock Markets
On Wednesday, Federal Reserve Chair Jerome Powell was both cautious and somewhat aggressive in his forecasts regarding US monetary policy, stating that Trump’s tariffs could delay the achievement of inflation targets.
In response, US President Donald Trump accused Powell of “playing politics”, hinting at his possible dismissal.
European Stock Markets
On Thursday, the ECB cut interest rates for the seventh time in the past 12 months, and European Central Bank President Christine Lagarde left the door open for further easing.
Analysts had expected a rate cut from 2.65% to 2.40%, so the financial markets reacted relatively calmly to the ECB’s decision.
Technical Analysis of the S&P 500 Chart (US SPX 500 mini on FXOpen)
On the charts of European and US stock indices today, a narrowing triangle pattern is forming, indicating a balance between supply and demand — in other words, price is more efficiently factoring in all influencing elements.
On the S&P 500 chart (US SPX 500 mini on FXOpen), the triangle is highlighted in grey. The ADX and ATR indicators are trending downwards, which underlines signs of consolidation.
From a bearish perspective, the market is in a downtrend (marked by the red trend channel) — but from a bullish point of view, price is in the upper half of the channel.
Although the situation appears “reassuring”, the long weekend may bring a string of high-impact statements from the White House, which could disrupt the balance and lead to a breakout from the triangle.
It is not out of the question that the bulls may seize the initiative and challenge the upper boundary of the channel in an attempt to lay the groundwork for an upward trend (shown in blue lines).
This article represents the opinion of the Companies operating under the FXOpen brand only. It is not to be construed as an offer, solicitation, or recommendation with respect to products and services provided by the Companies operating under the FXOpen brand, nor is it to be considered financial advice.

$S&P500 macro analysis , market approaching correction °•° $SPXHi 👋🏻 check out my previous analysis ⏰ on SP:SPX macro bullish analysis ⏰
As provided it went up up 🚀 completed my target's 🎯 💯💪🏻 ✅ ✔️
Click on it 👆🏻 just check out each and every time updates ☝🏻 ☺️
•••••••••••••••••••••••••••••••••••••••••••••••••••••••••••••••••••••••••••••••••••••••••
NOW I was completely 🐻 BEARISH on the market with in upcoming months SP:SPX
📌 Expecting liquidation pump $6500 - $6700
Invalid 🛑 when complete month close above $6700
¹support - $5500 ( 🎯 ¹ )
²support - $5130 ( 🎯 ² )
🎯 3 ... Will be updated based on market conditions by that time ☺️
📍 A wise 🦉 man said - always having patience " is " always gaining only /-
NASDAQ:TSLA ( i accumulate slowly until it cross above $400 )
rest of stocks i will follow index ☝🏻 i will invest based on market conditions ..... ✔️
S&P as always goes higherAs a routine for s&p we are waiting to see a rally and it’s very probable that this daily trading range would break to up in order to complete the two leg theory

Gold stands outSince the opening of the gold price in the morning, the gold price has almost been rising continuously during the day, without too much retracement, and every K-line showing a negative trend is an opportunity to go long! During this period, we can't wait for a large retracement, and we also chase the trend after the gold price breaks through 2900! The short-term gold price rose again and earned a profit of 10 US dollars to leave the market! Gold is strong, and the trend is difficult to change. It is impossible to go short, and the next step will continue to maintain a bullish mindset. The top K-line of the gold price in the evening has a negative trend. Gold has entered the adjustment market for a short time, so we still wait for it to fall back more! The first support below is 2895. If the gold price falls back to 2896 in the evening, continue to go long!
Specific strategy
Gold 2894 long, stop loss 2883, target 2910

XAUUSD analysis for the weekLet’s craft a forward-looking analysis for XAU/USD (gold) based on plausible macroeconomic narratives, historical patterns, and potential catalysts. Keep in mind this is a speculative exercise—actual outcomes depend on unpredictable events.
Key Factors Shaping XAU/USD
1. Federal Reserve Policy
Bullish for Gold: Lower real interest rates reduce the opportunity cost of holding non-yielding gold.
Risk: If the Fed pauses or signals a "higher for longer" stance due to sticky inflation, gold could face headwinds.
2. U.S. Dollar Dynamics
A weaker USD (due to rate cuts or fiscal concerns, e.g., U.S. debt sustainability debates) would amplify gold’s appeal.
A stronger USD (safe-haven demand during a global recession or Fed policy reversal) could pressure gold.
3. Global Recession Risks
If major economies (EU, China) slide into recession, gold may rally as a safe haven, even if the USD strengthens temporarily.
4. Geopolitical Landscape
U.S. Election Aftermath: Policy uncertainty post-2024 election (taxes, tariffs, fiscal spending) could drive volatility.
New Conflicts: Escalation in Taiwan, Middle East, or Russia-NATO tensions would boost gold demand.
5. Central Bank Demand
Continued diversification away from USD reserves (e.g., BRICS+ nations) may sustain structural gold buying.
6. Inflation Trends
A resurgence of inflation (e.g., energy shocks, supply chain disruptions) would reignite gold’s role as an inflation hedge.
Scenario 1: Bullish Rally (2900–3000)
Catalysts:
Fed cuts rates aggressively (150+ bps total) amid a U.S. growth slowdown.
China’s property crisis spirals, triggering global risk-off sentiment.
Middle East conflict disrupts oil flows, spiking inflation.
Technical Outlook: A breakout above $3,000 (psychological barrier) could trigger algorithmic buying and FOMO momentum.
Scenario 2: Bearish Correction (2800-2600)
Catalysts:
Fed halts cuts due to stubborn inflation (CPI rebounds to 3.5%+).
USD surges as EU/Japan face deeper recessions.
Central banks slow gold purchases, ETFs see outflows.
Technical Outlook: A drop below $2,800 (hypothetical 2024 support) could trigger stop-loss cascades.
Scenario 3: Sideways Churn (2750-2900)
Catalysts:
Markets digest conflicting data (mixed growth, moderate inflation).
Geopolitical “cold wars” (U.S.-China tech/trade) persist without escalation.
Technical Outlook: Range-bound action as bulls and bears await clarity.
Strategic Takeaways
Prepare for Volatility: Gold will react sharply to Fed policy shifts and geopolitical “surprises.”
Watch the USD: A sustained DXY breakdown below 106 could turbocharge gold’s rally.
Risk Management: Use options or trailing stops—gold’s moves could be exaggerated in thin liquidity.
Final Note
By February 2025, gold’s path will depend on how 2024’s unresolved macro risks (debt, inflation, elections) unfold. While the long-term bullish case for gold remains intact (debasement hedging, de-dollarization), short-term swings will hinge on Fed credibility.
PLEASE BOOST US FOLLOW US AND SHARE OUR ANALYSIS

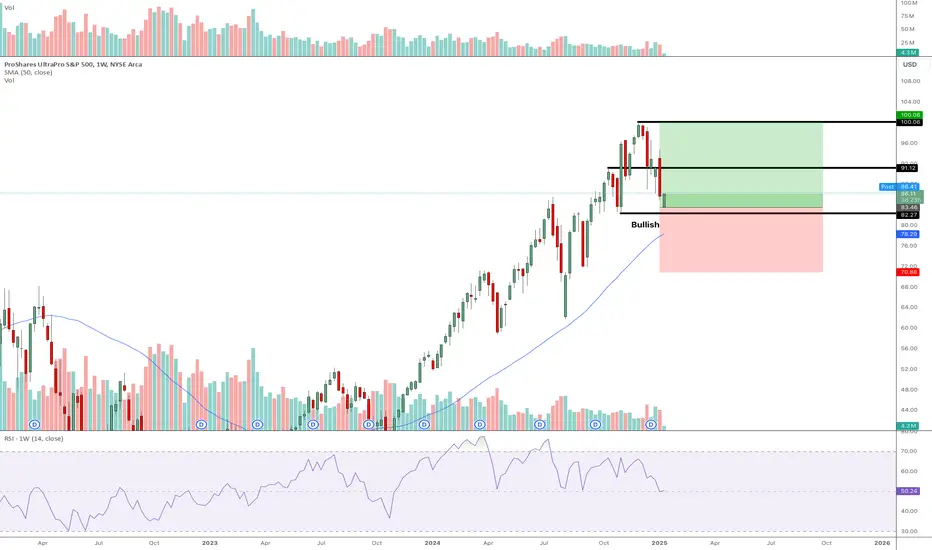
Building Long Position in UPROBased on my technicals, UPRO begun trading at a discount level after last Friday's close (weekly candle). I look at price in a specific format using the RSI indicator.
Price trading below 50 level = discount , price about 50 = premium. So currently UPRO is at a discount for my liking and I've begun investing some capital here.
Current upside to previous highs is about 20% ROI, so if price continues to head bearish I will continue to DCA (dollar-cost average) down and lower my cost-basis.
S&P Completing Head and Shoulders Pattern?The S&P 500 tradingview.sweetlogin.com might be completing a head and shoulders pattern—a classic bearish signal.
We’ve been following this for a while, we've seen the left shoulder at around 6,000 high, which hit on the SMP FOMO-o-meter, the head near 6,100, and a potential right shoulder at 6,000 high. The key neckline sits around 5,800—a break below could target 5,600.
Watch for volume spikes and economic data to confirm the move. But if the S&P pushes above 6,100, the pattern is invalid. Stay ready—this could shape the market! *Video being uploaded. Link to channel in profile *

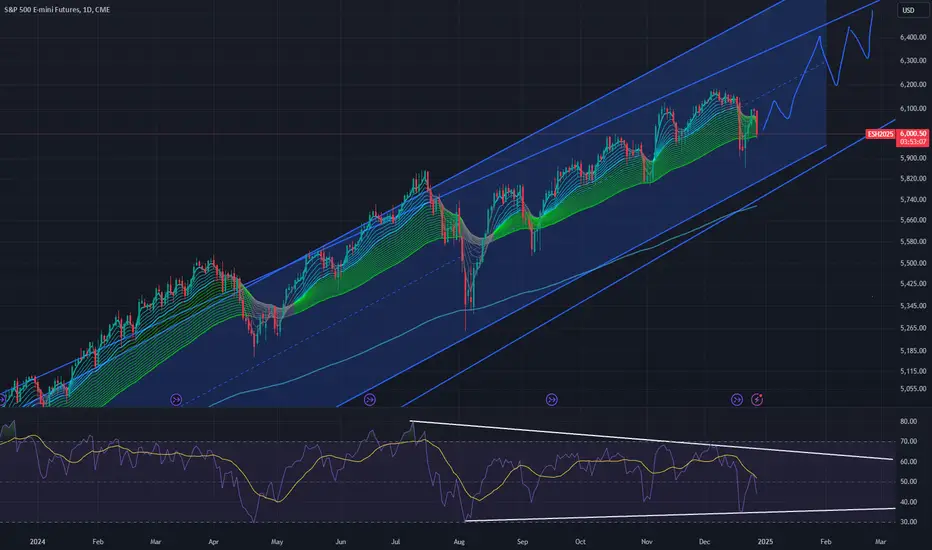
S&P should keep on grinding higher short termNo indicators of a major dump imminent on ES1 (SandP futures), chopping upwards seems the way to go.
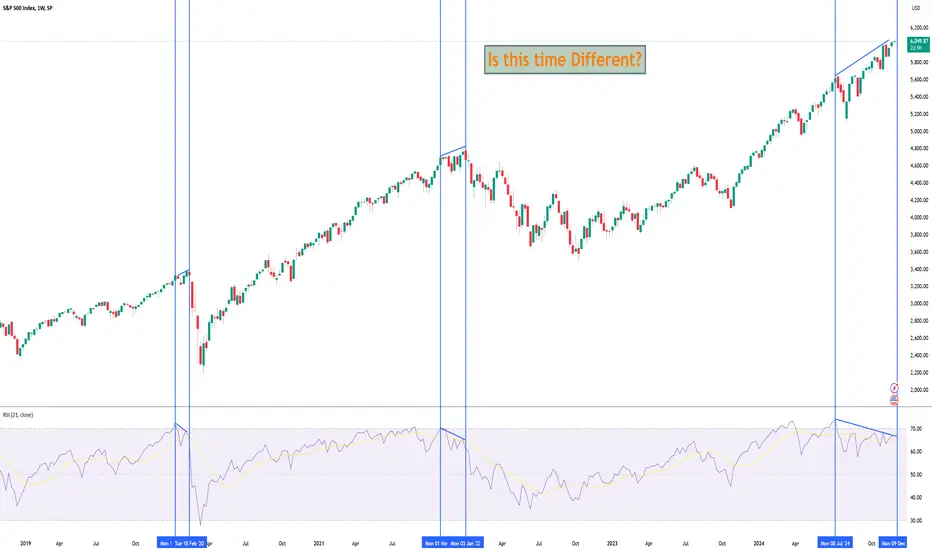
S&P 500: BEARISH DIVERGENCE ALERT – Is This Time Different? Alright, listen up, my chart-watching warriors! 🎯✨ We’ve got ourselves a spicy situation on the S&P 500 Weekly Chart, and it’s SCREAMING caution right now. 🚨
The big question? “Is this time different?” Spoiler alert: Probably not. Let’s break it down 👇:
🚨 Bearish Divergence 101
First, let’s talk about the elephant in the room: BEARISH RSI DIVERGENCE.
📊 Price is making higher highs. (Woohoo, right? Wrong. 😬)
💔 RSI is making lower highs. (Oof. 🛑)
This is like your car’s engine light coming on while you’re flooring it. Yeah, it’s fun for now, but guess what? You’re headed for trouble.
💀 Déjà Vu? History Doesn’t Lie!
Let’s roll back the tape:
1️⃣ Feb 2020: Bearish divergence showed up. Result? BOOM – the COVID crash. 💥📉
2️⃣ Jan 2022: Another divergence. What happened? The market went full bear mode for a year. 🐻🔥
And now? Here we are in Dec 2024, and the exact same pattern is rearing its ugly head. Do we really think this time is different? I don’t think so.
👀 The Bearish Setup:
📈 Trendline Resistance: We’re right at the top of a multi-year rising trendline. This is a make-or-break zone.
💔 RSI Downtrend: The RSI is already sloping down, showing weakening momentum. Buyers are running out of gas. ⛽️💨
💡 Translation: This rally’s on borrowed time, folks.
🔥 George’s Hot Take:
This is what I call a “SELL THE RIP” scenario. Here’s the plan:
1️⃣ Watch for a rejection near the current highs (6,050–6,100).
2️⃣ If we break below 5,800, it’s GAME OVER – bears take the wheel. 🐻
3️⃣ Targets? 5,400 is in the cards, and if things get ugly, we could be staring at 5,200.
BUT WAIT… IS THIS TIME DIFFERENT? 🤔
You’ll hear the permabulls saying, “Oh, the market is resilient, blah blah.” Sure. But guess what? Patterns don’t lie.
If this divergence plays out like it has TWICE before, we’re looking at some serious downside. Don’t fight the charts, fam. 📉
Final Thoughts from the Bear Cave: 🐻
The S&P 500 is flashing warning signs loud and clear. This isn’t the time to be a hero. Play it smart:
Tighten stops. 🚦
Hedge your longs. 🛡️
Be ready to SHORT if we break support. 🎯
Let’s see how this plays out, but remember: The charts always win. 👑 Trade safe, my legends. ✌️
SPX macro analysis ⏰ Hello 👋 it's me your RAJ 🙂 professional trader ✨
This idea 💡
is completely my own analysis to explain situation _&_ market conditions of CBOE:SPX
How this chart valid for long term 📌 explained clearly based on technical #TA 📌 #DYOR
Let's go with market conditions 1st 👉
PPL 📌 thinking 🤔 big crash in S&P500 , based on economy and some other theories
I don't this things go , if this happens 😂 it will vanish not only stocks or companies even goverment also get vanish
Money 💰 >> PPL work / save in -> gold , bank & stocks
Money 💰 >> banks -> save in ->> gold , stocks & giving loan to company & PPL 📌
Money 💰 >> companies -> save in future growth 📈 give return to retailers and keep on increasing vlaue for future like NASDAQ:AAPL , NASDAQ:GOOG , NASDAQ:AMD etc ....
if stocks lose 📌 PPL lose 📌 if ppl lose 📌 goverment also lose 📌 biggest revaluation 😂
This is the major index ☝️ for many stocks , did you think 🤔 it will crash 🩸 that much harder 🙂
Use 🧠
👀 Let's go with my technical analysis ⏰ #TA ->> how I am expecting macro growth 💹
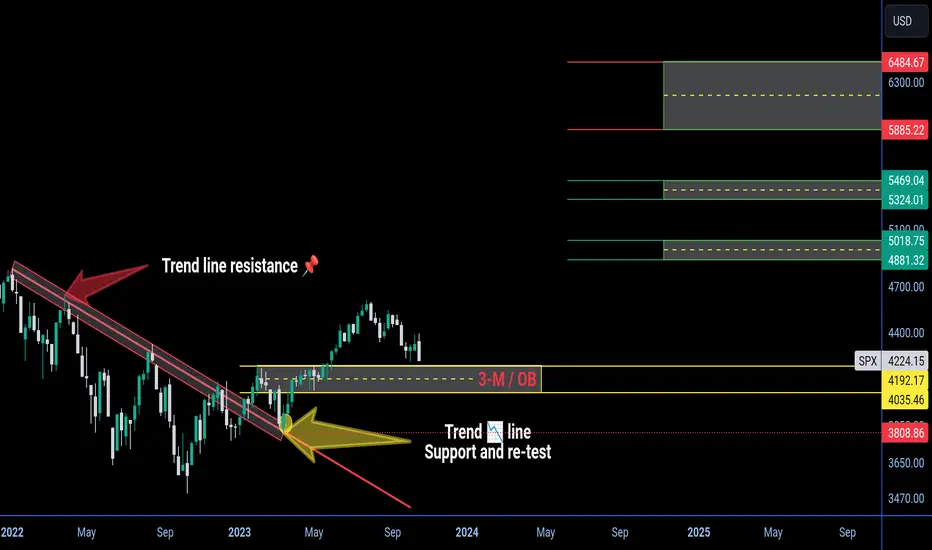
👀 There tend line 🙄 at previous High 2022 > to < 2023 which actually promised
trend 📉 line and even turned as resistance 📌 for 1.2yr
+
Finally it was broken and re-test also done 👍 turned as support 📌 💜💚 🚀
👀 According technical analysis 📌 my analysis get Invalid 📌 when month close below $3800.2
👀 There was oder block strong 🚀 support 📌 in 3 - month $4000-4200
👀 The previous order block at $4300 & $4600 easily broken 😂
These and some other theories making me push towards new high 💰
Expecting target's 🎯
🎯 :: $4880-$5018 ( easy target )
🎯 :: $5324-$5469 ( 💯 target )
🎯 :: $5885-$6484 ( high pressure resistance )
Support 📌 $3900-4200
This is my analysis on S&P500 on macro , i will post other patterns and chart of technical as per education under this post 📌
-----------------------------------------------------------------------------------------------------------------------------------------------------------
🪩 disclaimer :
▶️ TQ u for supporting 💚 follow idea 💡 get updates everytime ⏰ when I updated 📌
Note 👀
👉 keeping comments , reacting with emojis , pointing us is very easy to some people
They think 💬 what they see 📌 that was knowledge 📌
We need to learn market in many ways and should get adopted with experience, TECHNICAL ANALYSIS won't help understanding market structure and understanding bull 🐂 and bear 🐻 is more important
Economical conditions
Fundamentals
Technical
News
Sentiments
Checking macro to micro having good plan and build it is very important ☺️
Some Times market easily turn suddenly bear // bull 🤣 even we need to catch 🫴 those movements is also very important ☺️ 💛
I hope i cleared my view 🙂 if any points if I miss I will add in update 📌 post
Try to understand, try to learn - try to move with flexibility with market is important
Have good day 😊
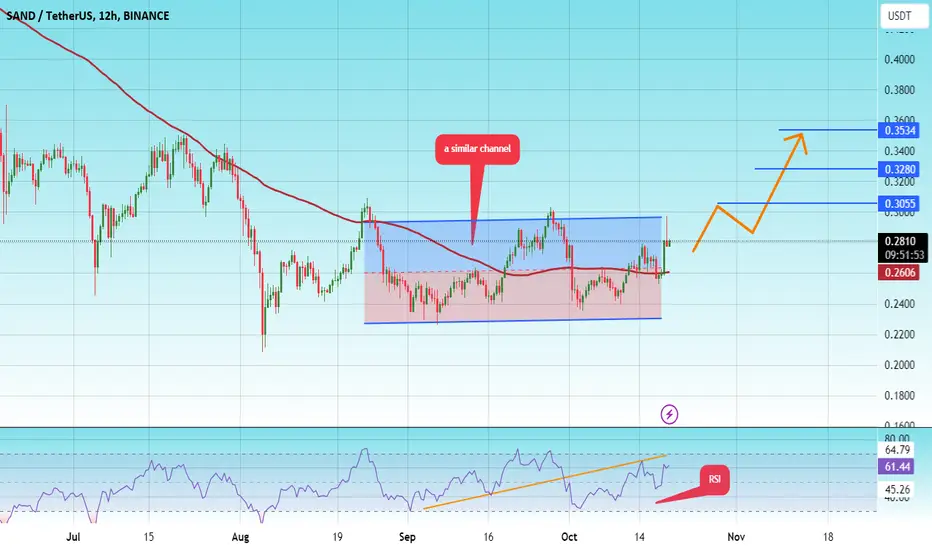
#SAND/USDT#SAND
The price is moving in a similar channel on the 12-hour frame upwards and is expected to continue.
We have a trend to stabilize above the moving average 100 again.
We have an upward trend on the RSI indicator that supports the rise by breaking it upwards.
We have a support area at the lower limit of the channel at a price of 0.2380.
Entry price 0.2800.
First target 0.3055.
Second target 0.3280.
Third target 0.3533
SPX will reach 6000Stocks are going hyperbolic, not because of a healthy economy but because of unbounded inflation and QE infinity. 1929 will look like a firecracker when this explodes.

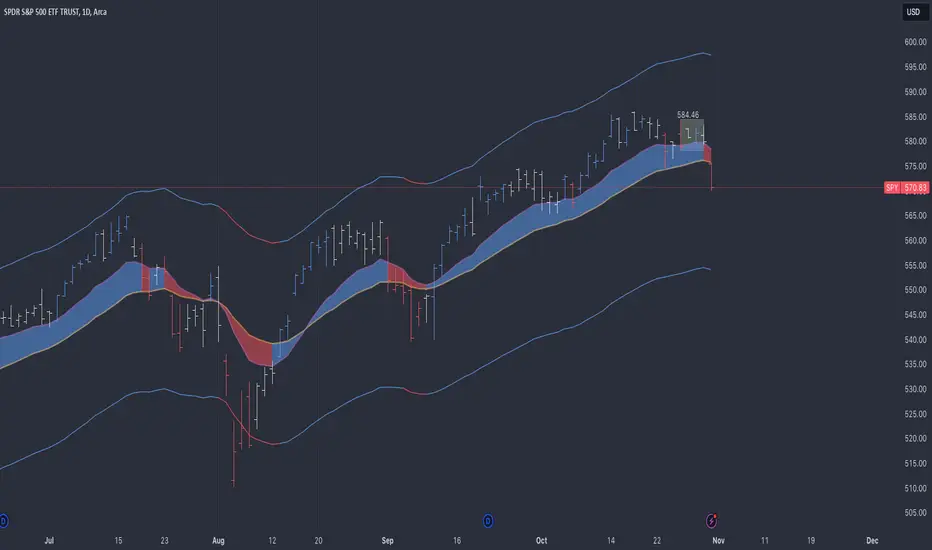
$SPY tough spot right now, but there's still a glimmer of hope!On the daily chart, there are three bearish signals without even considering indicators:
1. Price is below the EMAs.
2. With a gap down.
3. From a coil spring.
On the weekly chart, the trend remains intact. However, if we drop below the fast EMA, a significant test will be the slow EMA.
The key level to watch is the low of the daily channel line at $554, which aligns with the weekly slow EMA at approximately $551. For me, that represents the definitive line in the sand for SPY.
Having a Look at the S&P...It looks Bullish...Many of my trader friends trade the S&P. I dont because I trade London session. But im having a dabble in it to see if I can understand how it moves.
