SandP500 with pattern immediately following 2008 correctionPrice action lines up pretty close, that's why I would like to see more of a consolidation here, and a break of 3000.00 low, but very momentarily if it happens.
Sandp500


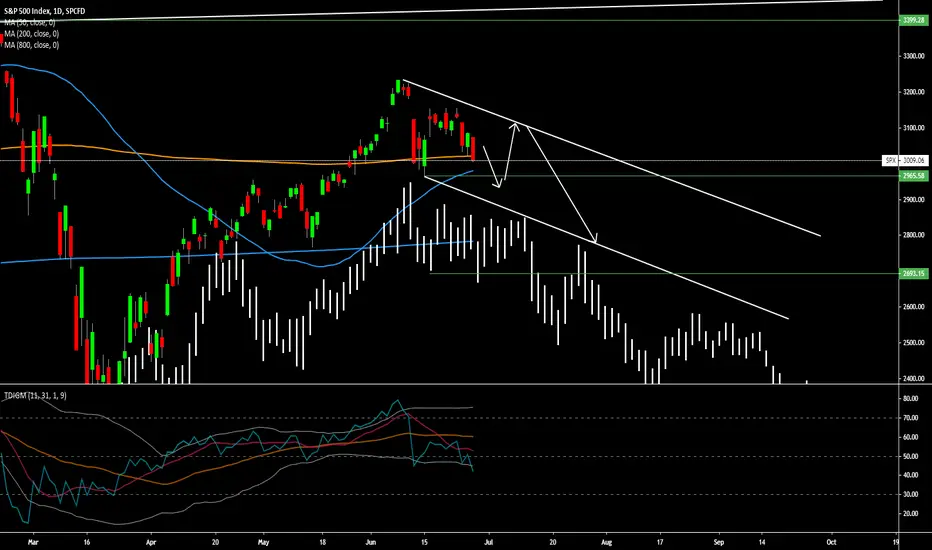
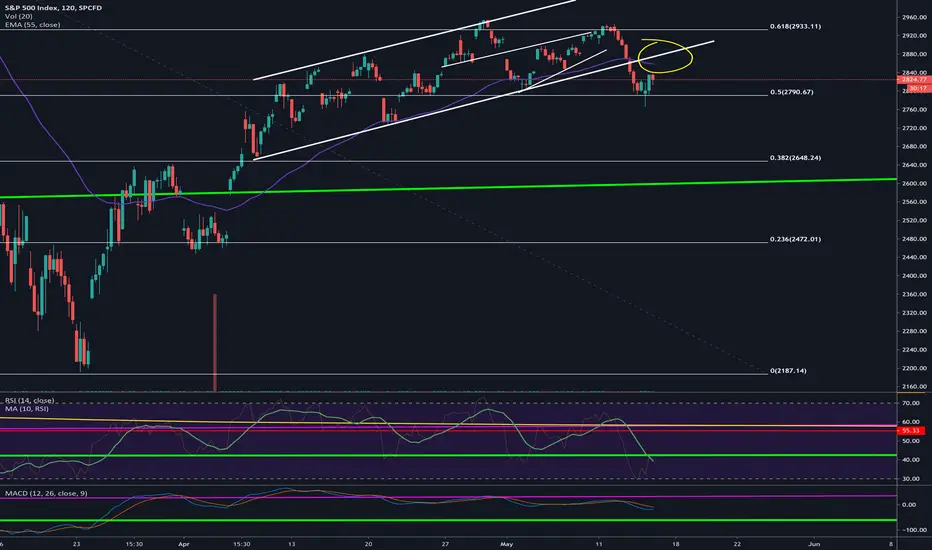
SPX Topped Out? Channel Neckline Breached | Bearish PA Todays analysis – SPX – breaking bearish from its long-lived multi-month ascending channel
Points to consider:
- Channel support breached
- Testing daily support and 200 DMA
- Bearish price action
- RSI breaking below 50
- Stochastics oversold
SPX needs a daily body candle close below channel support for a bearish bias in the market.
Currently retesting daily support, in confluence with the 200 MA where price previously held support. However a weak bounce, forming multiple bearish engulfing candles, price is likely to break down further.
Breaking below $2960 will form a technical lower low and an S/R flip at daily support confirms a trend reversal, solidifying the bearish bias.
RSI has broken below 50, indicative of increasing weakness in the market. Stochastics are oversold and may remain oversold for some time.
Overall, in my opinion, further price development is likely to confirm trend reversal as price retraces lower from these levels, validating structural support as the next technical target.
What are your thoughts? Let me know in the comments below!
And if you’ve read this far - thank you for following my work!
As always,
Focus on you, and the money will too!

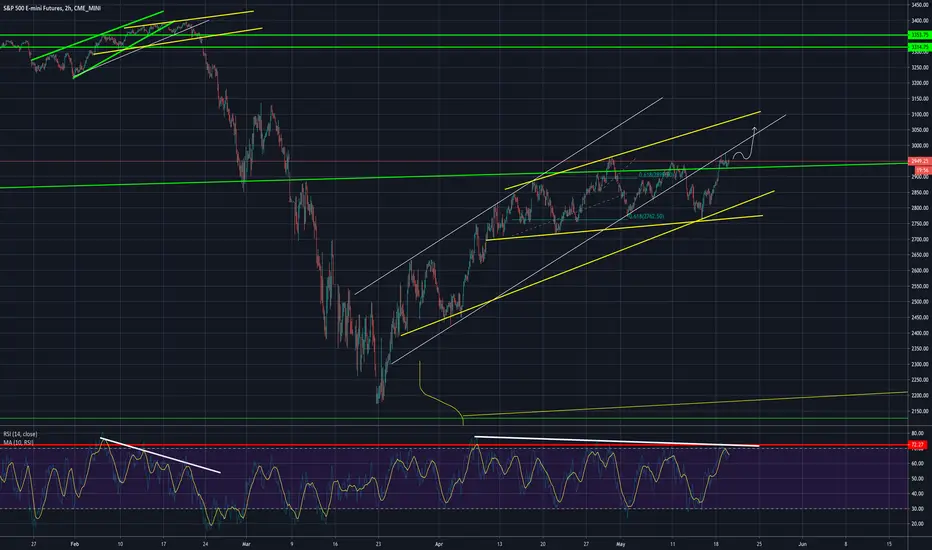
SandP revised- This is what it will doWhen I look at our divergences and moving averages, I have to assume the SandP is not finished yet. The other scenario I posted is possible, but when you look back like I did, u see that every time the SandP is in this position it crawls up. Due to the wave count, I would expect the move up to be part of a flat correction....
SandP500- this week's predictionI expect SandP to break the low, then pull up and make a similar type pattern it just made, then we get the larger move down. I'm analyzing 100's of patterns today in order to predict exactly how deep this correction will be. I think I know but want to be more sure. I will make the greatest trading video ever made this weekend.
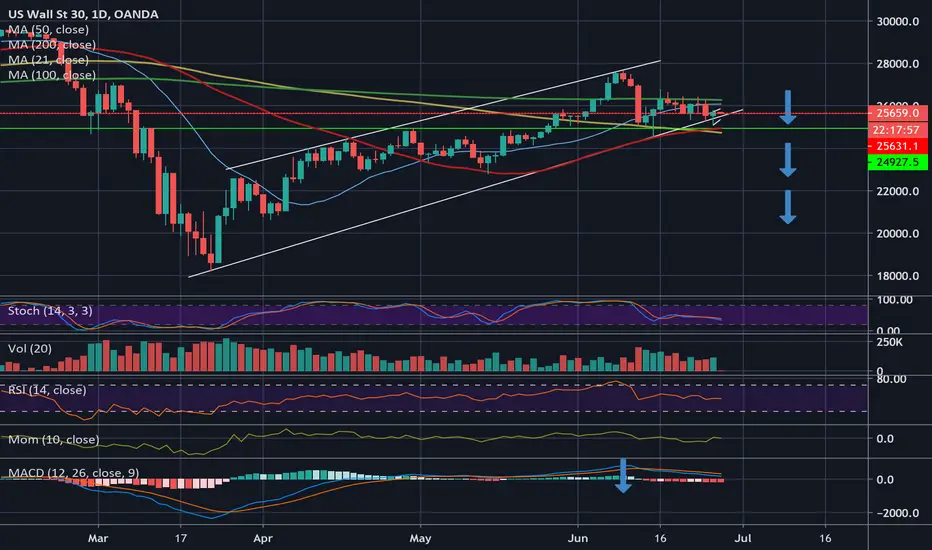
Dow go short break of rising wedge expectedDow really overbought and with all the talk of trump being way behind in the polls a bit of a retracement is due to the first green support zone and probably lower.
E-mini S&P500 intradayHello traders,
The E-Mini S&P500 future has marked a high volume with that special candle. We expect an increasing trend right now. It will try to increase in order to reach the resistance R0. If it breaks R0 it will try to reach R1.
But if it can’t reach R0, we should wait that first red volume and candle to sell and take profit.

SandP500 with Under Armor Bars pattern overlay.The SandP pattern was reminding me of something, and I realized it was Under Armor. I would expect small flat like structure on 1HR to produce a nice sell to continue down.
S&P500 Higher Lows Have Reversed into Lower Lowers The 11 year rise of US Indices had continuous higher lows. This trend is over and now appears that lower lows will appear at a faster frequency but at a similar trajectory in reverse.

Trade Reversal Pattern - Evening Star - S&P 500Here is an educational idea. Please do not consider this as a trade idea unless you consider market sentiment and fundamentals that go along with this technical analysis. Trading solely on technical analysis (such as this trade pattern) can turn out to be costly.

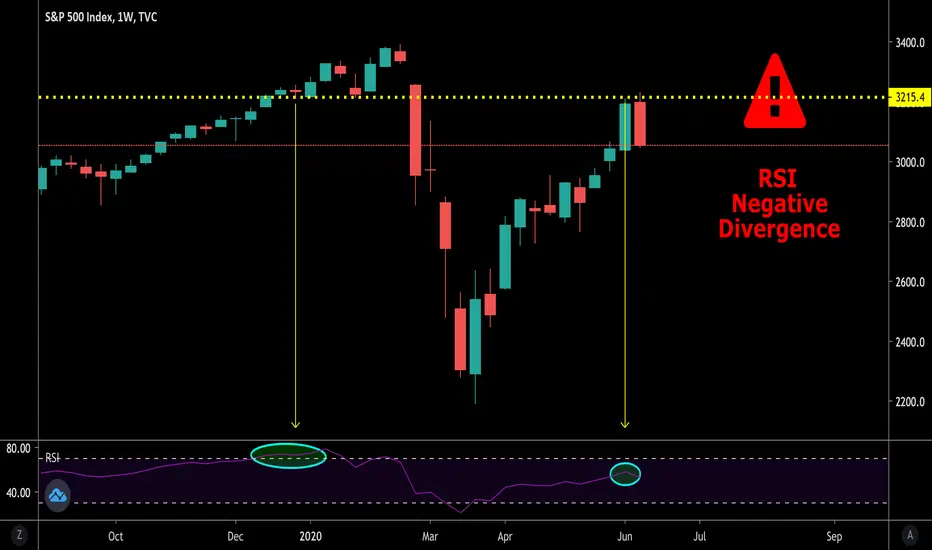
S&P 500 - Strong Selling SignalNegative RSI Divergence indicates a strong bearish signal.
RSI is currently at 53, the trend reversal will accelerate once RSI falls below 50.
Nasdaq - Strong Selling SignalNegative RSI Divergence indicates a strong bearish signal.
RSI is currently at 58, the trend reversal will accelerate once RSI falls below 50.

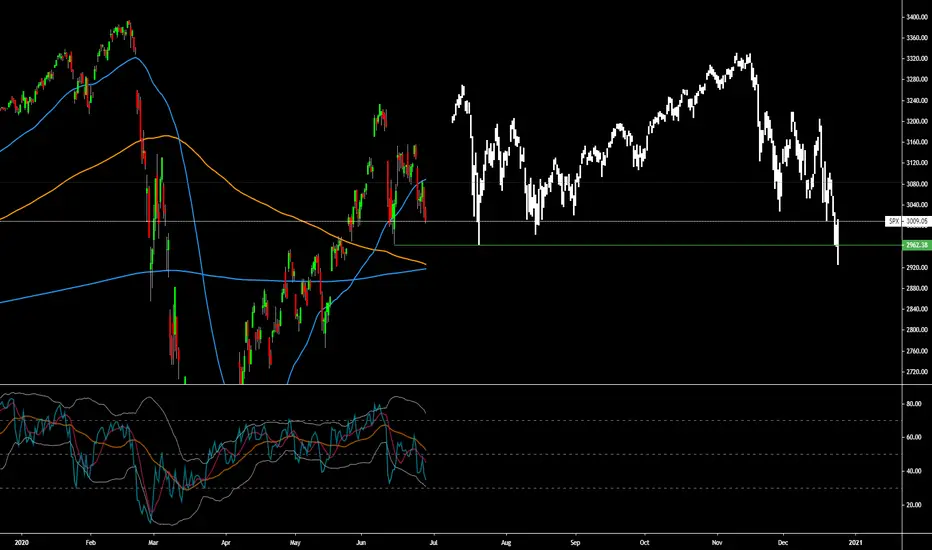
s&p 500 with -50% crush at 1500 till end of the 2020SPX crushes never stopped above MA 200.
Even FED pump of 3 trillion into market, buying even stocks of companies that are in bankruptcy, would be over.
Earlier or later the crush of -50% will happen as of people will need to sell something to pay bills - already 20% unemployed, 30% not paying rent or mortgage bills in time.
As long FED pumps money to keep the dead market breathing as hard would it be when the market will awaken.
In 1929 it was the speculators who pumped the market 4 times from 7 to 30 and it crushed below 7.

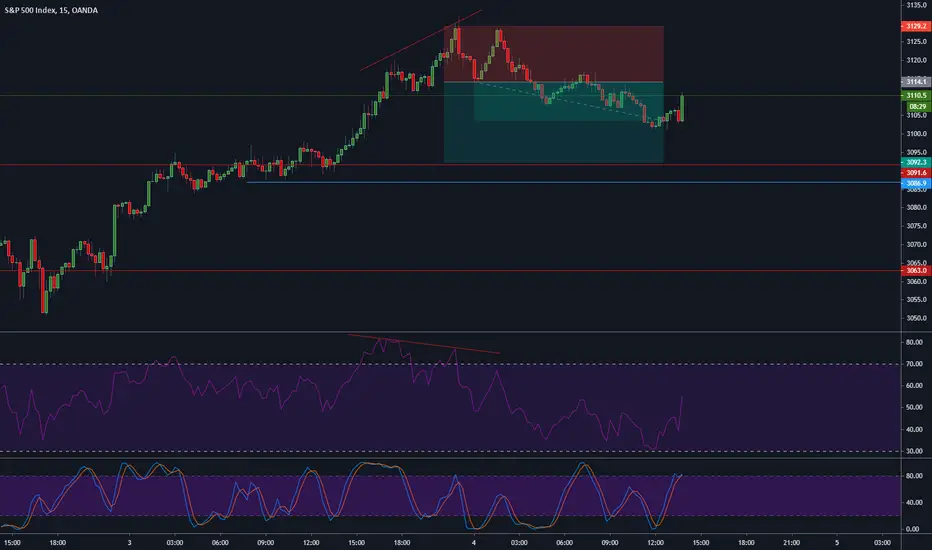
Break A Wave Quick Short to 3092 SHORTTERMJust a quick correction of my last post :)
Still in play
Owen Concept of the Market
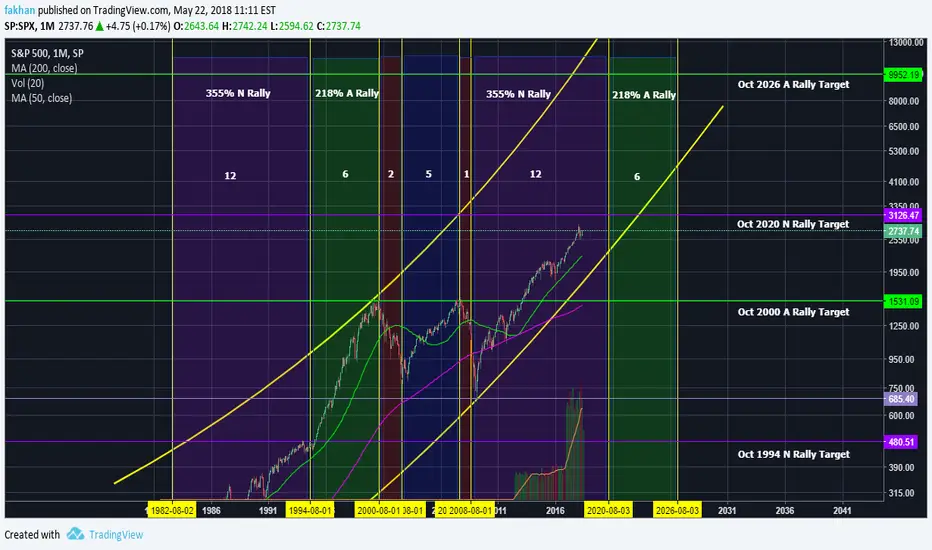
S&P 500 Next 8 Years Targets (12,6,2,5,1 Fractal Analysis) S&P 500 has followed what I call a 12,6,2,5,1 Pattern. The price rallied at the beginning of 1982 and completed an N Rally after 12 years reaching a price target of 480. After that, it began an A Rally to reach a price target of 1531 in 6 years. This was followed by a corrective phase of 2 years. It was followed by an Inert Rally of 5 years (shown in blue) which drove the price back to where it fell from. After than began the steep correction of 1 year which dragged the price to 685. That marked the completion of my 12,6,2,5,1 pattern.
N Rally to 3126 (Oct 2020)
My 12,6,2,5,1 pattern took a new start at the beginning of Oct 2008. We are currently in an N Rally with a projected 355% price rally to reach a target of 3126 by Oct 2020. Theoretical Explanation: The market has heated up significantly. The introduction of cryptocurrencies has provided investors with new opportunities. A sluggish N Rally towards 2020 shows ample confidence in the market but stock market interest seems to be fading.
A Rally to 9952 (Oct 2026)
After the beginning of the N rally, the price will start to rally more aggressively to complete an A Rally by Oct 2026 with a 218% price surge to reach a target of 9952. Theoretical Explanation: By the end of the N Rally of 2020, many investors would have focused their attention on cryptocurrencies. Some blockchain projects would have become large corporations by now and would be a part of the stock market. Traditional investors will be able to invest in Bitcoin and other useful cryptocurrencies same as they would in Google, Exxon or Proctor and Gamble. Blockchain companies now being a part of the stock market will give S&P 500 another boost to reach a target of 9952 by Oct 2026.
Post N and A Rally Situation:
The market will heat up again as speculation makes prices of blockchain companies (now listed on NYSE) to skyrocket. This will result in another correction. The price will continue to follow the 12,6,2,5,1 pattern.
Important Observations:
12,6,2,5,1 One was about the Internet (Dot Com Boom)
12,6,2,5,1 Two is about the Blockchain (Crypto Boom)
We'll have to see what 12,6,2,5,1 Three is about.
S&P 500Since we have taken a bullish reaction on this flag we can expect that S&P 500 will continue its upward direction.

$SPX Breakout ComethHere's a chart I've been paying attention to, tracking the similarities between Feb and May.
Truth is, in Feb this broke down. In May, it held and broke out.
Not sure how high we'll go, but here's how I see short-term playing out.
US Markets Maintain Gravity Defying Despite Current World EventsSimilar write up to last week much remains the same until S&P and Dow Break previous highs (S&P above 2900 / DJI above 24600)
S&P: If P action in the next week closes below the orange line at 2723.3 attention will turn more bearish and watch for market to fall to 2460.2. In this instance will reassess market dynamics as it may bounce in this range or continue to fall
Dow: The same flows for Dow Jones with P action in the next week close below the orange line at 22931.5 attention will turn more bearish and watch for market to fall to 20842.4. In this instance will reassess market dynamics as it may bounce in this range or continue to fall
If markets stay above these initial levels for the next 3 months (i’ll be surprised) however this will look like economies are back in order from COVID-19 and running ‘normal economics’
(Print source set to close)

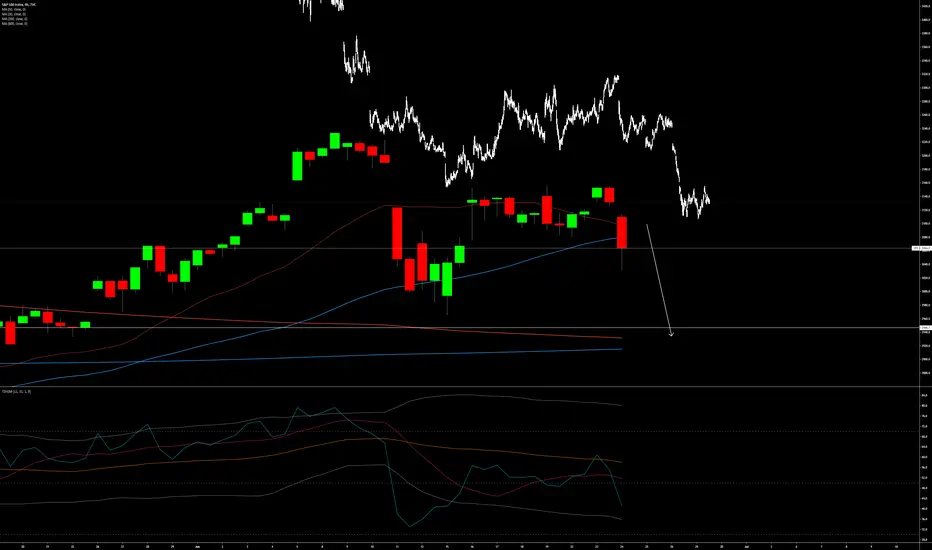
S&P Held for Backtest Before More Downside$SPX
The breakdown has happened, and we held on the 50% fib level.
Would expect to see a backtest of 2880 or so before we resume the descent.
SanP500- Daily Divergence doesn't seem like enoughPlus you have the 200 moving average in about the same spot right now on daily and 4hr, which is right above the high.

s&p buyS&P or SPX We see them resuming to the upside, any changes we will update it as it goes , give this chart a like if you enjoying our forecast

At a Critical Area! $3,000 in our eyesight We are def. at a critical area. I'm still leaning slightly on the bullish side. 3k is a good possibility if we bounce and stay within the upward channel. If support doesn't hold and we drop. I see us then re-testing the $2600 area. Hoping for the best, GL to all with trading.

