SPX SHORT IDEAHello traders.
Are we due for another test of the bottom?
Or will the reopening of the US economy rip through the 200 period ema.
Time will tell,
Live long and profit.
Sandp500

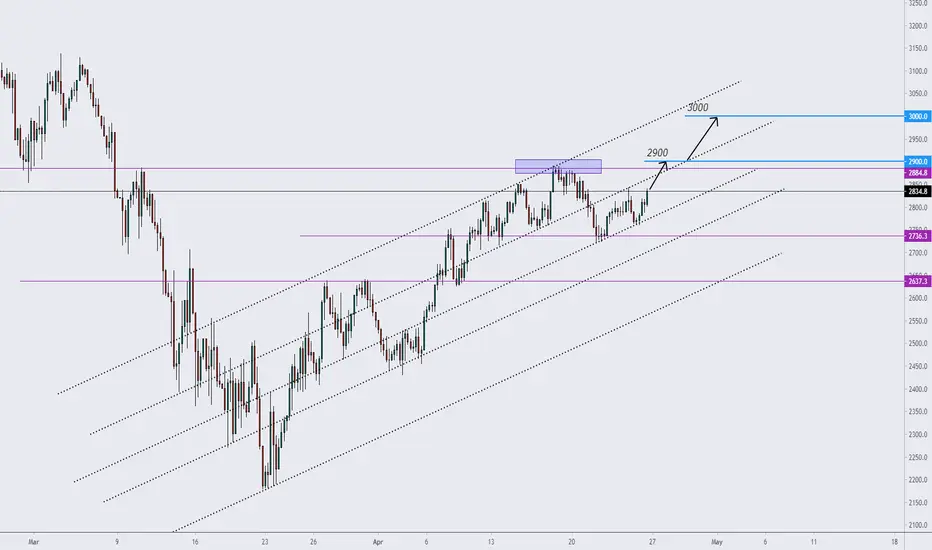
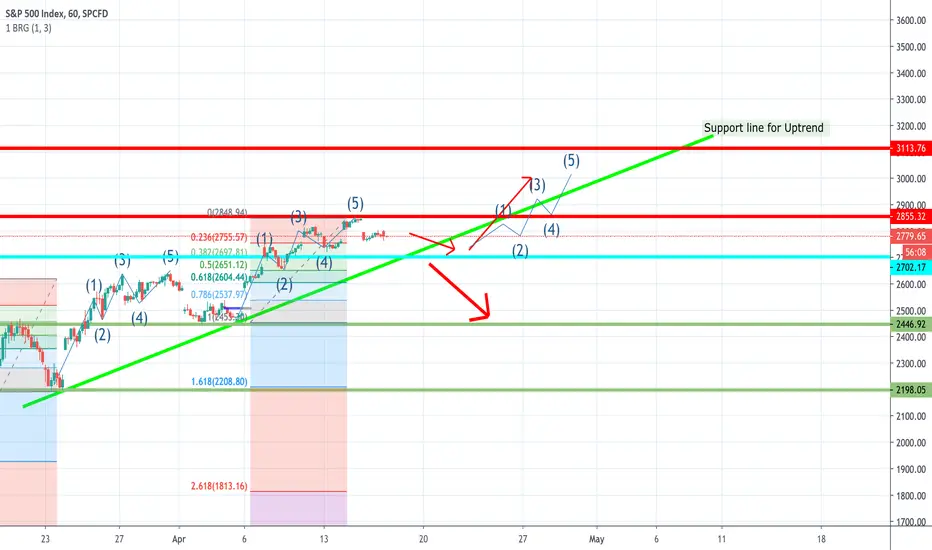
SP500 buy opportunity, when the Fed helping we should be buying.Due to the current market situation, it is possible to see 2900 and 3k target and SP500. The market keeps pushing forward and we should keep buying. Support lines have been shown in my chart, it should be bought in every bounce on them. Until the trend completely changes I see it is a buy.
ABSOLUTE MUST SEE pattern on SPY $SPY DAILYSPY is a chart I always keep an eye on and this pattern has started to form on the daily and, when formed, can be a very powerful pattern to trade and help find good risk reward opportunities.
As soon as I saw this chart in my review this eve, I knew I had to get a video out to the community!
xeenos trading - sending positive energy to all those watching

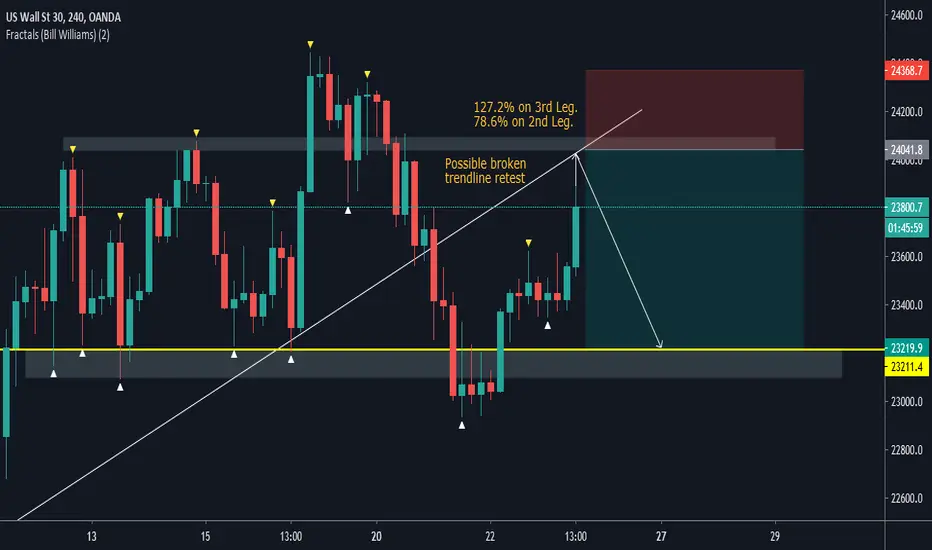
US30USD Intraday Outlook 23/04/20Technicals: Market is approaching a dynamic support turned resistance. if market rejects from the area of interest, it matches with 2 Fibonacci confluences and it'll be another retest of the broken trendline. Take Profit areas will be at the bottom structure Demand zone.
Trader's Arena FX
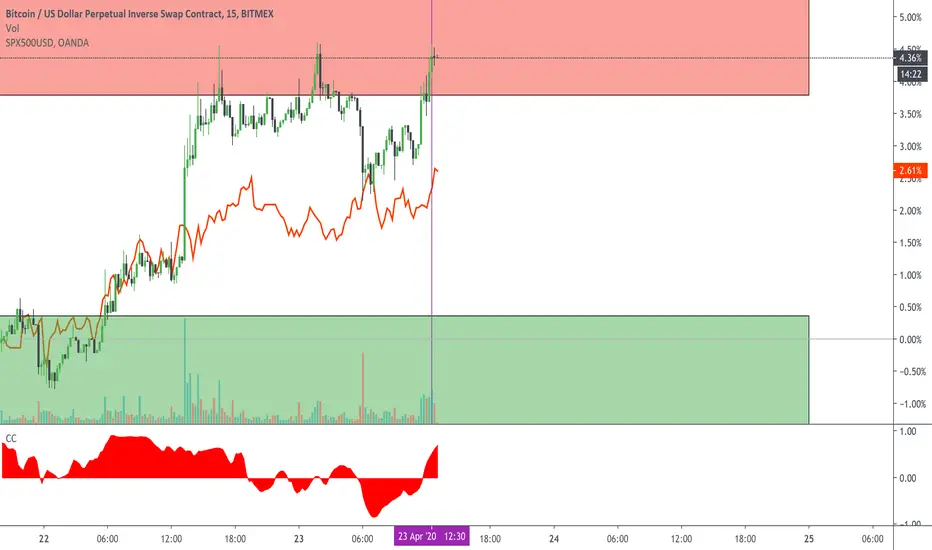
BTC | S&P 500 - Slightly pumped on initial jobless claimsRed line is futures on S&P 500.
CC indicator below is correlation between XBTUSD and S&P 500 on 15m time frame.
Initial jobless claims was released, and rose 4.43 million last week, total is more than 26 million since the coronavirus outbreak started.
S&P 500 slightly pumped as expected (as in previous times) and trying to rose higher, as well as bitcoin.
Won't be long here ('coz we're at resistance), awaiting $7250-7300 for shorts.
Hit the "LIKE" button and follow to support, thank you.
Information is just for educational purposes, never financial advice. Always do your own research.
S&P 500 - Potential Short on the 4H ChartIn this trade I intend on shorting the SPX, S&P 500 or US500 (depending on your broker) following a bearish breakout and close of the potential bearish rising wedge formation.
This trade is based upon the following technical factors that we can potentially see from the 4H chart:
1. Bearish rising wedge formation
2. Resistance at the 61.80 fib retracement
3. Decrease in volume with an increase in price
4. Upper monthly rising trend line is within close proximity which could act as another level of resistance if we push higher in the wedge
5. Elliot Diagonal Wave pattern - although this isn't a perfect formation, it is still a factor to consider
This trade is based upon the following fundamental factors:
1. The Fed can only do so much and most of the economic damage is still unknown
2. Much of the recent bull run, dead-cat-bounce or correction is now in what I believe to be the hysteria phase with no backed up reason as to why its still going up
Of course we can't dismiss the possibility of the continuation to the upside. The cases of COVID-19 are now getting lower each day and it appears that we are over the worst. This could be the reason for so much recent buy in.
The trade entry will be based upon a breakout and close below the bearish rising wedge formation. The SL for this trade will be above the 61.80 fib retracement and above the breakout area in case we get a re-test. The TP level will be targeted for the lower descending trend line which could act as a double-bottom within this price range of the recent lows. The entry and SL are variable depending on where we breakout of this formation therefore I won't be providing precise trade details other than the position in this chart.

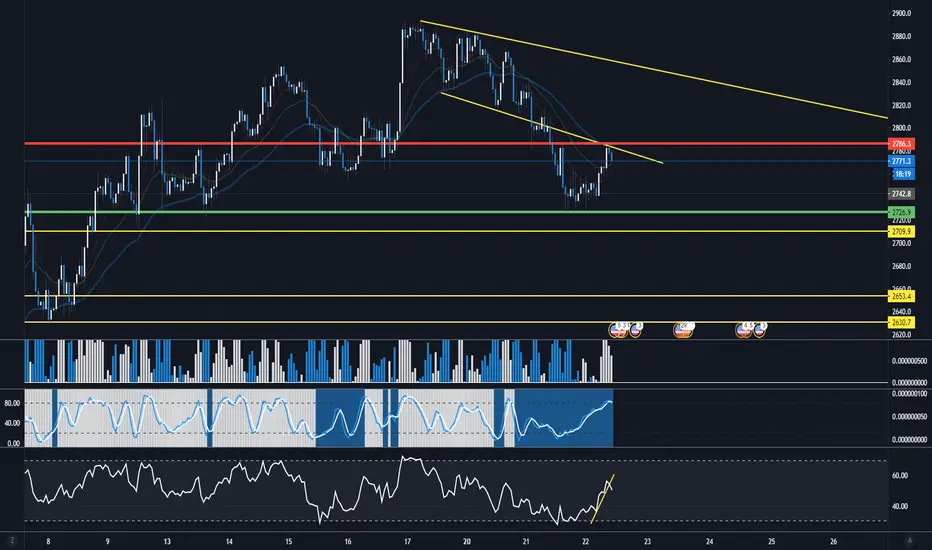
SP500 - Short OpportunityThere is an opportunity to short the SP 500 on bounce off the descending channel support line turned resistance.
- Short entries may be initiated now at the peak of the recent pullback from 2726.00 around the 2770 region.
- Stop Losses should be above the swing high of corrective 2772.6 (Red Horizontal)
- Target Point A: 2726.9 (Green Horizontal)
All remaining target and intermediary support zones to the downside are marked below entry by consecutive horizontal lines (Yellow)
Is the next Major Crash Beginning?Is the next big crash starting?
OANDA:SPX500USD
I've been watching the S&P closely for the last month during our recovery phase. It's been a great ride up, but today it's starting to look like the cracks are once again forming.
The below analysis is as I see it. This is not advice. Please do your own research before entering any trade.
Signs of a potential reversal:
1. We have recovered to the point of reaching the "Golden Pocket", which is the idea place to open a short for minimizing risk, between the 50 and the 61.8 Fibs.
2. We have seen a bull flag formation on both the Daily and the 4hr, with both breaking down and out during the last trading session.
3. We rejected off the 50 day moving average on the Daily.
4. Moving average on Volume is reducing.
5. MACD line has turned and looks poised to cross down below the signal line.
6. CCI is trending down and fallen out of upward channel.
None of this guarantees that a crash is coming, but it's certainly got me interested.
Potential SHORT Trade Setup
ENTRY: 2740-2770 (Anywhere here)
STOP LOSS: 2970 - 6.89% (Clear those fibs)
TAKE PROFIT 1: 2320 - 16.73%
TAKE PROFIT 2: 2176 - 21.70%
TAKE PROFIT 3: Let run
RISK:REWARD: 1:2.4
As per normal risk management practice, once the trade starts moving, reduce your SL and potentially apply a Trailing Stop in a fast moving market.
Please DO YOUR OWN RESEARCH!!
Happy Hunting!


S&P SidewaysNiftyBank is in temporary downward momentum tracked with Elliot Wave .
History might repeat i.e. Up mementum can be seen with Fib retracement levels.
Check for gap up openings and go long accordingly
S&P, Gold & BTC Correlation - when safe haven?For the last 6 weeks or so, there's only been one thing to trade - The Market, as everything moved up and down together, gapping violently based on news.
These daily charts show how the stock market (SPX/S&P 500) has correlated with the historical safe haven asset of gold (XAUUSD) and the promised new safe haven of Bitcoin (BTCUSDT). The red indicator at the bottom is the standard TradingView Correlation Coefficient (CC).
In the first chart, BTC - in blue - largely moved with the S&P, showing a high CC throughout the crash. Notably, it had a more extreme flash crash (crypto loves extremes), and also recovered off the bottom more quickly. These differences aside, BTC remains highly correlated with the stock market for now.
In the second chart, gold - in yellow - at first continued its rise as stocks fell, but then had a sharp selloff of its own. It's been reported that this was probably due to traders being forced to sell positions in order to avoid margin calls as equities got smashed, and that sounds reasonable to me. Since that started, gold has been very highly correlated with stocks, falling and recovering together.
In the third chart, perhaps somewhat redundantly, we can see that since March 9 or so, gold and BTC have become and stayed well correlated.
Where next?
Notably, gold has now exceeded its pre-crash high, while stocks are still down 16%. Gold is also trading well above all of its daily moving averages, while the S&P is still underneath the 89 and 200. This is at least some technical reason to think that their trajectories might be different soon.
My bias, based on fundamentals, is short equities and long precious metals and crypto. But I can't trade that until their correlation drops – until the further drop in the stock market that I think is coming panics gold investors not into selling, but buying. So I'll be watching this chart carefully.
+Obligatory "I'm not an expert, this isn't advice". Stay safe out there!


Can Elliott Wave Predict the Next Move in US Markets?I had a quick look at the Indices and I can see a Clear 3-4 Formation. In this video I will draw some wave numbers.
I am not a strict elliotician and this is my FIRST EVER tradingview broadcast so please forgive my mistakes.
Has S&P 500 Completed a Wave 4 Up and Ready for a Wave 5 Down?
I do have a blog if you're interested Just search Immy Yousafzai Forex Trader , you should find it...


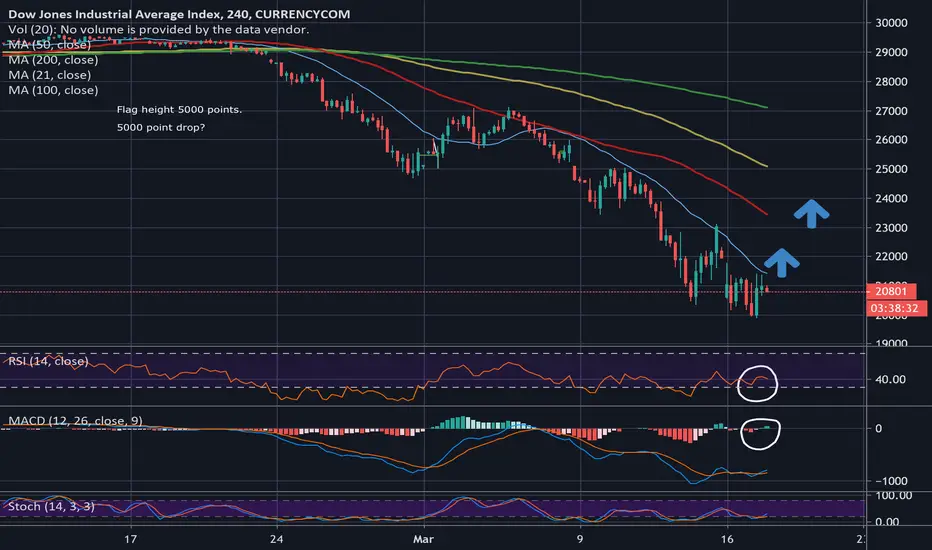
Dow strong buy! 4hr divergenceThe dow looks good for a bit of a pump up after all the selling. RSI and MACDH both showing nice divergence.


Is there any hope left? Let's look at the BIGGER pictureLet's take a look at the long term logarithmic scale to view the long term trend of the S&P 500. We have completely broken past the monthly support and broke the .382 fib support level. Having analyzed the daily RSI we could be looking to form a bullish divergence that could lead us to a miniature relief rally to retest our old support and confirm it as resistance. If that is the case, then my downside targets are between 1500-1700 and I expect buyers to step in. That area is the .618 fib level as well as the multi year resistance from 2000-2007 and from a bullish technical perspective, you would want your old resistance to become new support. If that level is lost then our global economy could take YEARS to recover. If you like my analysis please give it a like and a follow for more. Thanks :)

$SPX | Bearish Move ConfirmedIn light of pandemic, the SPX Index will fall to levels defined on chart. Recession is now in session.
Good Luck.

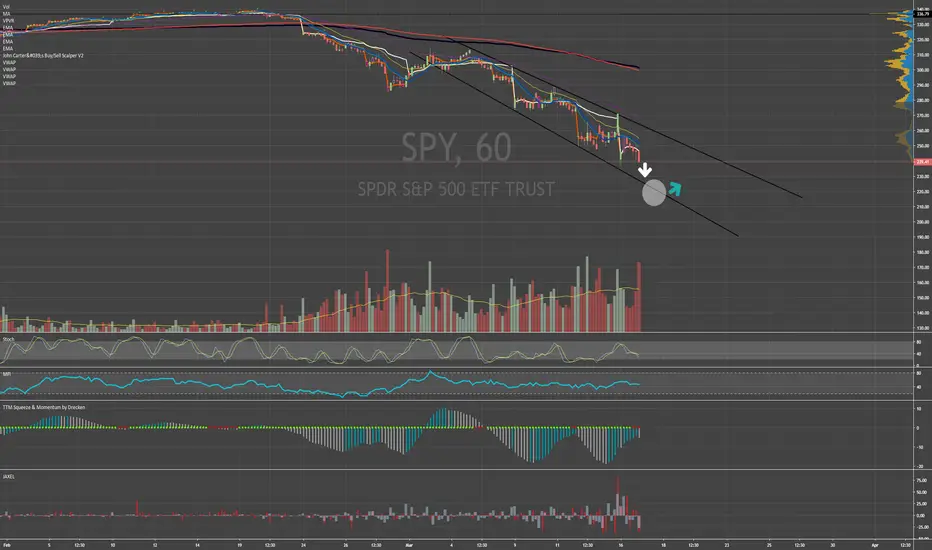
It is time to accept reality..Ladies and Fellars I try and stay as bullish as possible, but this is probably the most optimistic TA based off the current reality (Even if it doesn't seem optimistic)....
The reality is, life is going to get much worse for all of us in the USA before it gets better, any rally before the virus comes runs its course through the USA will be a defeating false hope that will likely destroy your emotions. Some of us may not like to admit it but in the USA we overreact and when stuff gets bad we will overreact. That being said we will see small pops, maybe, but they will fade quickly, just like Europe this morning.
We may technically be up from yesterday but be cautious Spy is struggling to hold itself high..
A simple falling wedge with room still to fall. While I could be wrong I would say the likely and best positive case short term is a slow bleed, rather than steep fall because no matter what happens day to day over the next few weeks we will likely keep falling.
Let me know your thoughts..
Buy opportunity on NASFed is supporting the stock market as much as possible, in this virus spreading a hard time.
I present my 2 possible entry to buy NAS100. Hope things will get better eventually.
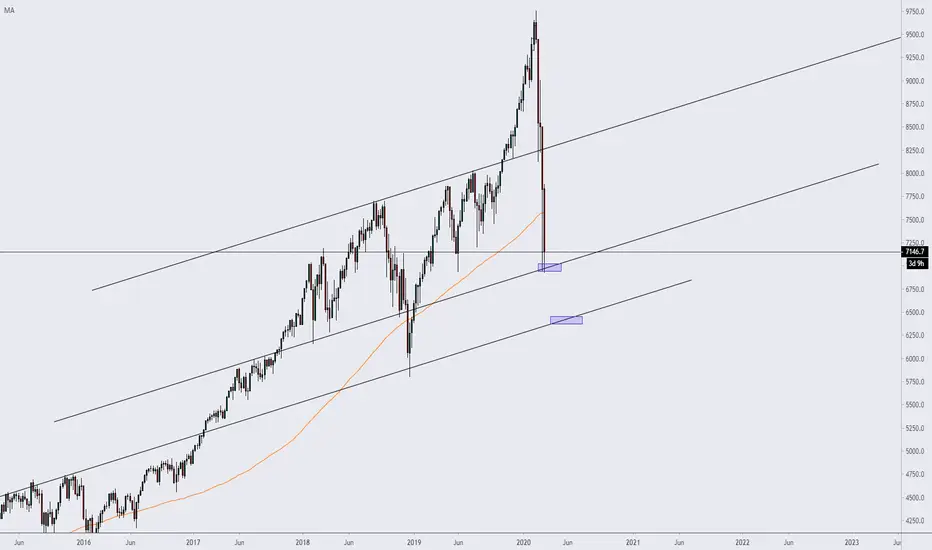
SPX - 5 Year IdeaWith the events that are currently spurring around the world it poses a great question as to whether a bear market is possible to be sparked in this climate. Only time will tell, but the historical trend line on this chart by itself looks plausible...
50%+ declines have been seen numerous times throughout the past 100 years, and as its been a longer than usual period without a sharp decline that could signal one to be just around the corner.
- COVID-19
- OIL price war
- Historically low interest rates to spark consumer spending (stimulate the economy)
- High house prices
- Manufacturing slowdown (especially in the EU)
I'll be consulting this chart in 5 years time to see how wrong I was - or right...
