There's nothing bullish about the s&p500There is nothing bullish about the S&p500.....
We got rejected by .382 . stop loss should be placed by the .5 level
Sandp500

SPX - Short wave 4 coming up? If this is possible, then expect a few days upwards before a final wave down for the 5th

Powell and trade war truce may shorten correction $ERX $TQQQAs described in my previous note on the S&P 500, there have been two major market corrections since the end of the Great Recession. They were periods of high volatility and a lot of repricing of stocks for 140 days or more.
In both cases they started with:
1. A complete reset of the daily RSI ( Relative Strength Index below 20)
2. The S&P 500 holds below the 200 day MA
3. The 50bar EMA passes below the 100bar EMA
They end when:
1. The S&P 500 0.54% holds above the 200 day MA
2. The daily RSI holds above 50
3. The 50bar EMA passes above the 100bar EMA
The daily RSI is currently above the trend-line and above 50. The S&P 500 today will open above the 200 day MA and the 50 day EMA should cross above the 100 day EMA within three weeks assuming this new trend continues through Christmas.
When I recently posted on this topic I said "Consumer confidence is high but the only way for this ship to turn around quick is for the Fed to change strategy, that will not happen."
It now looks like it may happen. Additionally, Trump and Xi struck a 90 day trade war truce.
Tech and energy sectors are the most beat up in recent weeks, all of these developments are bullish for these two sectors. Trade opportunities should present them selves in TQQQ and ERX .

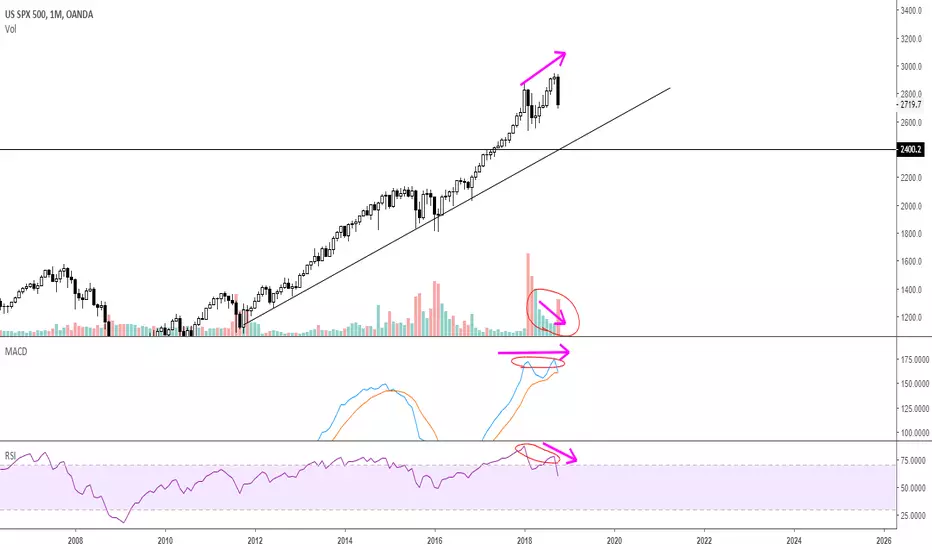
S&P500 Is Going To 2400$!Can You See That Negative Divergence? ( When two or more indicators, indexes, or averages, fail to show confirming trends. A negative Divergence occurs when a price index is making a higher top at the same time a technical indicator is flat or making a lower top. )
TP 1: 2600
TP 2: 2500
TP 3: 2400
Good Luck!

SPX500 wanting to blow this tasty Megaphone Descending broadening wedge formation observed, or what I like to call it as- Muh Tasty Megaphone
Price should blow out of it tomorrow, keep an eye for breakout :)

Short term bounce on SPX500SPX500 traded into the 4 hour bullish orderblock and finding support over there, we can see a nice push up to squeeze bottom shorters out.
Expecting a retrace to .705 fib in the chart

SPX See what I mean about the candlestick action before past declines? Refer to my last SandP 500 chart for what I was saying.
SandP500- strictly technicalOk, try to stay with me here.... If we look at SandP in plain old Elliot wave, I see 2 possibilities.... Either all hell breaks loose and it just drops to the 23-38% fib levels and into a wave 4 correction, OR... it will rally again in the form of an ending diagonal considering we should be on wave 5 of a larger degree wave 3. What I find interesting is that if I slide the fib retrace from the high it just made up to the up to the 1.618 extension (white line, typical for a wave 3), the 23% fib retrace slides up and lines up perfectly with the trend fibonacci from beginning of time through the wave patterns (it should anyway, 1.236 extension). The 3000 level should be of some significance also. If you look at past market declines, you can see some higher time frame candlestick action occurring beforehand. It can break the fork and make some kind of smaller flat pattern also before continuing up. I just feel like Donald Trump has been well aware of the math of the market and does not want to be known as a President who had a market crash, considering his wallet and ego.


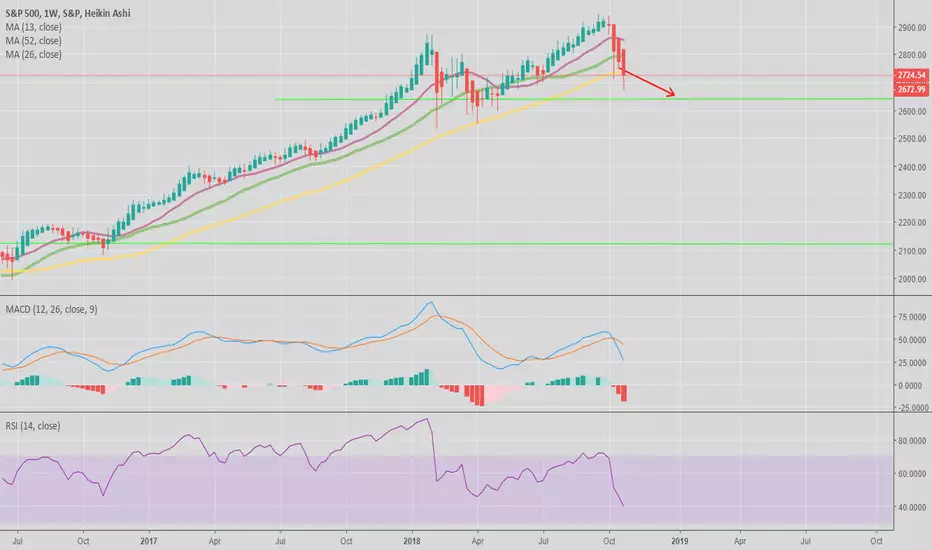
Pretty confident we are entering a bear marketHello all,
I have been saying the US stock market is going to crash for about a year now, and well, it looks like I might be right.
The significance of my moving averages is due to the fact that they represent 1 year, half a year, and a quarter of a year. You'll notice the year held in the last dip, but has not this time. This is a bearish signal. In addition to this, we are entering into muddy trade waters as per Trump and interest rates are high.
I would strongly suggest not being in the SPX or any large US index right now. We might face a serious deleveraging/depression. I am ready to leave the country if need be. Hope we all survive :)
Godspeed.
-YoungShkreli
SPX - S&P 500 - UPDATE shorti am expecting this to go down . there is every chance it could go back up so be carefull
S&P 500 Stock Market Index Daily ChartThe S&P 500 may still to continue it 4th wave correction as showing the chart. It may drop back to 2720 area for consolidation before resuming final
5th wave to achieve a historical all time high to set the stage for major painful crash.


if the opening continues to fall...if the opening continues to fall we could be in for a 20+ point drop into next week? JMHO

SandP500 Daily showing divergenceSPX is getting to a critical spot. That is what I would like to see it do (ending diagonal). But regardless, a lot of divergence coming in as it seems to be in a running flat as I mentioned before. A spike into that zone (27% extension-3000 level) might be a place to try a tight entry on a short.
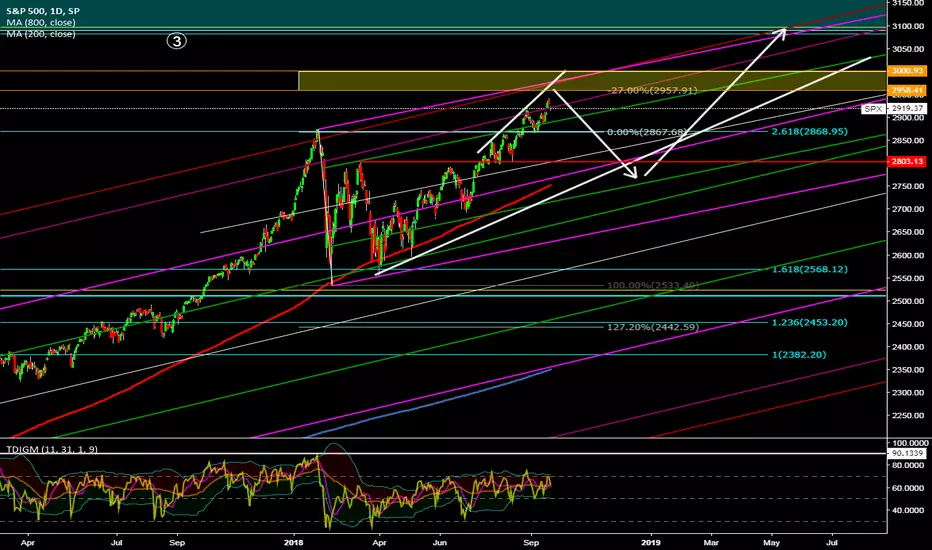
SPXRalph Elliot speaking from beyond the grave.... Typically speaking, wave 4 retraces 23-38%. We are on an extended wave 5 of wave 3. Those 2 rectangles are measurements: 1.618 x wave 1, 2.618 x wave 1. Wave 3 typically terminates around 1.618 wave 1 (watch that 3000 area. It may not even reach it, but if it did and hit the top of the 2.618 box, that's a sell all day. I could go down to the last wave and explain it better but you guys, but you don't pay me enough... Just kidding, I'm lazy. Commodities are down. Look at Silver, Platinum, Natural Gas even. If stock market goes into wave 4 retrace, money will be moved to safer investments perhaps. In fact, I feel that I have pretty much all markets sewn up at this point.

Facebook (FB) - Long/Short - Make or Break FB sitting on the weekly trendline, a nice push up would be a buy signal, would like to see a buy pattern form beforehand.
If further breakdown, look for consolidation and sell.

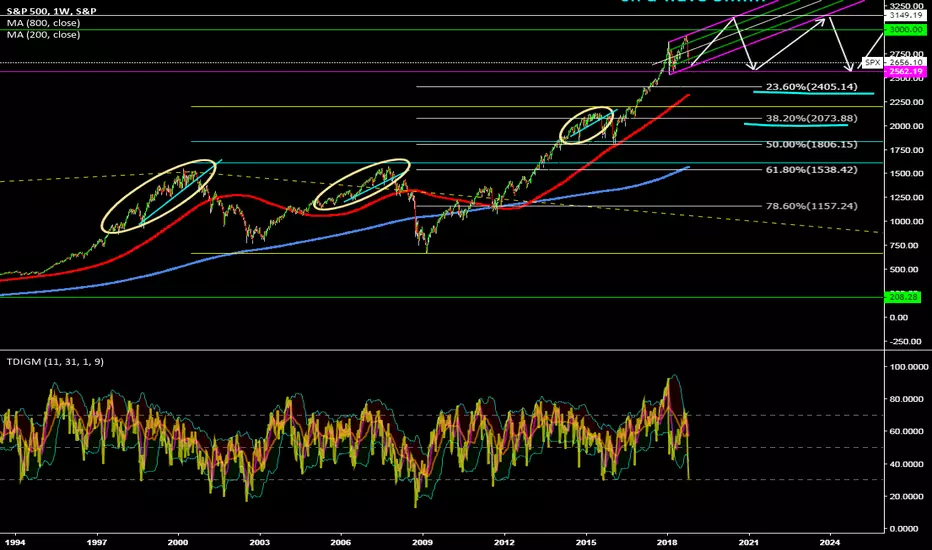
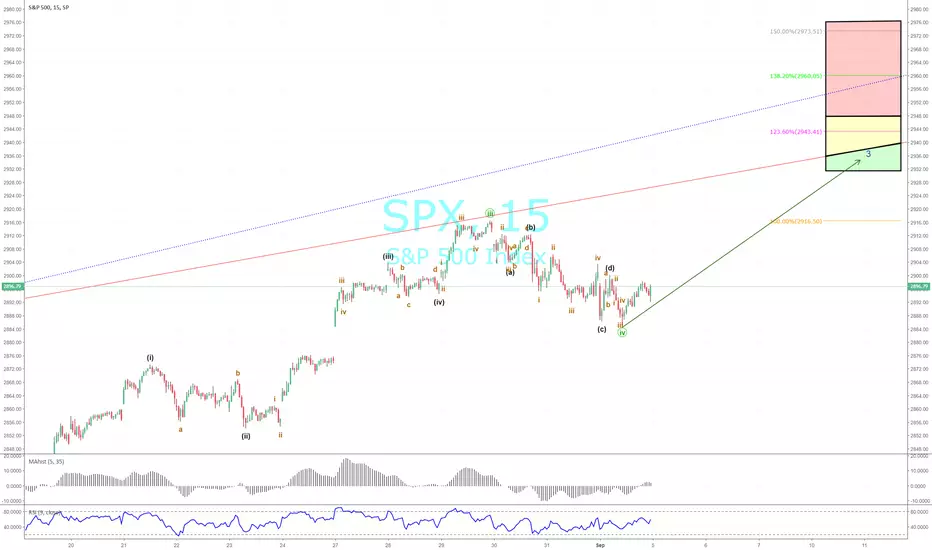
Nailed Last Drop, Here is Next S&P 500 TopI am back with another Elliott Wave Forecast on the S&P 500 Index . After detailed research and analysis, I identified the recent bottom, which occurred today, ahead of time. I have identified the next top. I have identified 3 colored polygons. The green zone will most likely contain the top, but the yellow polygon is also possible. The red zone is unlikely, but anything is possible. I entered long positions today and plan to sell once the green zone is hit.
The key levels of interest are:
3070.31
2976.31
2973.51
2960.05
2947.87
2946.10
2943.41
2934.89
2931.95
2931.43
The tight grouping of levels between 2931.43 and 2947.87 make this the most likely zone. I have also identified a trend line of resistance. This will most likely dictate the top based on timing. The top should occur between 11:15 Eastern time on September 10 and 14:00 on September 10.
The full analysis and complete article will be posted tonight or tomorrow morning on ElliottWaveIdeas.com
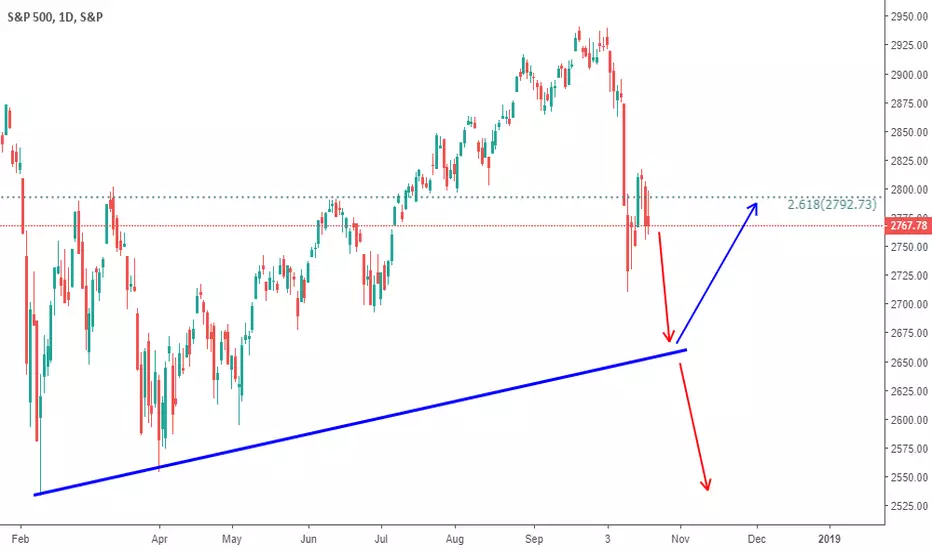
S&P Could Drop Back To 2532S&P 500 could be in a final stage of counter-trend correction
within wave X, which is a link between wave W and Y.
The range was set with the wave W between 2532 on the downside and 2873 on the upside.
The index reached the area of triple resistance where current resistance (yellow), medium term (gray) and range's top (blue) intersect.
Besides that, there is a Pregnant Lady aka Harami candlestick appeared yesterday.
It is a Bearish reversal signal.
But let us watch for the breakdown of immediate support (red) for confirmation.
The Y wave could drop back to the major low established by the wave W at the 2532 level.

S&P 500The S&P is pulling back up, but I still consider it in a "B" wave and I still expect downside to be coming. They may break that top for one more, but they should run it back down. At that point it can make another move up, but I expect more downside before any upside.
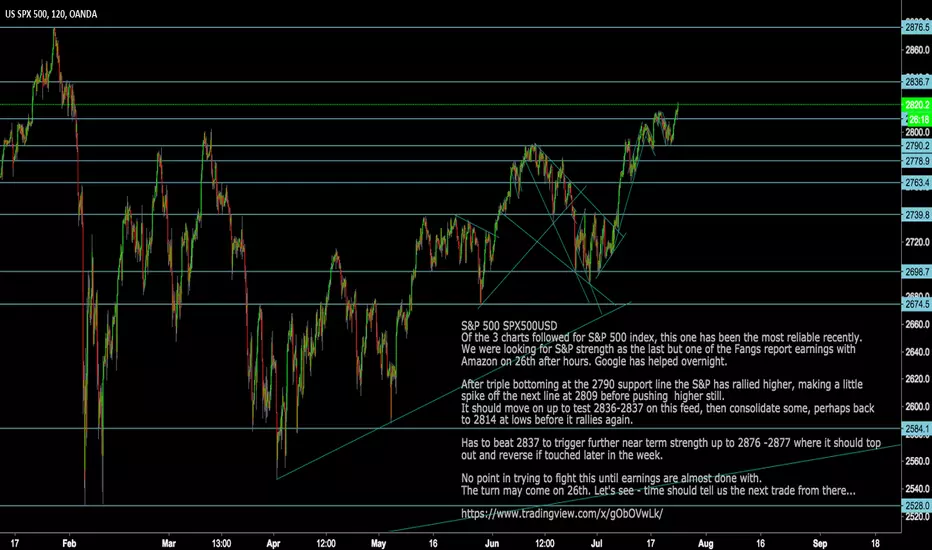
SPX: S&P 500 Next Trade Points from HereS&P 500 SPX500USD
Of the 3 charts followed for S&P 500 index, this one has been the most reliable recently.
We were looking for S&P strength as the last but one of the Fangs report earnings with
Amazon on 26th after hours. Google has helped overnight.
After triple bottoming at the 2790 support line the S&P has rallied higher, making a little
spike off the next line at 2809 before pushing higher still.
It should move on up to test 2836-2837 on this feed, then consolidate some, perhaps back
to 2814 at lows before it rallies again.
Has to beat 2837 to trigger further near term strength up to 2876 -2877 where it should top
out and reverse if touched later in the week.
No point in trying to fight this until earnings are almost done with.
The turn may come on 26th. Let's see - time should tell us the next trade from there...
19th July Update
Am counting on a 4th wave on the back of earnings in near term -
It could use some great results from Microsoft tonight - merely 'good' numbers will be a bit of a let down - on the Dow also and Dax too.
Looking at this index in isolation it still looks like it has more upside left and will eventually break higher above 2814 up to 2838 and then after consolidating some more here, it should push on to 2876 highs again.
On the downside it has to break below 2798 to short back to 2788/7 where it must bounce again if the trend is to remain positive in the nearer term and for a retest of the highs to remain the likeliest outcome from here.
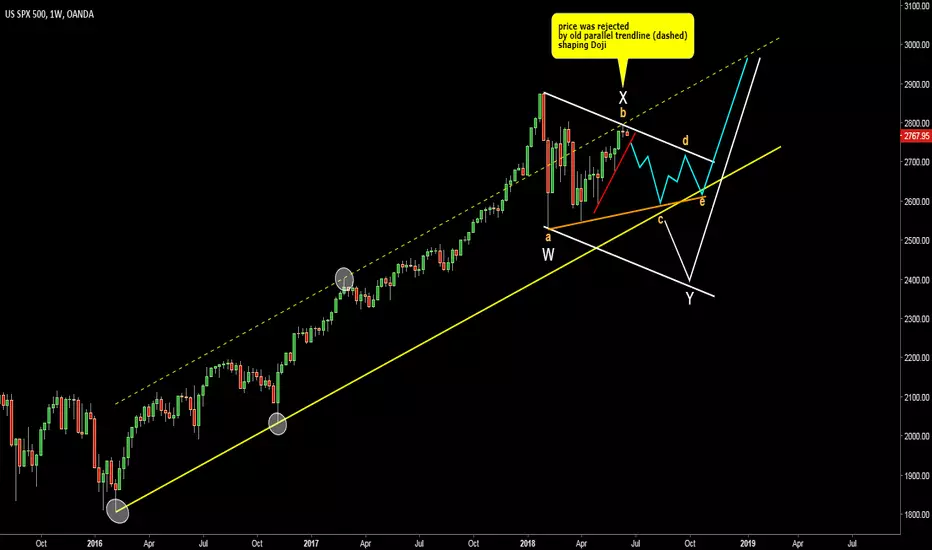
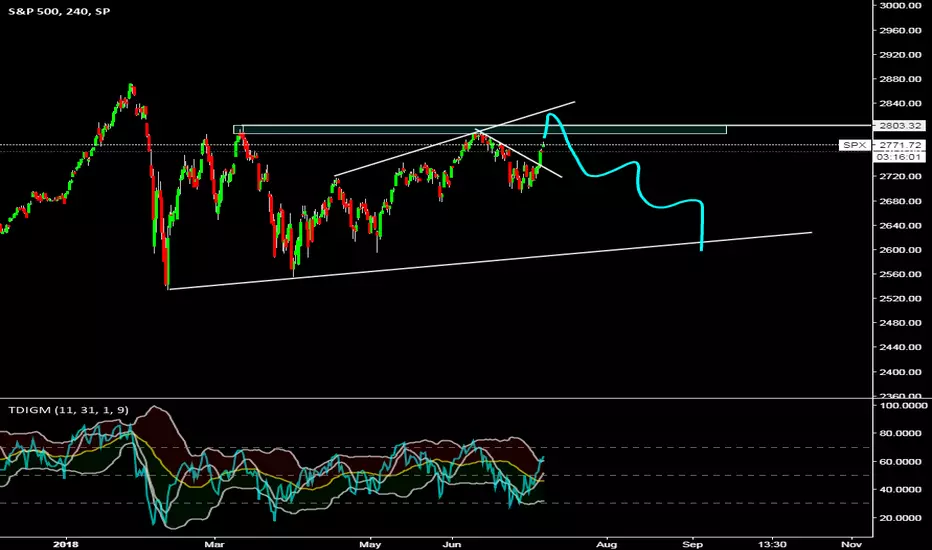
S&P 500. Updated chart. Larger Triangle or Double Three As I promised in my earlier post
here is an update with the two possible scenarios.
First of all I would like to focus your attention on the dashed parallel trendline resistance (yellow).
Price was rejected right at that resistance shaping reversal Doji candle on the Weekly chart.
If this upmove has been finished (breakdown below red support is needed to confirm it) then I can see
two options of further price development.
1) Larger Triangle.
It still could be a Triangle but of the larger size (orange marks and blue zigzag).
It perfectly fits with the trendline support (yellow).
2) WXY Double Three.
Another option is more painful as price could drop to 2400 as marked with the white zigzag.
It implies the breakdown of the yellow support and this should relax the market deeply before the autumn comes or even later.
I heard once that 2018 could be a NON-performing year for US stocks and this scenarios confirm it. Let's live and see