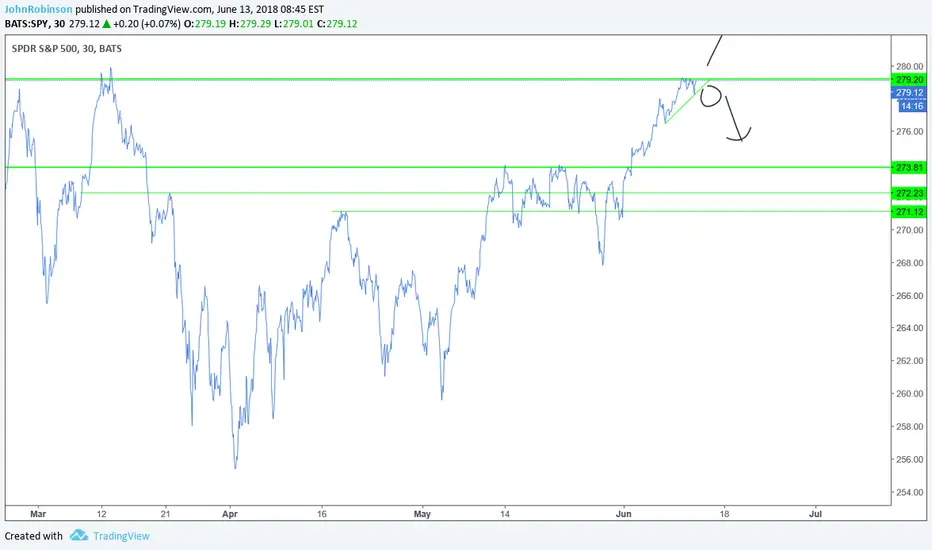
SPY Pivot IdeaI believe if it breaks the triangle we will continue down to previous supports, otherwise we will see January levels coming.
Sandp500
XPloRR S&P500 Stock Market Crash Alert GeneratorXPloRR S&P500 Stock Market Crash Alert Generator
Long-Term Trailing-Stop study detecting S&P500 Stock Market Crashes/Corrections and showing Volatility as warning signal for upcoming crashes
Detecting or avoiding stock market crashes seems to be the 'Holy Grail' of strategies/studies.
This study detects all major S&P500 stock market crashes and corrections since 1980 depending on the Trailing Stop Smoothness parameter. The 5 crashes/corrections of 1987, 1990, 2001, 2008 and 2010 were successfully detected with the default parameters.
With the default parameters this study generates 5954% profit, with 6 closed trades, 100% profitable, while the Buy&Hold strategy only generates 2427% profit, so this strategy beats the Buy&Hold strategy by 2.45 times!
The script shows a lot of graphical information:
the green area shows a trading period (between buy and sell)
the close value is shown in light-green. When the close value is temporarily lower than the buy value, the close value is shown in light-red. This way it is possible to evaluate the virtual losses during the trade.
the trailing stop value is shown in dark-green.
the EMA and SMA values for both buy and sell signals are shown as colored curves
the Volatility is show below in green and red. The alert threshold (red) is default set to 200 (see Volatility Warning Threshold parameter below)
Trailing Stop Smoothness value:
Adjust the Trailing Stop Smoothness parameter to hide/show smaller corrections/crashes:
96: 6 trades, 100% profit, 5954% profit, detected crashes: 1987, 1990, 2001, 2008, 2010
90: 8 trades, 100% profit, 5347% profit, detected crashes: 1984, 1987, 1990, 2001, 2008, 2010, 2011
74: 9 trades, 100% profit, 4964% profit, detected crashes: 1984, 1987, 1990, 2001, 2008, 2010, 2011, 2015
41: 10 trades, 100% profit, 4886% profit, detected crashes: 1984, 1987, 1990, 1998, 2001, 2008, 2010, 2011, 2015
How to use this alert generator?
Add to your alerts to get an automatic warning (via e-mail) of an upcoming stock market crash
Optimize parameters using the strategy settings icon, you can increase/decrease the parameters
More trades don't necessarily generate more overall profit. It is important to detect only the major crashes and avoid closing trades on the smaller corrections. Bearing the smaller corrections generates a higher profit.
Watch out for the volatility alerts generated at the bottom (red). Threshold can by changed by the Volatility Warning Threshold parameter (default 2% ATR). In almost all crashes/corrections there is an alert ahead of the crash.
Although the signal doesn't predict the exact timing of the crash/correction, it is a clear warning signal that bearish times are ahead!
The current correction in march 2018 is not yet a major crash but there was already a red volatility warning alert. If the volatility alert repeats the next weeks/months, chances are higher that a bigger crash or correction is near.
As can be seen in the graphic, the deeper the crash is, the higher and wider the red volatility signal goes. So keep an eye on the red flag!
Information about the parameters: see below
If you are interested in buying this S&P500 Stock Market Crash Alert Generator, please drop me a message to receive the code (Price 99$).

SPX Outlook Monthly, Weekly and Daily trends are up.
4H: Price engulfed a minor supply zone (marked at chart). it's a signal to buy but not very strong.
Down move is still possible. So I will buy with LOW risk.

Here Is The SECRET PATH - WHY BITCOIN will MOON very soon!! Dear Friends! :)
Who would have thought, that D4rkEnergY could get sick? I flew back to Seoul 4 days ago. Got 5 hours of sleep on the plane. Installed in my apartment. When I arrived at our office I was quickly briefed that we had a big event for clients, sponsors, ICO's in a big venue. I was told to prepare a speech and make a Live TA-show on Bitcoin for +500 people - aaand the event was about to start - I had 2 hours!
After the event we went out and had some dinner with our customers - Korean BBQ of course. For those of you who don't know how to do business in Korea, I'll reveal it here:
1. Eat
2. Drink Soju mixed with beer!
3. Drink more Soju
4. Talk, negotiate
Repeat...
I'm from Denmark - and in Scandinavia we know how to drink... But D4rkEnergY had to surrender in the end... But now I'm finally back - and this time I'm going to tell you WHY Bitcoin soon will moon!
As you can see I have made a comparison between S.P.Y: S&P 500 and Bitcoin. The S.P.Y aims to track the Standard & Poor's 500 Index, which is comprised of 500 large- and mid-cap U.S. stocks
Here is what I have realized:
- Bitcoin is following S.P.Y
- But with a delay - it seems like S.P.Y is in average 2-3 weeks ahead of Bitcoin
As you can see we have very similar patterns:
- Bull run
- Double bottoms
- Double Top
- Bear flag etc.
Now what?
S.P.Y started its new uptrend May 2nd. 12 days ago. As you can see on the RSI it started after a double bottom on RSI Level 43, where we also now on the BTC-chart has made our first bottom.
We are at 8,400 USD now (while I'm writing this post we are having a sick spike to 8,8k USD). But if we will follow S.P.Y we can expect to go down again, and make a double bottom before we will moon!
D4 Loves You <3
Nice to be back again - Please leave a LIKE and follow for more. Thanks in advance, my friends :)

What Is Next to Invest in!? Here's a Bleak Map =$A New Cold War, or a War-Don't overlook
The new generation will get consumed with hatred against each other, as Russia, China, and the Middle East Align Against the US and Most of Europe, There will be dark clouds, Ideas of Nuclear War, and Proxy Plays, think more 'Corrupt Syria being helped by Russia" So the hope walks with the younger generation, paving the way of more boundaryless freedoms, freespeech, free movement, free ideas,
But yes,
Stock market is crumbly, bitcoin is slumping
Borders are becoming more restrictive
Food Surpluses will exist in countries that don't have easy ways of selling,
Government will require more of you
Military spending will go up, Weapon Systems-defensive and offensive
Healthcare spending will go up long term
Large contracts will be given to Base Development, Contractors,
Normally the greatest advancements happen on the fringes, www.iqt.org
Biological War Prevention- for those that can afford, historically this is a underprepared measure
So gold is not always a good bet, bet on the actors when investing and the aftermath property when securing long gains.
But, if this does not play out, and continues as is, crumbly posturing,
VIX will make you money if you learn how to trade Volatility.
Then push that into the 'sign of the times'

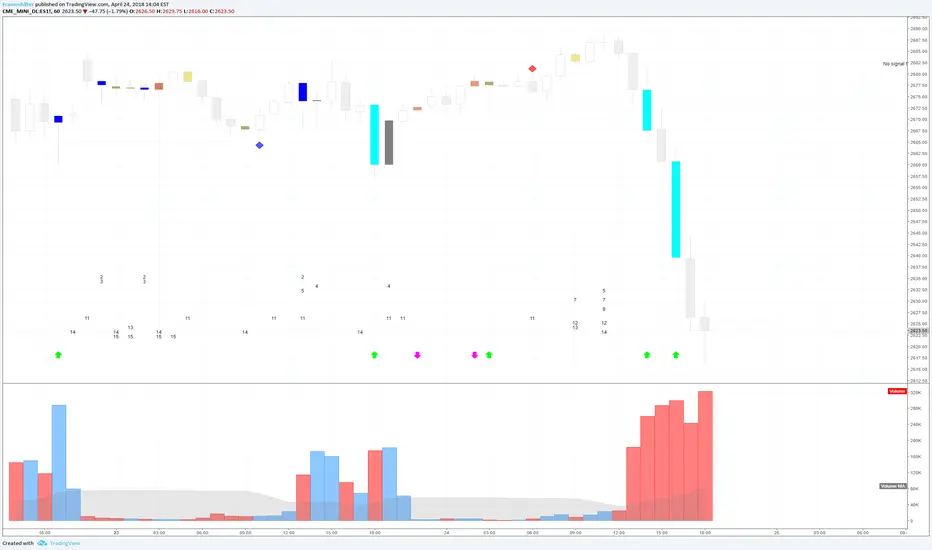
Long ES 2625 Target 2631 (Hourly)A long signal appeared with zero warnings. Chart is a bit messy as I port over my systems to TV.
S&P 500 IDEAJust a test idea with different chart layouts from other ideas.
> Support lays around the 2640 / 2625 region
> If a trade triggers initial targets 2700/2710 level

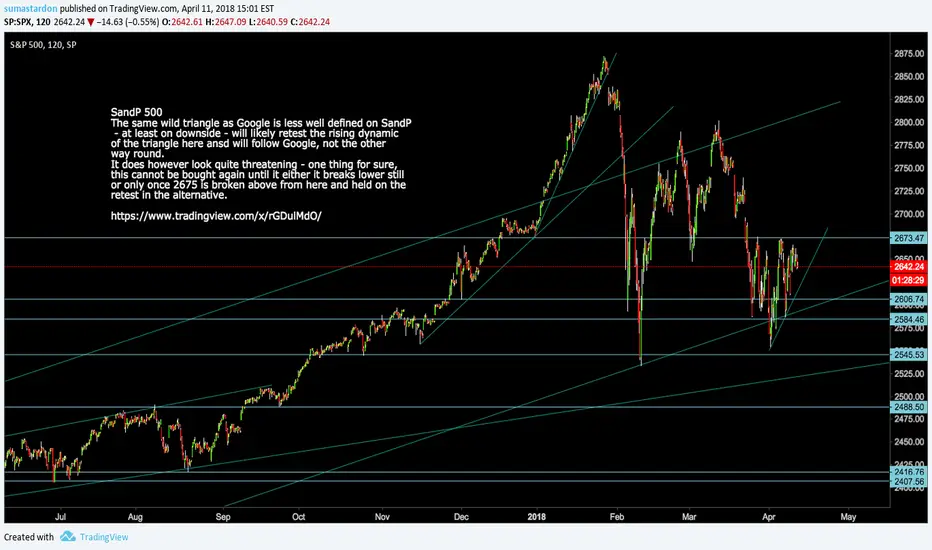
S&P 500 Index: SPX Same Wild Triangle as GoogleSandP 500 Index SPX
The same wild triangle as Google is less well defined on SandP
- at least on downside - will likely retest the rising dynamic
of the triangle here ansd will follow Google, not the other
way round.
It does however look quite threatening - one thing for sure,
this cannot be bought again until it either it breaks lower still
or only once 2675 is broken above from here and held on the
retest in the alternative.

XPloRR S&P500 Stock Market Crash Detection StrategyXPloRR S&P500 Stock Market Crash Detection Strategy
Long-Term Trailing-Stop strategy detecting S&P500 Stock Market Crashes/Corrections and showing Volatility as warning signal for upcoming crashes
Detecting or avoiding stock market crashes seems to be the 'Holy Grail' of strategies.
Since none of the strategies that I tested can beat the long term Buy&Hold strategy, the purpose was to detect a stock market crash on the S&P500 and step out in time to minimize losses and beat the Buy&Hold strategy.
So beat Buy&Hold strategy with less then 10 trades. 100% capitalize sold trade into new trade.
With the default parameters the strategy generates 5954% profit, with 6 closed trades, 100% profitable, while the Buy&Hold strategy only generates 2427% profit, so this strategy beats the Buy&Hold strategy by 2.45 times!
Also the strategy detects all major S&P500 stock market crashes and corrections since 1980 depending on the Trailing Stop Smoothness parameter, and steps out in time to cut losses and steps in again after the bottom has been reached. The 5 crashes/corrections of 1987, 1990, 2001, 2008 and 2010 were successfully detected with the default parameters.
The script shows a lot of graphical information:
the close value is shown in light-green. When the close value is temporarily lower than the buy value, the close value is shown in light-red. This way it is possible to evaluate the virtual losses during the trade.
the trailing stop value is shown in dark-green. When the sell value is lower than the buy value, the last color of the trade will be red (best viewed when zoomed)
the EMA and SMA values for both buy and sell signals are shown as colored curves
the buy and sell(close) signals are labeled in blue
the Volatility is show below in green and red. The alert treshold (red) is default set to 200 (see Volatility Warning Treshold parameter below)
Trailing Stop Smoothness value:
Adjust the Trailing Stop Smoothness parameter to hide/show smaller corrections/crashes:
96: 6 trades, 100% profit, 5954% profit, detected crashes: 1987, 1990, 2001, 2008, 2010
90: 8 trades, 100% profit, 5347% profit, detected crashes: 1984, 1987, 1990, 2001, 2008, 2010, 2011
74: 9 trades, 100% profit, 4964% profit, detected crashes: 1984, 1987, 1990, 2001, 2008, 2010, 2011, 2015
41: 10 trades, 100% profit, 4886% profit, detected crashes: 1984, 1987, 1990, 1998, 2001, 2008, 2010, 2011, 2015
How to use this Strategy ?
Look in the strategy tester overview to optimize the values Percent Profitable and Net Profit (using the strategy settings icon, you can increase/decrease the parameters), then keep using these parameters for future buy/sell signals on the S&P500.
More trades don't necessarily generate more overall profit. It is important to detect only the major crashes and avoid closing trades on the smaller corrections. Bearing the smaller corrections generates a higher profit.
Watch out for the volatility alerts generated at the bottom (red). Threshold can by changed by the Volatility Warning Threshold parameter (default 200 = 2% ATR). In almost all crashes/corrections there is an alert ahead of the crash.
Although the signal doesn't predict the exact timing of the crash/correction, it is a clear warning signal that bearish times are ahead!
The current correction in march 2018 is not yet a major crash but there was already a red volatility warning alert. If the volatility alert repeats the next weeks/months, chances are higher that a bigger crash or correction is near.
As can be seen in the graphic, the deeper the crash is, the higher and wider the red volatility signal goes. So keep an eye on the red flag!
To use this strategy for future trades, set the end date past today and set the Sell On End Date value to false
Information about the parameters: see below

Buy the dip in the spyLast week there was again some market panic which caused a selloff in stocks. There are a lot of broken charts right now on a lot of different stocks. But fundamentally market is still looking strong. So i'm going to buy the dip. In a few months there is a high chance we are back higher. Time to deploy cash on monday.

S&P bear flag - Beginning of something bigger? The technicals are quite depressing for the SPX. Bear flag is broken. The previous correction easily could be just a dead cat bounce and now go to the deep. Some other assets are also support a bigger downtrend (at least for few months). We will see. What do you think?

S&P500 Rising Wedge 17/3/18 (3/17/18)Hi Guys im back,
I stumbled on to this in the three month chart.
A rising Wedge!
Resistance line is Confirmed . Support likely to be confirmed.
once that red candle meets the support line pattern confirmed

S&P 500 Index: SPX - The Trump Roller-Coaster Ride in 2dS&P 500 Index SPX The Trump Rollercoaster Ride in 2d -
The post-Trump rally in the S&P has been a text-book affair,
with 4 clear phases and speeds, like a car going through the
gears. First gear is the lower parallel with a direct hit on the
day after the election in November 2016. It rallies and then
drops in gear/speed, the technical equivalent of double-de-
clutching, in a rising continuation pattern, which goes on all
through the following summer. Then in mid-November, a year
after the paradigm shift, it picks up speed and slams into 3rd.
And then right on the turn of the new year 2018 it takes off
vertically, a final straight-line ascent with another perfect
speed/trend/dynamic support line running right under the
lows. It is about as technically perfect as you can find
(outside of Bitcoin, of course).
The great 37% Trump rally then ends with a complete
break/fracture as the SPY gaps down from the support line
(exit all longs!) and then dances in thin air (think:Wile.E
Coyote, green arrow) for a little while and then collapses and
creates another gap - thereby creating an island reversal at
the top - one of the most rare and powerful and reliable
reversal signals of all in a major market index. (Bulkowski
does not differentiate much between indices and individual
stocks in this respect which is a shame as both behave quite
differently. Island reversals are rare at both tops and bottoms
in major market indices, usually). Whatever, the result was
spectacular.
A week of mayhem took the index crashing back to the lowest
2 parallels' intersection /gears 1 and 2 again - before
rebounding. It finished last week right under an important near term resistance line at 2690 and which extends to 2701 on this chart - this index is still in danger of further correction whilst below here. I has to move above 2702 and hold up there through the opening 30 minutes - if it can manage this the bulls are likley to push it on tup to 2714 to begin with and then after a little while consolidating on up to 2748. Two near term potential long trade set-ups.
Returning to the downside, the S&P is still vulnerable to
further correction whilst unable to break and hold above
2701-4 on SPY - even if it can manage to rally and hold above
2704 it's unlikely to get much higher than the 2749-2755 range
before falling away again so will not be pushing it here even if
we see upside trades trigger. It really looks like it needs to
come back and retest the lower parallels again in the
2555-2550 range before it can really hope to stabilise. At all
costs the lows at 2539-2530 must hold up this week on any
retest. And if we do see this retest unfold at any point will be
looking to buy here so long as it starts to hold and fight in this
range for 5 minutes or more but still ready to reverse this
tentative/speculative long shot if triggered by the price
action needed. Because if not and it breaks lower than 2530 it
will open a good shorting opportunity back to 2488 at least
and maybe 2416-2400 range at lowest before the next great
rally commences.
An interesting week lies ahead for the S&P and by extension
the savings/retirement accounts of pretty much everyone in
the world. Really want to be wrong on this one. But it just
doesn't look safe whilst stuck under 2700.

S&P 500. Possible map for current correctionIt looks like first 5 waves down of wave A are over in the upcoming zigzag structure.
Next we could see 3 waves up in the countertrend correction, wave B.
It could reach between 50% and 78.6% of wave A.
Then there is a second leg of 5 waves down of wave C.
Let us see how it goes.

google short playChannel Up has broken through the support line at 21-Feb-16:30. Possible bearish price movement forecast for the next 8 hours towards 1102.3175.
Supported by RSI above 60


SPX500: Another drop is ahead.I called for the temporary strength in wave (B) in my earlier post (see related idea).
It looks like we are completing it and another drop down is just ahead.
Signs of wave B soonest finish are: wave C in wave (B) already reached the 1.618 of wave A.
Wave (B) has almost reached the 61.8% of wave (A).
The second drop could be even faster as it will be wave (C).
The minimum target is set around 2470 where wave (C) = wave (A)

Anything to add?Not much to say, just sitting back and admiring the rally.
Have a great weekend, let's see what next week offers!

S&P 500. Big map with current correction.Earlier I posted a map with hourly chart with microview.
This is to give a bird's eye view.
Wave A of 4 could have been finished already.
Now wave B to the upside before another drop down, which should break below the trendline support.
50-61.8% retracement area is the final target for this correction I guess.

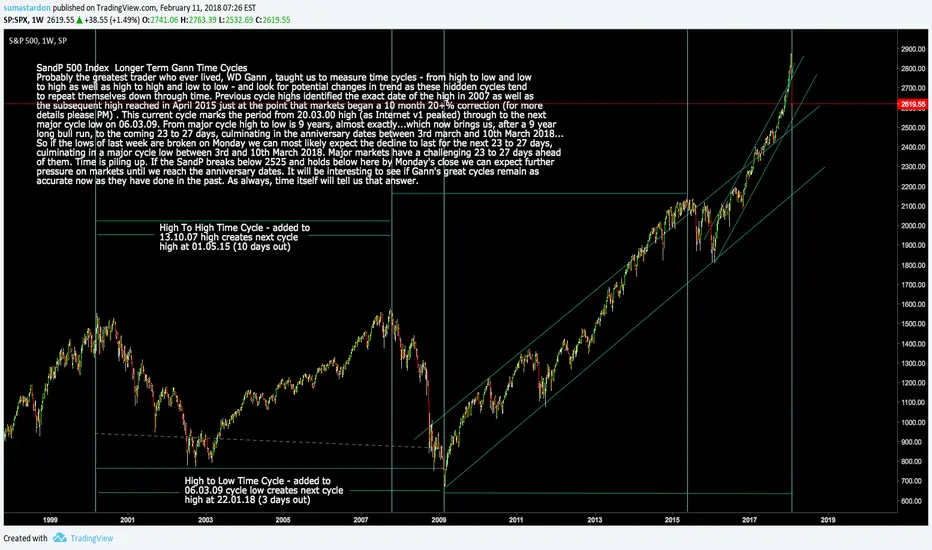
S&P 500 Index: SPX Longer Term Gann Cycles - Cycle High and Low SandP 500 Index Longer Term Gann Time Cycles
Probably the greatest trader who ever lived, WD Gann , taught us to measure time cycles - from high to low and low
to high as well as high to high and low to low - and look for potential changes in trend as these hiddden cycles tend
to repeat themselves down through time. Previous cycle highs identified the exact date of the high in 2007 as well as
the subsequent high reached in April 2015 just at the point that markets began a 10 month 20+% correction (for more
details please PM) . This current cycle marks the period from 20.03.00 high (as Internet v1 peaked) through to the next
major cycle low on 06.03.09. From major cycle high to low is 9 years, almost exactly...which now brings us, after a 9 year
long bull run, to the coming 23 to 27 days, culminating in the anniversary dates between 3rd march and 10th March 2018...
So if the lows of last week are broken on Monday we can most likely expect the decline to last for the next 23 to 27 days,
culminating in a major cycle low between 3rd and 10th March 2018. Major markets have a challenging 23 to 27 days ahead
of them. Time is piling up. If the SandP breaks below 2525 and holds below here by Monday's close we can expect further pressure on markets until we reach the anniversary dates. It will be interesting to see if Gann's great cycles remain as accurate now as they have done
in the past. As always, time itself will tell us that answer. In fact Monday will.
S&P 500 Index SPX Next Buy and Sell Points TodayS&P 500 Index SPX Next Buy and Sell Points Today
A poor call on this index yesterday led to the loss of some 12 -15 points as the buy point at 2627 was broken and the stop at
2614 triggered. It wiped out the 6 point win earlier but at least the 60 point win on the short on Moday and the next 60
points or so from the long on Tuesday means the point tally for the week is still positive, if a little depleted.
Yesterday's price action has driven the S&P to a new closing low, taking it back to fill the little gap that shows on this
chart at 2584. A 10% move from the top = 2585, the low yesterday was 2580. So long as this low holds out today on any
retest this corrrection remains a standard deviation - but the low at 2580 must stick now for the medium term trend to stay
positive from here - any fall below 2580 by more than 4 points will tip this index back into bear territory and force it lower
to 2543 (first short) and then if this level breaks to 2488 (second short).
On the upside, whilst stuck within the range and below 2619 it's not giving a strong enough signal to trigger a trade...it has
to break above here and hold there to trigger a rally to 2668 which should be worth following with stops just under 2600.
Alternatively can be bought at 2607 current levels with stops below 2600 and added to once 2619 is broken above.
This is higher risk but also higher reward. Others will prefer to wait for next signal to trigger before entering positions.

S&P 500 Index Buy Set Up off Swing LowsS&P 500 Potential Buy Set-Ups
Clear continuation pattern as it rinses out every stale bull who
jumped in at the first big impulse wave upwards and on the
wrong side of this now...should make a sweet double bottom
or close to - the first long is a speccy buy with stop either
under today'slow at 2615 or at lowest under that last low to
left of chart at 2590 - and it's another buy/add on breaking of
the upper parallel. So long as this holds at the lows today it
will rally back to the highs and beyond - a 10% rise...this would
just be the start and we can potentially get in close to the
swing low of a major and very rarely occurring dip - last one
was 2 years ago precisely.
