SandP 500 E-Mini Futures 60 CME Updated 11/6/2017Price has come up and passed through the middle median line and is using it as support multiple times. Look to see if price will hold as support, break through 2585, and go to the upper median line. We are starting to coil up into energy, so there should be a move soon.
Sandp500

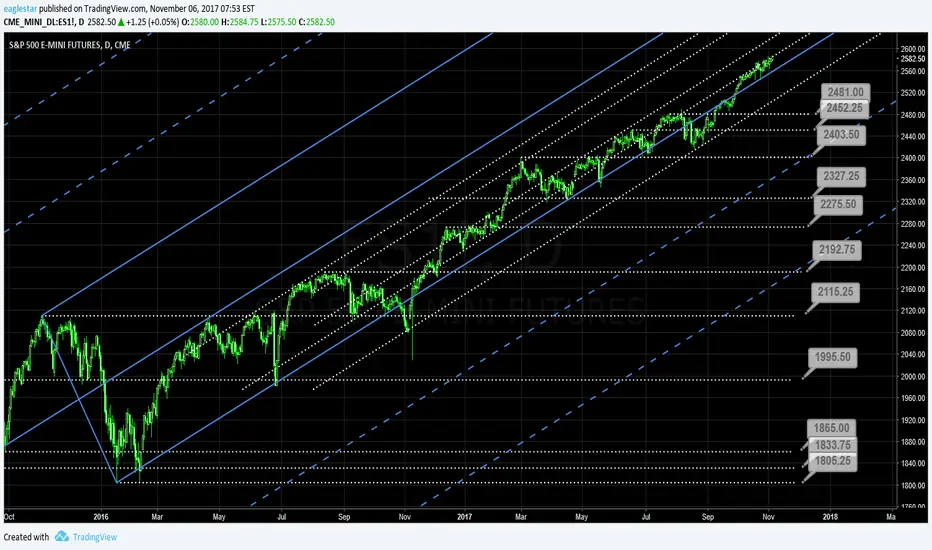
SandP 500 E-Mini Futures D CME Updated 11/6/2017Price has bounced twice from the median line and is still hitting the sliding parallel resistance line. Look to see if price can break through, or if we will break down from here.
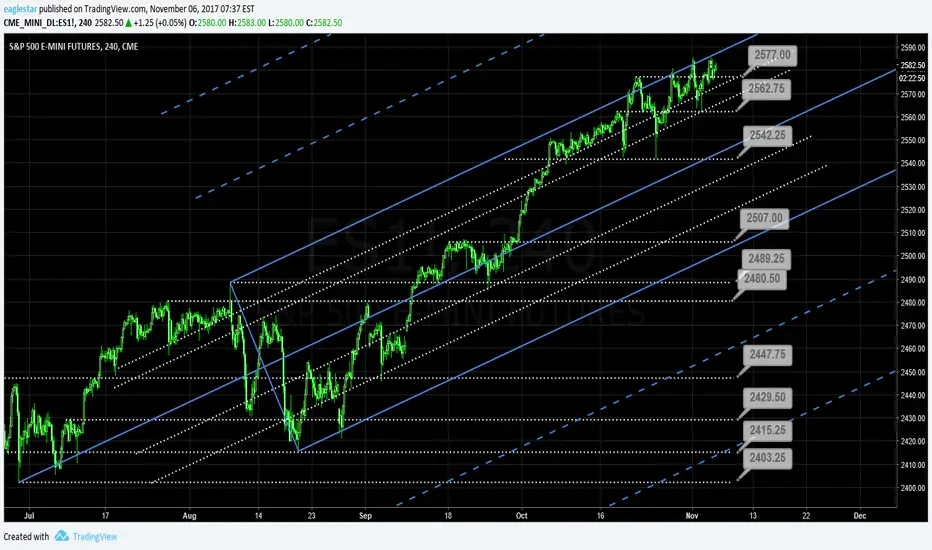
SandP 500 E-Mini Futures 240 CME Updated 11/6/2017
Price has continued past 2577. Look for price to try again to test the upper median line. We are having some trouble getting past the upper blue median line as resistance, so price may pull back soon if we can't break it.
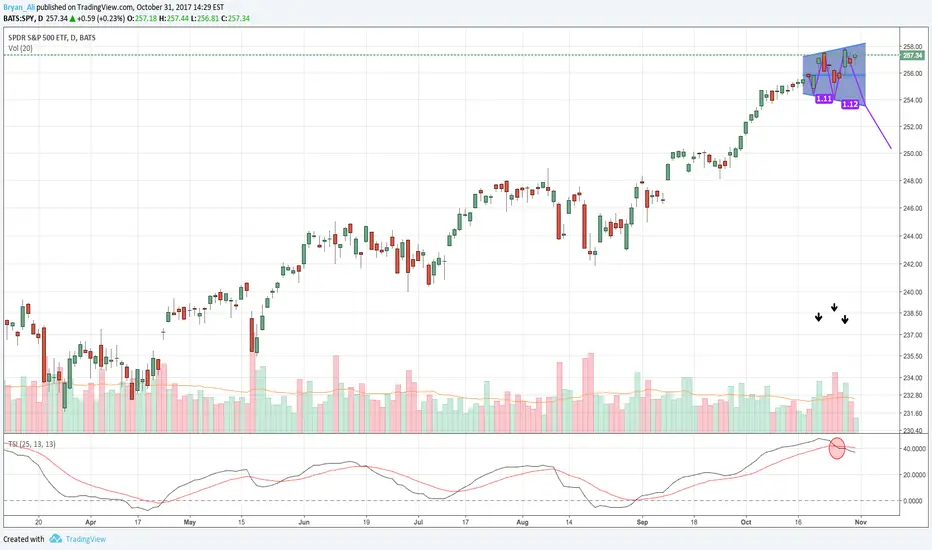
Megaphone Top On S&P 500This is the daily chart of SPY that is displaying, in my opinion, a megaphone pattern that will likely resolve to the downside. As evidence of this being a megaphone pattern is the disjointed trend lines as well as the relatively large volumes that correspond to the "higher highs" and "lower lows." My reasoning for expecting this to be a reversal pattern stems from seeing bearish divergence in a number of indicators- the daily chart displays a bearish cross in the True Strength Indicator and the picture that I've included also shows a bearish trend in the TSI.
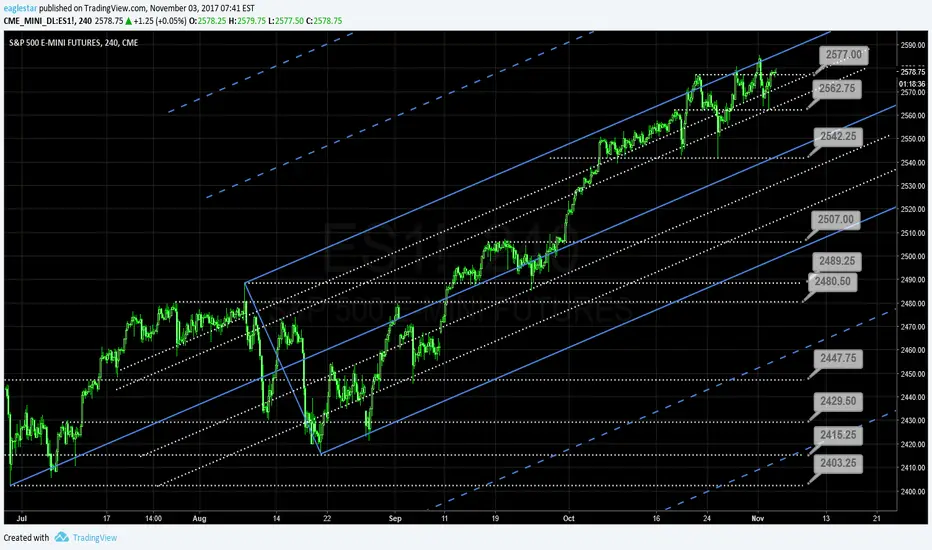
SandP 500 E-Mini Futures 240 CME Updated 11/3/2017 Price has run up a bit higher after hitting the 2562 support level here. We are currently near resistance, so price needs to break higher and retest 2577 possibly as support to be confident that we can move higher.
SandP 500 E-Mini Futures D CME Updated 11/3/2017Price is continuing to hit resistance near the sliding parallel here. Look to see if price can break higher above and continue its momentum to the upside.

SandP 500 E-Mini Futures 60 CME Updated 11/3/2017 Price has hit the back parralel in the action reaction set and is looking like it may point down. Look to see if the 2577 area hold as resistance yet again.

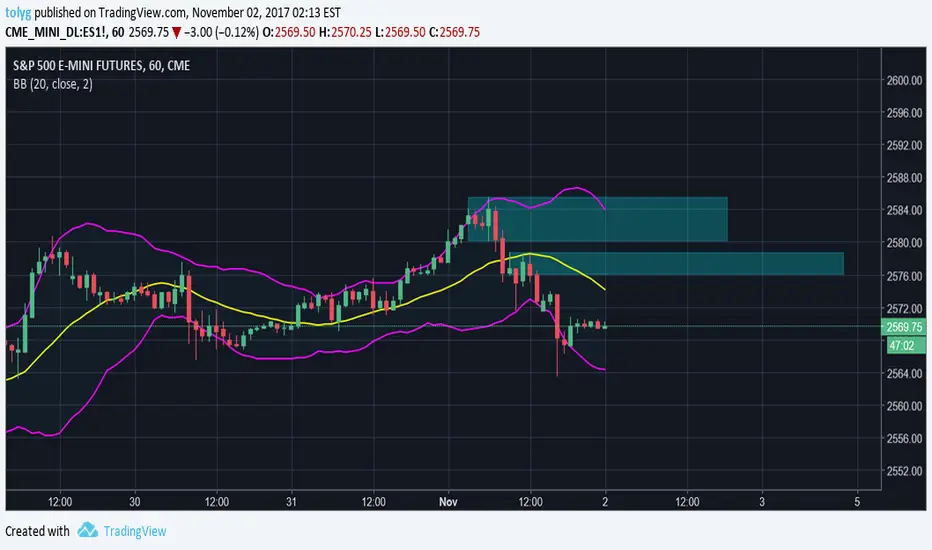
SandP 500 E-Mini Futures 60 CME Updated 11/2/2017Price has come down and tested 2562. Price is starting to show consolidation. I have drawn in a new potential centerline and reaction line if price tries to go higher. Look for 2577 as resistance.

SandP 500 E-Mini Futures D CME Updated 11/2/2017Price is continuing to hit resistance multiple times here on the sliding parallel. We need to break this hard to the upside and continue higher, or els price will come again down to test the blue median line.

SandP 500 E-Mini Futures D CME Updated 11/1/2017Price continues to ride along the sliding parallel without breaking higher. See if price can break noticeably higher and retest as support to continue upwards.

SandP 500 E-Mini Futures 60 CME Updated 11/1/2017 Price has broken 2577 and is headed to new highs. Look to see if price comes back down to retest 2577 or the sliding parallel to continue higher.

SandP 500 E-Mini Futures 240 CME Updated 11/1/2017Price held at support on the sliding parallel and brok higher pas 2577. Look to see if price will come down and retest and hold as suport before going higher to try to test the upper median line again.

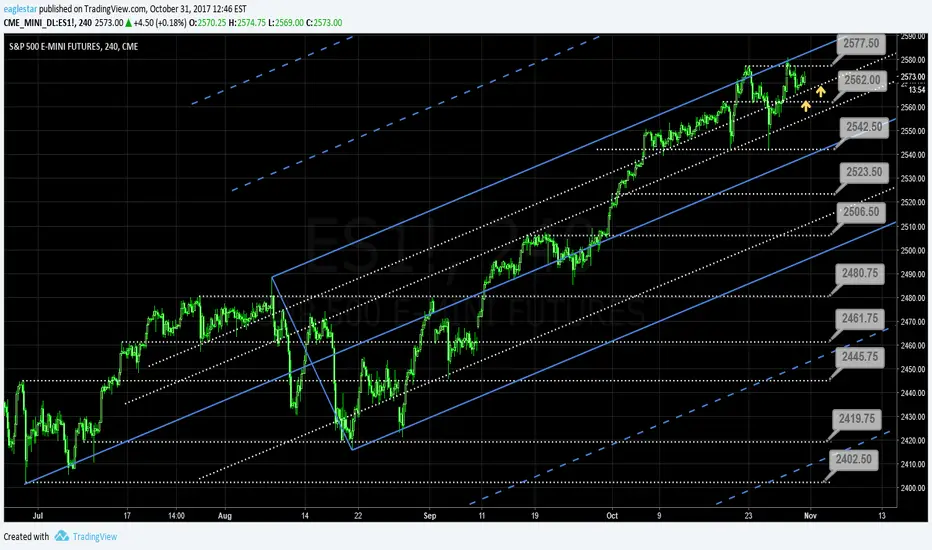
SandP 500 E-Mini Futures 240 CME Updated 10/31/2017Price has hit the sliding parallel and is moving up nicely to try to touch 2577 again. Look to see if price will break that level and retest as support to possible break out of the upper blue median line that is currently resistance. Notice how price bounced on the line that I had marked yesterday, so this was expected support.
SandP 500 E-Mini Futures 240 CME Updated 10/30/2017Price has continued on bouncing from 2542 and has hit the upper median line again near 2577. Look to see if price will break to the upside and retest the blue line as support. Price is currently near resistance so see what it will do. We may also come down to test 2562 before as support.

SandP 500 E-Mini Futures 60 CME Updated 10/30/2017 I have drawn in the action reaction set to the upside. Price is contining to try to press igher than 2577. I have drawn in also the downsloping action reaction set to see if we get some movement on the upper line as resistance.

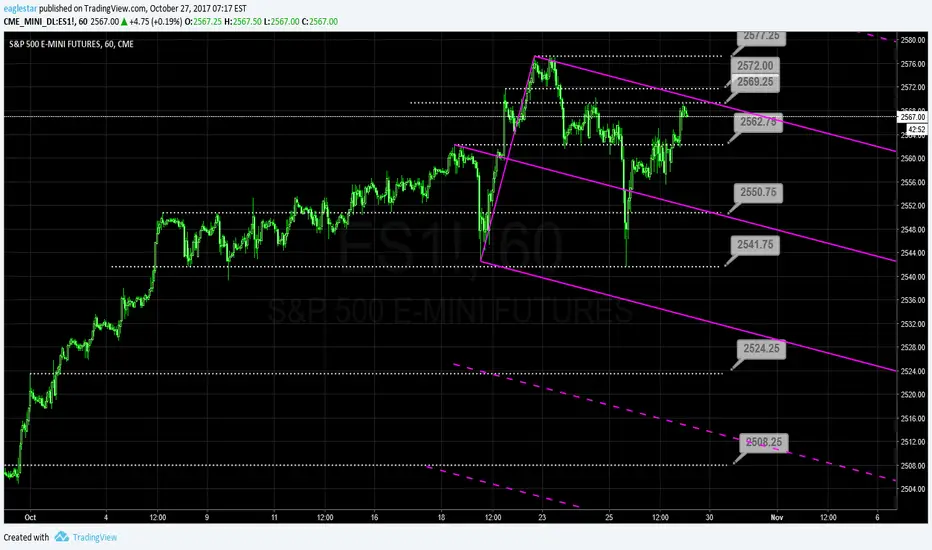
SandP 500 E-Mini Futures 60 CME Updated 10/27/2017 Price has held at 2541, and is now hitting resistance near 2569. Look to see if price comes back down from here. It looks like we are consolidating on this timeframe.
SandP 500 E-Mini Futures D CME Updated 10/27/2017 Price has dropped to the lower median line and touched and held as support again. Look to see if price moves higher from here. We are a bit over extended, so price needs to make new highs.

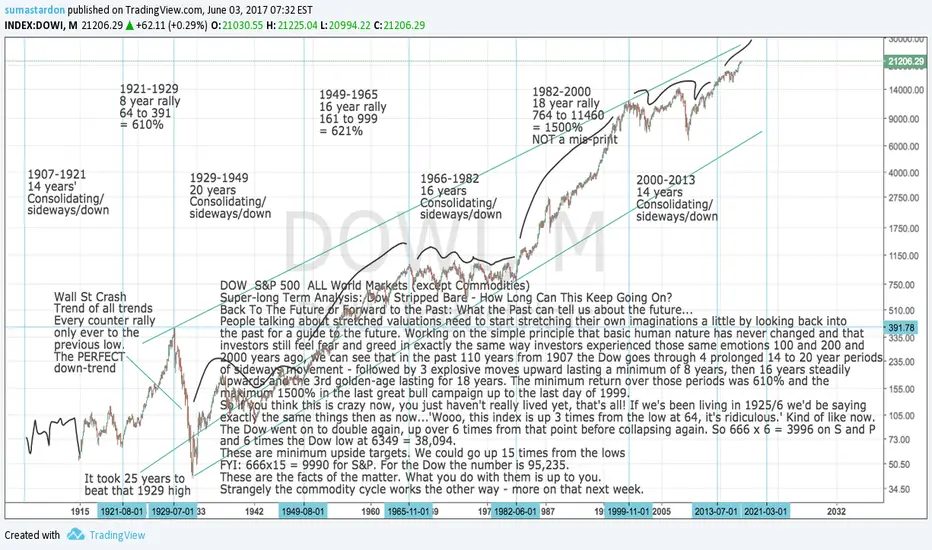
DOW and S&P 500: DOWI SPX500 Super-Long-Term AnalysisDow and S&P 500 Super-long-term: How much longer longer, how much farther? Let the past be your guide. Apart from your dog it's the best friend you've got. The trick is to realise it. Chart is a bit of a mess so will upload a second without the BS
SandP 500 E-Mini Futures 240 CME Updated 10/26/2017 Price dropped and help support near 2541. We are retesting the back side of the sliding parallel, so see if price can rise above it. If not, we should see 2541 again, and then possible the middle median line retest

SandP 500 E-Mini Futures D CME Updated 10/26/2017Price has come down to touch the lower blue median line. Look for price to hold here as support, but if it falls through look for the sliding parallel and 2481 to be the next support level.

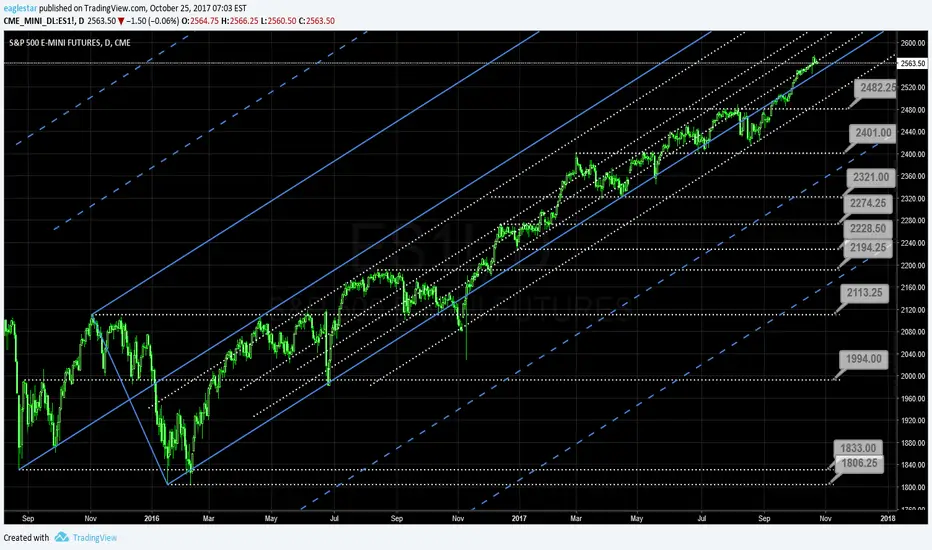
SandP 500 E-Mini Futures D CME Updated 10/25/2017Price dropped from resistance, look to see if price will come down to test the blue median line again as support. If we can break this resistance line, look to see the next sliding parallel as resistance.
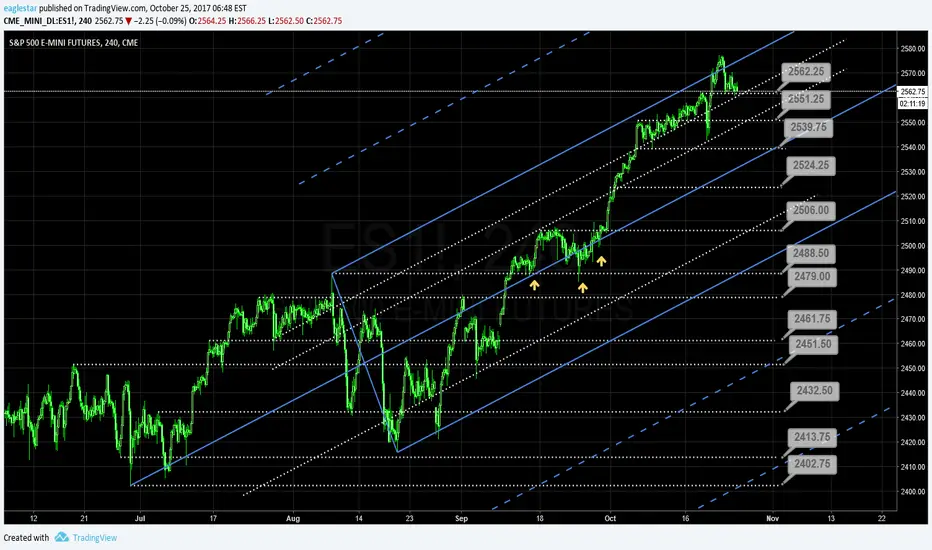
SandP 500 E-Mini Futures 240 CME Updated 10/25/2017Price has continued to be at support here at 2562. Look to see if price continues to hold here and can rise, or if we break down to 2551 area.