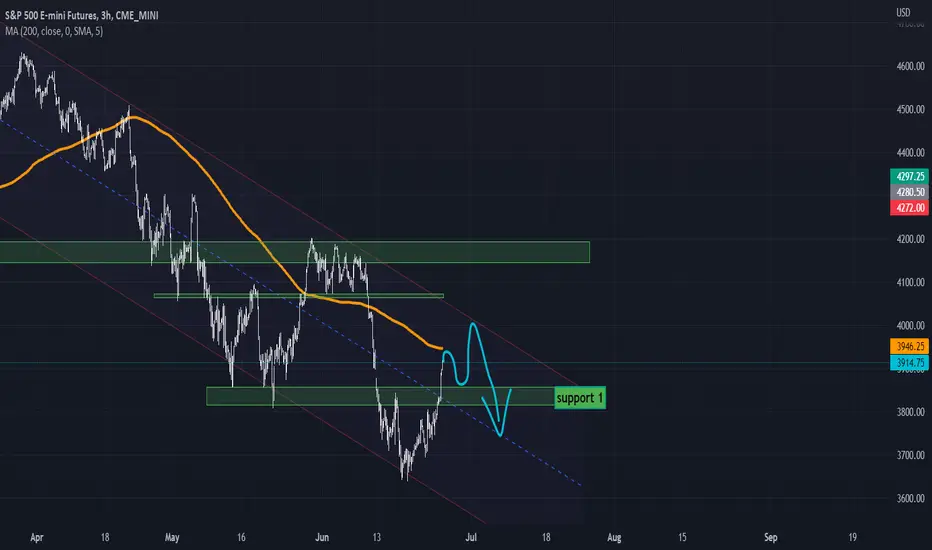
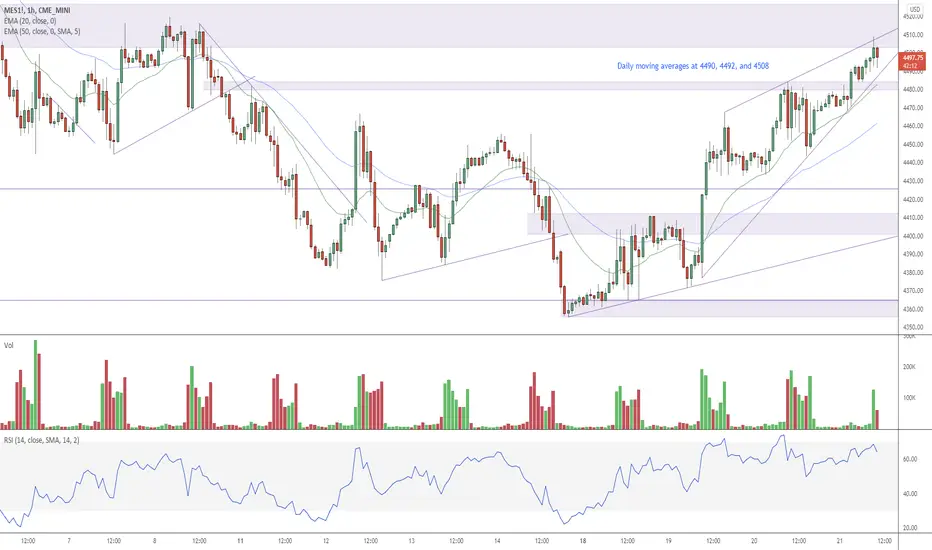
ES potential move in the next weekES is respecting an old channel from 17th march, i expect that the price will do a pullback to support 1 before it continue to move to the upper line of the channel.
Sandp500
How I understand the S and P todayThis is what I see in the S and P.
I didn't have the balls to buy liquidity (It is a new trade setup for me and I am not comfortable with it yet.) but did take a 10 handle scalp today out of the FVG.
I see equal opportunity for shorts and Longs so basically I am mostly sitting on my hands.

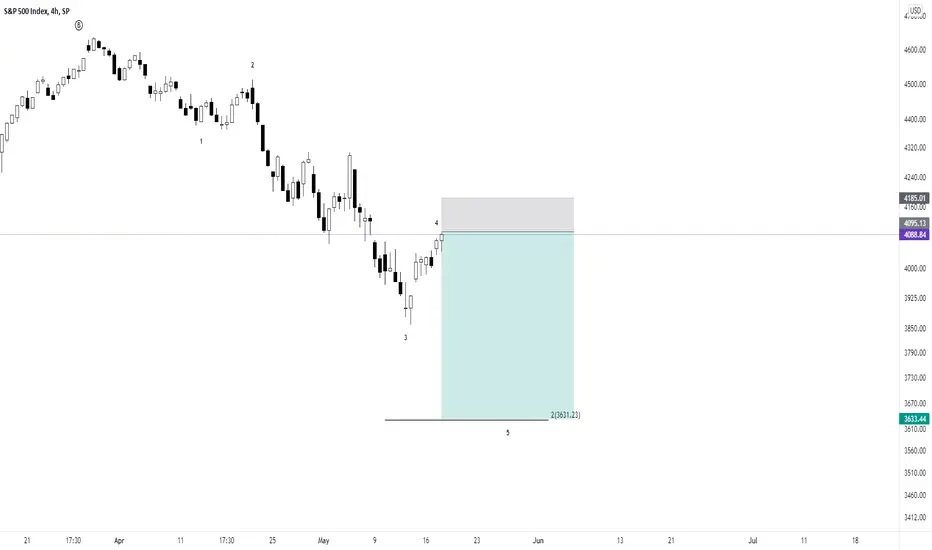
SPY short rally starting? I been charting SPY every different angle and time frame possible. Its next to impossible. lol but I did find this, which would make a case for a temporary bounce. I have 4 confluences. 1. SPY rally off the 200 sma on the 3day time frame. 2. Fibonacci extension from this wave down is a perfect 2.618 which lines up perfectly with 0.382 fib retracement from the previous low on march 23, 2020. 4. SPY is throwing a bullish hammer on the 1 day, 2 day, 3 day. If it does play out and rallies to the fib retracement line 0.236, that would make a total 10% gain, and 6% from where it is currently at 3966.

S&PS&P - Shows a nice Gab in the market. Reacted to a Bullish OB.
S&P And Nasdaq are like best buddies.
Take Note🧨

Market outlookThe S&P500 has done exactly as I feared.
Thesis: The US is transitioning. The US dollar was the reserve currency of the world. We exported dollars and it either sat in banks or was imported back as investment (Bonds and stocks). When we locked up Russia's money we made EVERY country re-evaluate their relationship with us. A significant pivot is happening on the macro scale. The US's future lies in how we make use of the US coming back home. I expect production of goods and base commodities to begin to truly take over for years to come. I do NOT expect to invest significantly in the S&P500 again until 2028-2032.
Things to keep in mind:
1. Valuations are still absurd. and either significant inflation or a drop in price is needed to bring them back to levels I would purchase at.
2. Relief rally should happen soon. Remember bear market rallies rip harder and faster than rallies in a bull markets.
3. The fed is squeezing the economy trying to reduce inflation. Until they pivot, expect lower lows.
4. There is a non-zero percent chance we enter a sustained bear market until 2028 ish. The first "real" one in 40+ years.
5. Commodities are looking great. They may drop for a bit longer but if you look back 50 years and adjust for inflation we are in the initial innings. For reference silver is 21.93$ and based on my calculations of inflation, its high was above 800.00$.
6. I am forecasting gold to go to 8000 over the next 6 years even if everything goes "well" for the west just due to the USD being revalued lower. If things get truly dicey I am expecting gold to reach 25,000 an ounce.
7. Remember the insidious nature of inflation. Even if we assume official levels of inflation are accurate and expect 5% for the next 5 years, cost of living will increase by at LEAST 29%. I expect levels closer to 80-300% increase cost of living based on my macro thesis.
Large unknown factors:
1. Europe is looking terrifyingly weak. If Europe begins to destabilize I expect a rush into the dollar for a time. This will have many unpredictable problems. We may see inflation cool for a time due to that but it just makes the problem bigger down the line.
2. If the US gov suddenly finds a cause that allows them to bless off on 50-200T in money printing I expect that to drastically shift what happens. It may prop up the stock market or it may be the final proof to investors they lost control and create a global bank run.
3. Contagions: in 2008 we saw one of the largest expressions of a contagion event. The entire financial world locked up. There are 100X's more dangers of similar events now than there where in 2008 because we never fixed the underlying problem and allowed it grow exponentially.
4. Food and energy are becoming huge global risk factors. Don't underestimate the global effects of wide spread starvation and loss of energy augmentation to humanity. My call is just based on the worlds Covid response. This is not even factoring in Russia and Ukraine. Western countries will be buffered from both of these trends but we will still strongly feel this through second and third order effects. Don't underestimate the power of starvation and lack of energy to produce large scale contagious risks unlike we have ever experienced in anyone's memory.

S & P 500 Looking for this strucuture on s and p 500 ! i feel we will have huge dip and it will drag bitcoin too towards the downside , let's see
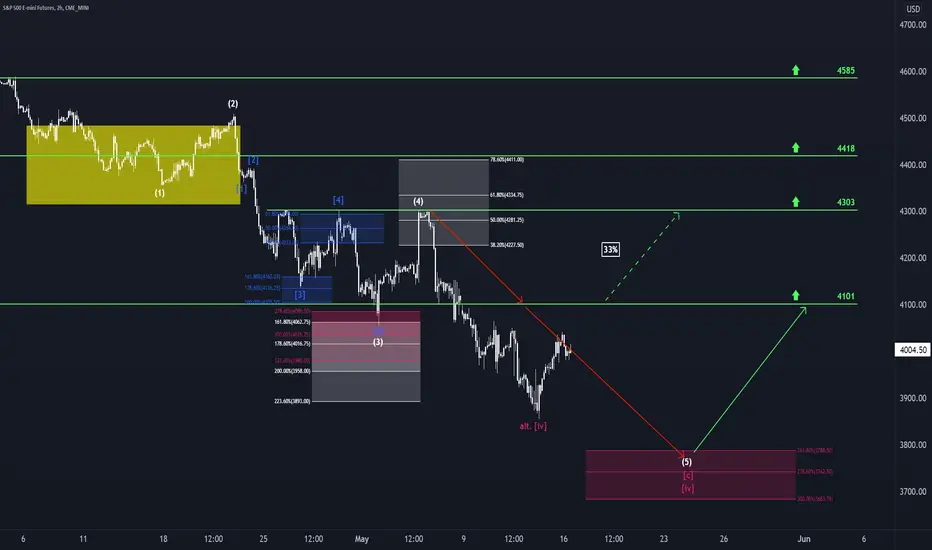
S&P500: Exhausting 🥵An exhausting time lies behind S&P500! It has been moving up and down with vivid gestures and has paced itself a bit only recently. We expect the index to take a rest in the magenta zone between 3788 and 3683 points, where it should also finish wave iv in magenta. Afterwards, it should be revived enough to rise towards the mark at 4101 points. However, there is a 33% chance that S&P500 could be too nervous to relax and thus could climb above 4101 points immediately.
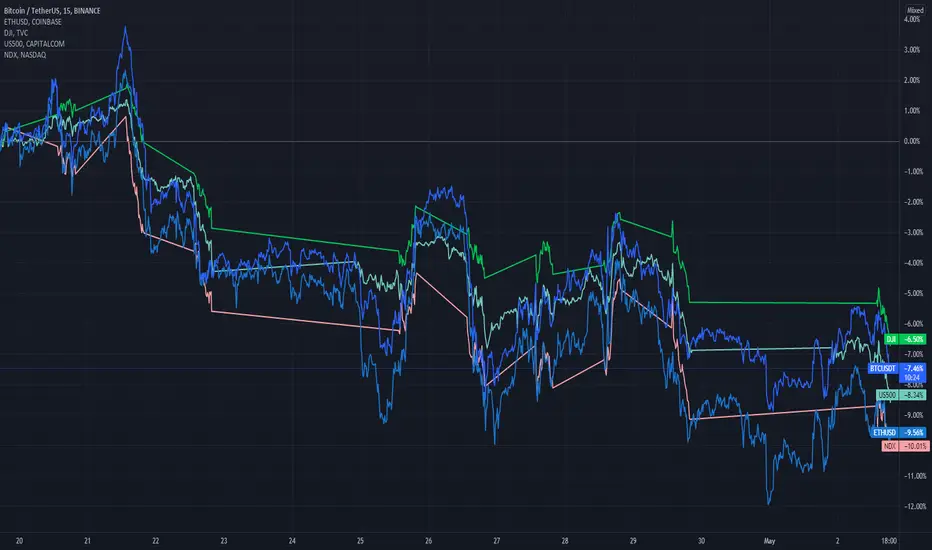
BTC and ETH HODLs Relative To Stocks: Crypto vs Wall StreetLooking at the charts during downturns may not be as fun as looking at them during bull runs, but if you're a long-term trader it's important to keep tabs on how things are performing even when the prices are down.
The pattern up until recently was that when stocks went up, so did crypto, and visa versa. The "volatility" of crypto assets often makes the prices go way up during good times, but it often plummets in price shortly afterwards as a response.
In recent years, however, a different sort of pattern has emerged - during bull runs the prices still go up but during downturns the asset has shown some resiliency against the massive drops that it used to experience in the past. It may be a result of increased market size and name recognition - giving the asset a level of stability comparable to traditional stocks and markets.
The USD markets have started to show signs that it's about to slow down, given the massive government spending and economic disruptions (COVID, supply chain issues, Russian sanctions) which is likely to take a turn for the worst as time goes on. How will crypto fair in this new economic environment? Time will tell.
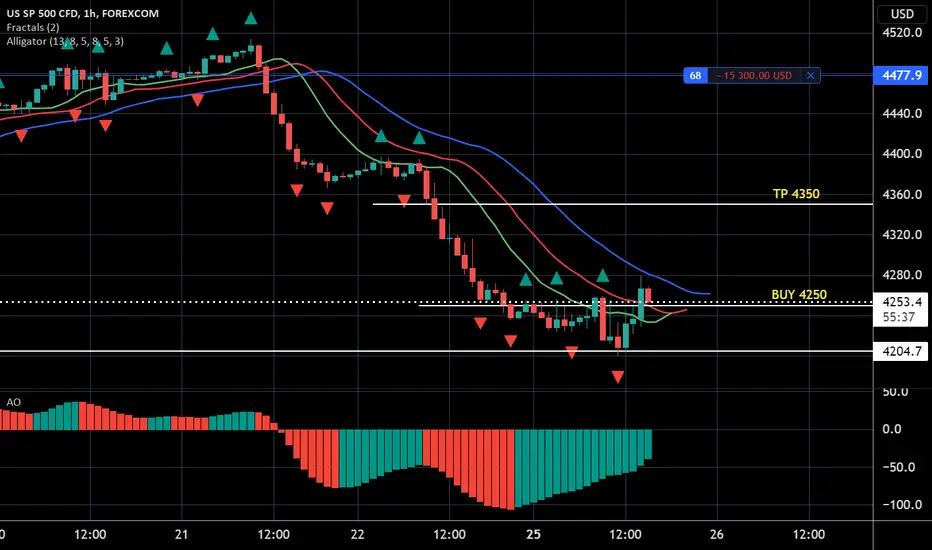
From 10k to 100k, Apr 25,22 S&P 500 Index BuySO big change happened in the last hour with markets reversing - why??? NO IDEA!!
All I know is I decided to put in a Buy Order at 4250 with a TP of only 100 points at 4350 just in case markets tank again.
We shall see - so far my account is up to about 24K from 10K a couple of months ago. Let's see if I can get to 100K by July :-)
Stay safe!
Heiko
S&P Futures Rising Wedge on Hourly TimeframeA breakdown out of this wedge could be a nice short opportunity. Running into a big resistance area here.
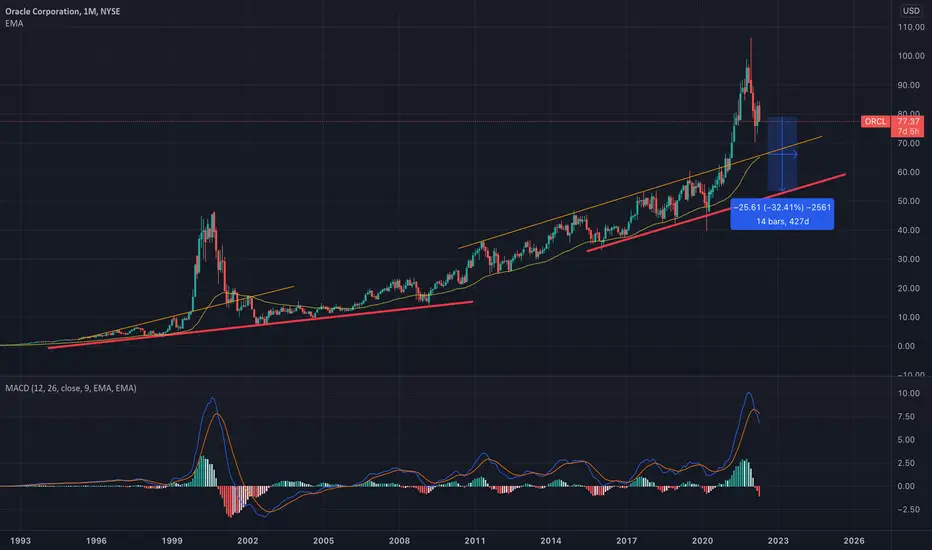
This is when the selling endsWhen the price of Oracle reverts to the mean, then we know it's over.
Current price action is a repeat of the 2000 dotcom bubble.
That's my running thesis right now.
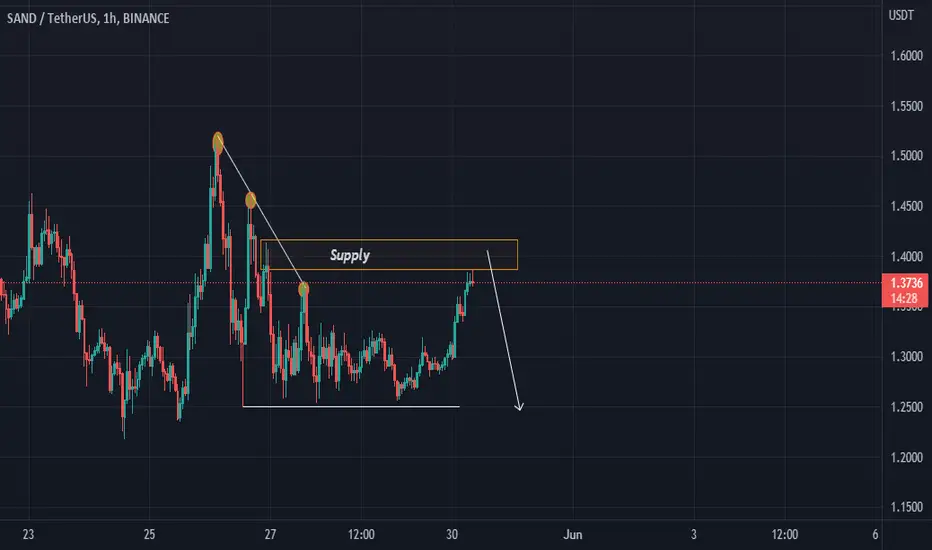
SANDBOXSAND/USDT As we can see, the price has been forming a bigger descending BullFlag Pattern .
TP 1 = 3.50$
TP 2 = 4.35$
TP 3 = 5.00$

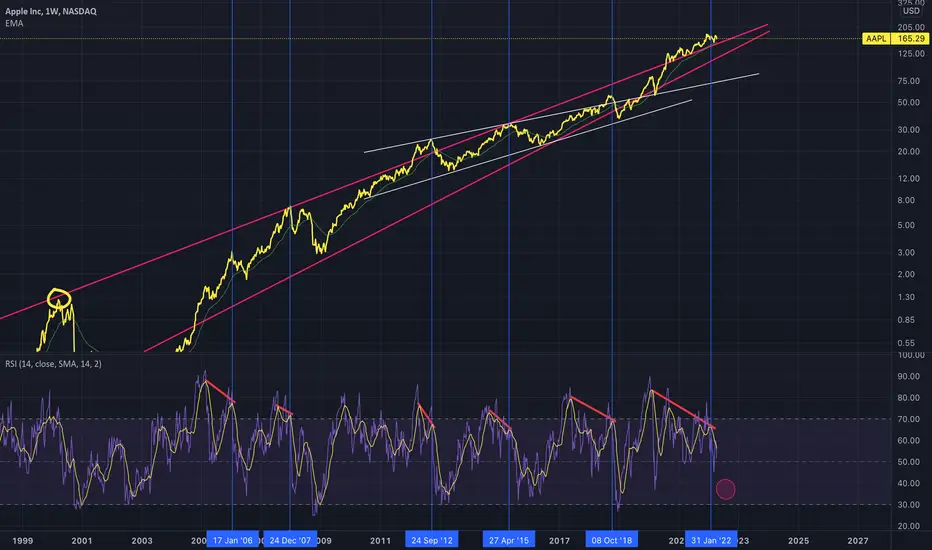
AAPL Huge Bearish Divergence Since Feb 2020A huge bearish divergence that started in Feb 2020 might be indicating a pullback is coming.
Historically speaking, all the bearish divergences in the past have usually signalled tops and resulted in large drawdowns.
Speculative bearish harmonic ES1! - S&P500lots of confluence to support this idea, but would be quite bearish

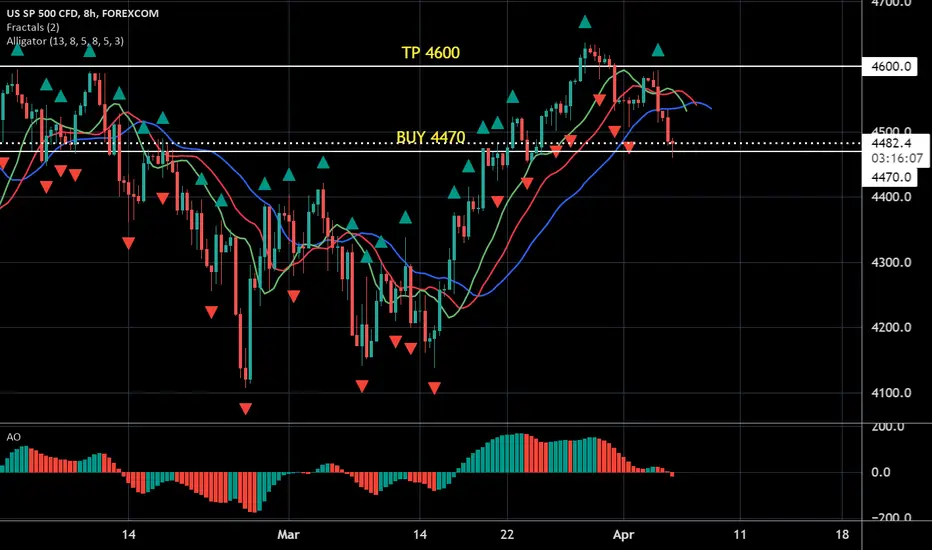
From 10k to 100k, Apr 6,22 S&P 500 Index BuyContinuing on my quest to 100k, it's looking like a bottom to me for the S&P 500 so I put in a Buy order with a TP at 4600, considering it was there just a few days back.
Happy Trading and stay safe.
Heiko
S&P 500 will have a major correction after a year of bull runS&P 500 will have a major correction after a year of bull run

S&P500 26.5% drop incoming? I am seeing the start of a possible textbook head and shoulders pattern on the futures chart. If we have a blood bath next week it could just be the start of the pain. Especially if we end the quarter badly (March 31st).
There are a lot of fundamental reasons we should be cautious in this market. Europe is seeing war on their doorstep. China is seeing massive instability in their housing market. US bonds (the blood of the financial world) are not catching bids. US banks may soon stop lending based on the yield curve, which will significantly effect the average American housing market.
My long term buying target will be staged at the late 2019 early 2020 high if we break down hard from here. I will begin laddering in when we get within 5% of 2019 high.
The next large drop in the market will see more stimulus. I am expecting 50-100T in stimulus is needed to keep this market even remotely stable in the next drop. This may be the final hurrah of the US stock market before a long bear market. Commodities are all breaking out which shows money is beginning to rotate.
We are playing in a high volatility market. Any leverage is a huge risk and should be done with the utmost care.

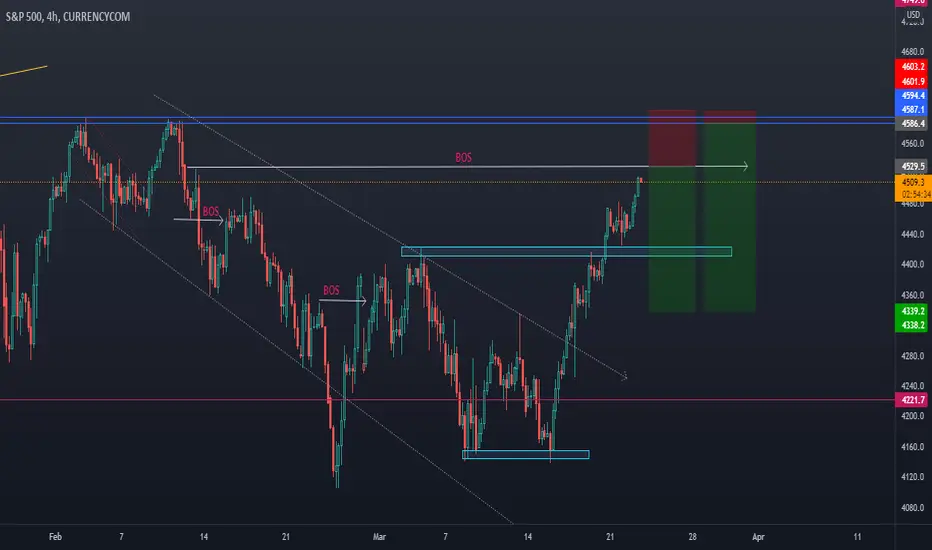
⚓US500 4510.4 SHORT IDEA + 0.94 % * PRICE ACTION & STRUCTUREHELLO EVERYONE
HOPE EVERYONE IS DOING GOOD HAVING A GOOD ONE.
HERE'S A LOOK AT POSSIBLE SCENARIOS THAT COULD PLAY OUT IN THIS WEEK ON US 500.
The index opened the week with a bullish rally since it broke out of that descending channel.
* The index is still strongly bullish looking at momentum to the up side, but what goes up must come down the question is where.
* Have a couple of levels to look at with interest ahead, will be looking at reversal patterns at this levels.
* Break above of structure puts the second entry into play.
- looking for reversals with the bears see below.
lets see how it goes.
IF THIS IDEA ASSISTS IN ANY OR IF YOU LIKE THIS ONE
SMASH THAT LIKE BUTTON & LEAVE A COMMENT.
ALWAYS APPRECIATED
____________________________________________________________________________________________________________________
* Kindly follow your entry rules on entries & stops. |* Some of The idea's may be predictive yet are not financial advice or signals. | *Trading plans can change at anytime reactive to the market. | * Many stars must align with the plan before executing the trade, kindly follow your rules & RISK MANAGEMENT.
_____________________________________________________________________________________________________________________
| * ENTRY & SL -KINDLY FOLLOW YOUR RULES | * RISK-MANAGEMENT | *PERIOD - SWING TRADE
SPX buyafter a long uptrend we notice a slight pullback, but att the end of that pullback we see a strong green candle that confirms the market will start heading up again.

Breaking down where the stock market is goingLooking at the daily chart on the ES futures contract (S&P) Today was a big day with price pulling up and holding the lows form Feb 24.
The market has been on a crazy bull run since March 2009 so seeing this pullback is no surprise really, in fact I am surprised it didn't come earlier. Of course there was the pretty short-term collapse in 2020 but then the strong reversal we see in the chart here.
4800 was the highs and now resistance, along with 4700. You can see on Jan 18th price breaking down from the trendline and really confirming a trend change.
For the bulls it is very important what happened today but we will need to see price taking out the 4300 and 4400 walls for me to be confident that the market is turning bullish again.
Last week we saw a similar move only to see price pullback again. The key though is holding that Feb 24th low.
Let's see if price is above 4300 by the end of this week.

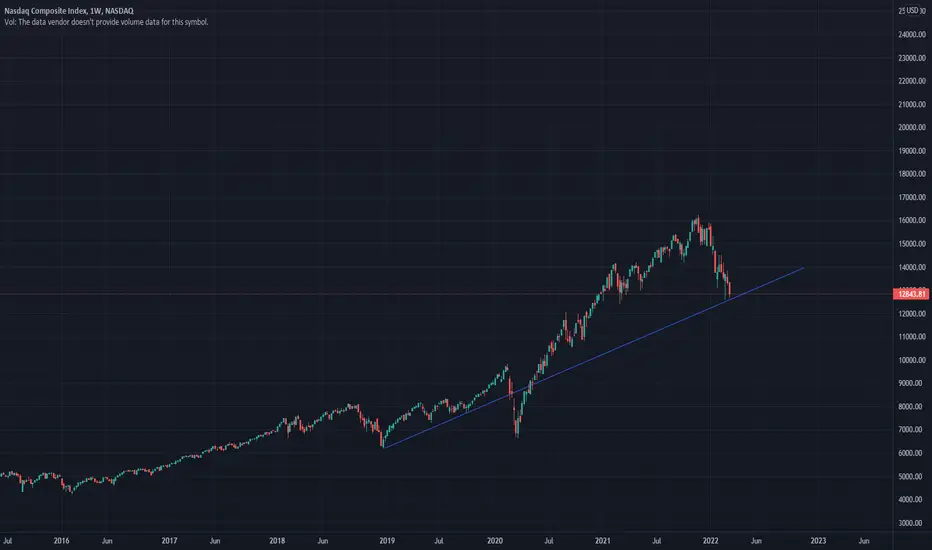
Nasdaq is in extreme support will bounce back after fed meetingNasdaq is in extreme support will bounce back after fed meeting
Note: This is only for educational purpose, please consult your financial advisor for investing.
US30 is in possible sell zone!!US30 has broken to the downside with
a GAP opening as explained in my analysis. Now the price is testing the previous support as resistance and likely drop from 33410.
If you enjoy this analysis, please like the idea and share it with your friends
Disclaimer: This is not investment advice and is shared only for educational purposes. Do your own analysis before taking any trade as per this plan.
