#SAND/USDT #SAND
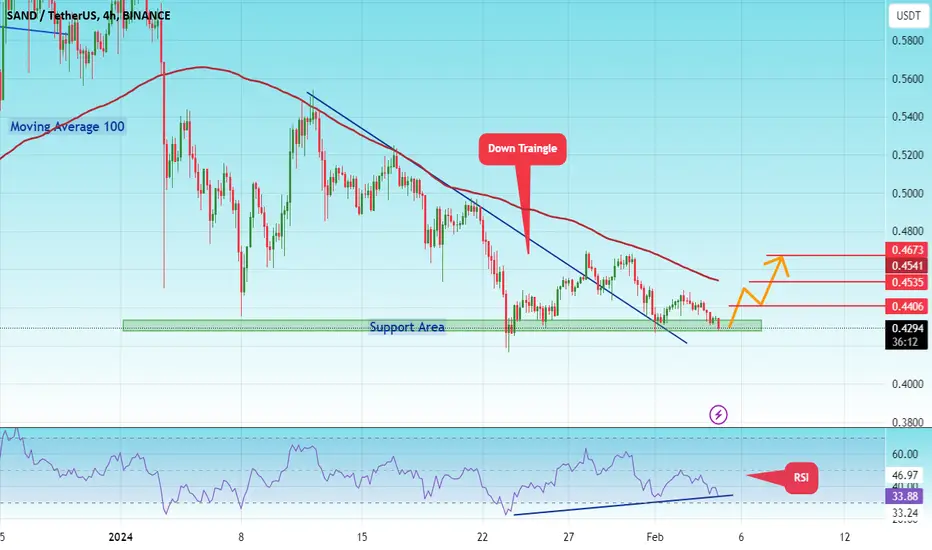
The price is moving in a descending triangle on the 4-hour frame
We are now at the lower border of the channel from which the price has rebounded more than once, and this is also the support area
A rebound is expected to the upside
We also have support from the RSI indicator
Current price is 0.4300
First target 0.4400
Second target 0.04535
Third goal 0.4673
SANDUSD
#My #SAND #Short #Order #Activated #Eddy#My #SAND #Short #Order #Activated #Eddy
It's My SAND Short Order is Activated <3 Enjoy ;-)
Also Its time to dump crypto, You Can Short Any Altcoins too ;-) Have a Good Night <3

SANDUSD - An Interesting PossibilityThe possibility of two shoulders forming on each side one larger should accompanied with a smaller one all joined together by a larger head structure
Using this we can assume a movement down creating the next right shoulder.
From there I would expect price to move up from the horizontal line in green.
LS = Left Shoulder
RS = Right Shoulder

Wiggle range: 0.6418-1.0030Hello traders!
If you "Follow" us, you can always get new information quickly.
Please also click “Boost”.
Have a good day.
-------------------------------------
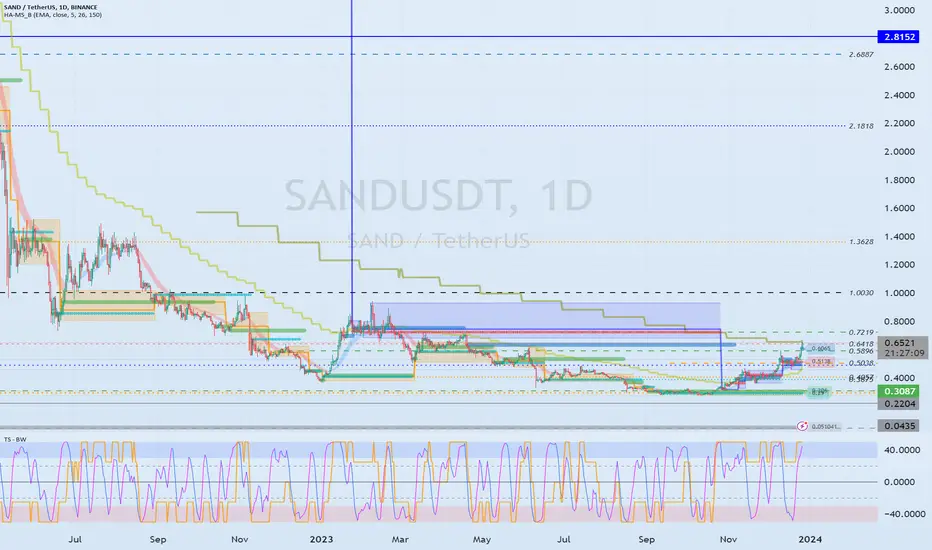
(SANDUSDT chart)
(1M charts)
In order to switch to an upward trend, the price must be maintained above the MS-Signal indicator.
Additionally, in order to show a major upward trend, the price must be maintained above the HA-High indicator.
Accordingly, after rising above the MS-Signal indicator, it is necessary to test support near the MS-Signal indicator and check whether the HA-High indicator is generated by falling.
However, there is a possibility that the price will continue to rise and rise above the HA-High indicator, so it is necessary to check the movement after it rises above the MS-Signal indicator.
(1W chart)
The HA-Low indicator is an indicator created during the low point.
Accordingly, if the HA-Low indicator is supported and rises, it is likely to start an upward trend.
If the price rises above 0.6418 and holds, it is expected to turn into an upward trend.
Before touching the HA-High indicator on the 1M chart, you need to make sure that you can touch the HA-High indicator on the 1W chart.
Since the RSI indicator appears to have entered the overbought zone, if there is a shake in the 0.6418-1.0030 range, the HA-High indicator is expected to fall and be created.
If it shows support near the HA-High indicator, it is time to buy.
The HA-High indicator is an indicator created during the high point, so if it encounters resistance at the HA-High indicator, it may fall to touch the HA-Low indicator, so caution is required.
(1D chart)
Where to look for the bottom can be viewed differently depending on the investment period.
The bottom section I see is below 1.0030.
Therefore, I think full-fledged buying will occur when the price appears to be maintained above 1.0030.
Aggressive buying is possible when support is found in the 0.6418-1.0030 range.
If the price holds above 1.0030, I think there is a good chance that a sharp rise will begin.
When the rise begins,
1st: 1.3628
2nd: 2.6887-2.8152
It is necessary to check whether there is resistance around the first and second stages above.
--------------------------------------------------
- The big picture
The full-fledged upward trend is expected to begin when the price rises above 29K.
This is the section expected to be touched in the next bull market, 81K-95K.
-------------------------------------------------- -------------------------------------------
** All explanations are for reference only and do not guarantee profit or loss in investment.
** Trading volume is displayed as a candle body based on 10EMA.
How to display (in order from darkest to darkest)
More than 3 times the trading volume of 10EMA > 2.5 times > 2.0 times > 1.25 times > Trading volume below 10EMA
** Even if you know other people’s know-how, it takes a considerable amount of time to make it your own.
** This chart was created using my know-how.
---------------------------------
The Sandbox (SAND) - July 5Hello?
Traders, welcome.
If you "follow", you can always get new information quickly.
Please also click "Like".
Have a good day.
-------------------------------------
(SANDUSDT 1W Chart)
It is important to be able to rise above the 1.2898-1.5294 section.
(1D chart)
Resistance: around 1.5294
The key is to find support above 1.0829 and move above 1.2898.
------------------------------------------------------------ -----------------------------------------------------
** All indicators are lagging indicators.
Therefore, it is important to be aware that the indicator will move accordingly as price and volume move.
However, for convenience, we are talking in reverse for the interpretation of the indicator.
** The MRHAB-T indicator used in the chart is an indicator of our channel that has not been released yet.
** The OBV indicator was re-created by applying a formula to the DepthHouse Trading indicator, an indicator disclosed by oh92. (Thanks for this.)
** Support or resistance is based on the closing price of the 1D chart.
** All descriptions are for reference only and do not guarantee a profit or loss in investment.
(Short-term Stop Loss can be said to be a point where profit and loss can be preserved or additional entry can be made through split trading. It is a short-term investment perspective.)
---------------------------------

Forecast for a long SAND position for a good profitEntry into the position at the level $ 0.445 -0.41. This can bring you great profit. I place a limit order. I set up the chart and indicators. I follow the movement of the crypto market and will publish further instructions as exchange prices for cryptocurrencies change.

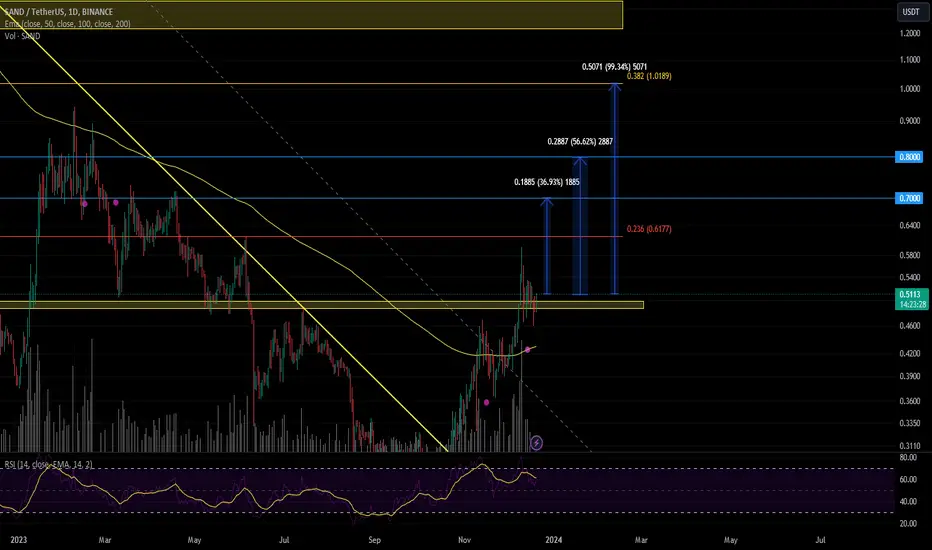
I expect SAND to move towards the 0.382 Fibonacci level.Hello everyone!
I suggest considering entering positions based on the current values on Sandbox.
Recently, the asset managed to break and sustain above the 200-day moving average EMA, and then break the global resistance level in the ~$0.49 range.
The following targets are in place:
$0.7 - +36%
$0.8 - +56%
$1.01 - +99%
Please note that this is not financial advice, and any actions you take are at your own risk!
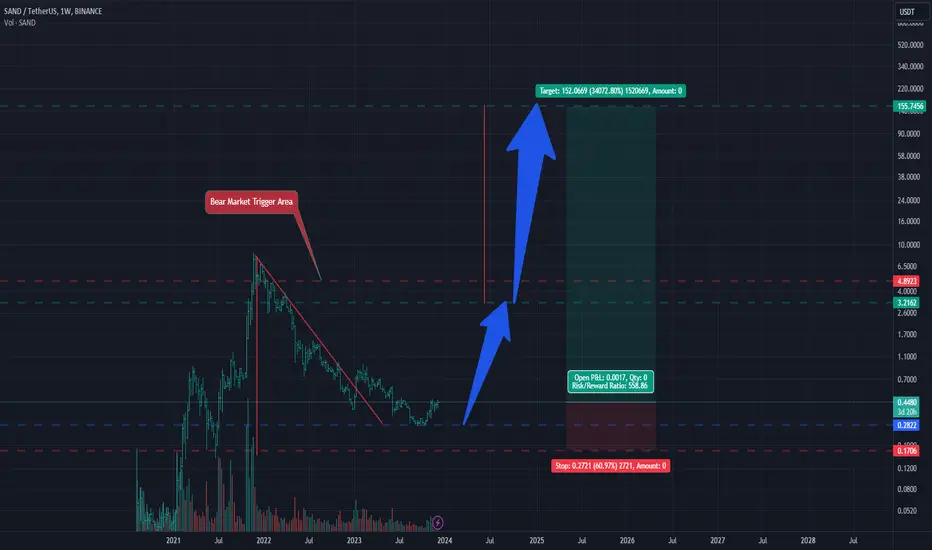
SAND showing a very impressive investment opportunityHi Everyone;
today we have one of the best risk to reward Investment opportunity
it is more than 550 times the risk and the chart is look very promising.
I expect breaking the previous bear market key point will clear the way to the final target
Grab the SANDWe have a large diametric for SAND. To complete the F branch, we can go up. If it pull back to the green zone, it is a good opportunity to buy/long.
For risk management, please don't forget stop loss and capital management
Comment if you have any questions
Thank You

SANDUSD ❕ correctionTD Sequential formed a reversal signal down (4H TF)
Price and RSI are forming a divergence.
I believe that the asset will correct from the current level.
SANDUSD IdeaA large falling wedge pattern on this pair and the daily chart for SAND.
Falling wedges love to break out bullishly.
Horizontal line shows a potential support once price breaks above it.
Bullish.

SAND is about to go ballistic!Sorry for the clickbait title but I am feeling the vibe on this one. I know, I know. Targeted by the SEC as a security. But, on the other hand, one of the tokens legalized by the Hong Kong market. Outside of debates regarding fundamentals, let's dive into what the technicals seem to be showing us!
First, take a look at the beautiful triangle! Dang son, it don't get much better than that yo!
Now, look down there at that RSI. See that red TL? Pop, pop, ...and POP. At every touch you can bank on cash.
Incidentally, this third touch will coincide with a touch of the bottom of our triangle. And, just below that, a very important support.
This is an easy bet. I have entered at 37 cents ish and will hold till at least 53 cents with the remaining balance to 58 if I don't get stopped out first.
I will be moving my stops up as we go as always.
Best,
Stew

SANDUSD ❕ lower boundary of the channelSAND broke below 50EMA on 1H TF.
The 50EMA crossed down through the 200EMA on the 1H TF.
RSI chart is moving in bearish zone (1H and 30m TFs)
The asset will decline after exiting the channel.

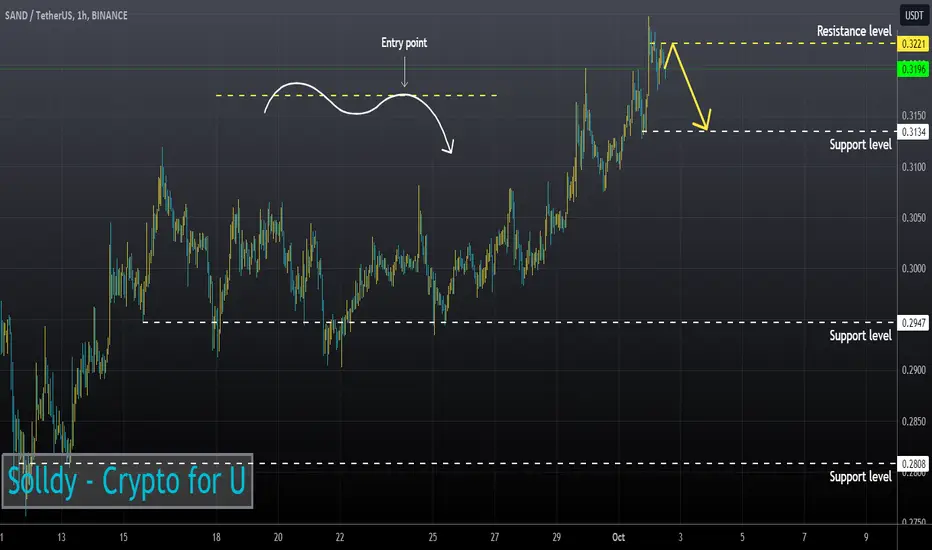
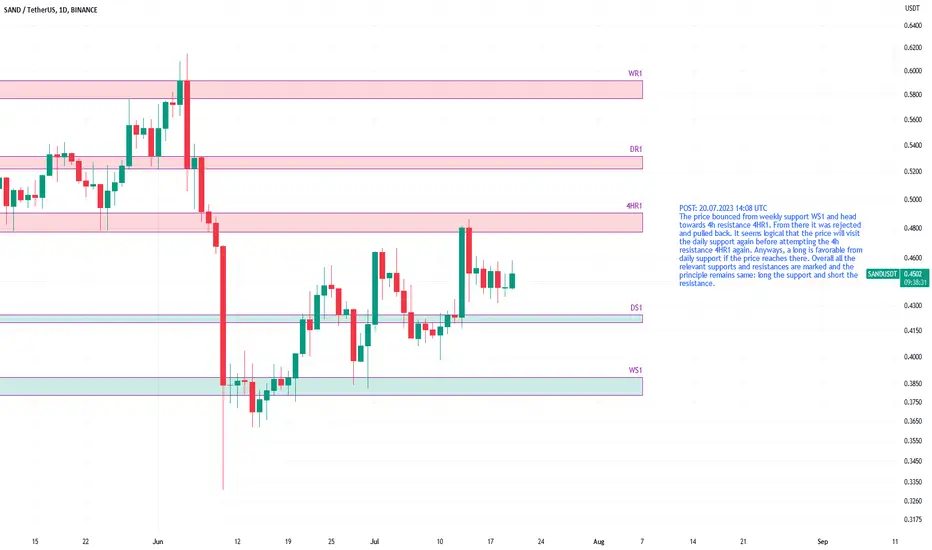
SANDUSDT relevant support and resistance levelsThe price bounced from weekly support WS1 and head towards 4h resistance 4HR1. From there it was rejected and pulled back. It seems logical that the price will visit the daily support again before attempting the 4h resistance 4HR1 again. Anyways, a long is favorable from daily support if the price reaches there. Overall all the relevant supports and resistances are marked and the principle remains same: long the support and short the resistance.
Sand OutlookI expect a bounce from the current price to two mentioned targets. SAND has been recently added to allowed trading crypto in Hong Kong which pumped the price. Afterwards, it was target by SEC and labelled as a security and price dumped. I am following this token for years now. It is a mid-risky token; therefore, you can take the huge plunge from $0.61 to $0.33 by SEC as a buy opportunity.

SAND Sandbox and the Altcoin Season ThesisIf you haven`t sold SAND here:
or bought it back here:
Then the recent developments in the cryptocurrency market, particularly the favorable court ruling for Ripple Labs, signal an optimistic start to a new altcoin season.
With the federal judge ruling that some of Ripple's sales of the XRP token do not fully meet the definition of a securities offering, it instills confidence in the altcoin space.
This ruling brings clarity to the regulatory landscape and alleviates concerns surrounding XRP, leading to major cryptocurrency exchanges, including Coinbase, relisting the token. The reintroduction of XRP to these platforms demonstrates growing acceptance and renewed interest in this altcoin.
The anticipation surrounding the approval of a spot bitcoin ETF in the United States adds to the positive sentiment in the market.
The successful launch of a previously approved ETF in Europe further reinforces the upward trend for altcoins.
The recent court ruling that declared XRP as not a security sets a precedent that could potentially benefit other cryptocurrencies currently classified as securities by the SEC. In the SEC's case against Binance, they designated 10 cryptocurrencies, including BNB, BUSD, SOL, ADA, MATIC, ATOM, SAND, MANA, AXS, and COTI, as securities.
Additionally, in the SEC's lawsuit against Coinbase, they named 13 cryptocurrencies, reinforcing their stance on SOL, ADA, MATIC, SAND, and AXS, and adding CHZ, FLOW, ICP, NEAR, VGX, and NEXO to the list.
This development showcases the increasing institutional acceptance of cryptocurrencies and creates a ripple effect across the market, providing a boost for various altcoins, including SAND Sandbox, for which my price target is $0.60.
Looking forward to read your opinion about it!

SAND Sandbox Technical ReboundIf you haven`t sold SAND here:
Then in my opinion, based on the analysis of SAND's chart patterns, I can see the potential bullish signals suggested by the double bottom and falling wedge patterns.
These patterns often indicate a reversal or continuation of the current trend, which makes me optimistic about the stock's future performance. Considering the support found at the double bottom and the narrowing price range in the falling wedge, it appears that buyers are entering the market, and there is potential for an upward price movement.
Given these chart patterns and my analysis, I have set a price target of $0.50. I believe that a technical rebound leading to such a price level is feasible based on the signals observed.
Looking forward to read your opinion about it.

SAND Looks Ready to Breakout!Traders,
SAND is in prime position to move even higher than it already has these past few weeks. I haven't entered this trade yet but may soon pending these occurrences:
I want to see a move above the 200 day ma with confirmation
I want to see a break above the red descending TL
I want to see a move above the Ichimoku cloud
What we have:
A breakout of the triangle in Logarithmic View. Click the "Log" text in the bottom left corner of the chart to see this view.
What I don't like:
RSI nearing oversold
Let me know in the comments if/when you decide to enter this trade.
Stew

SAND LONGHELLO folks
sand now going to uptrend wave analyisis and smc
entry : 0.47
sl : 0.444
tp : 0.68
dyor
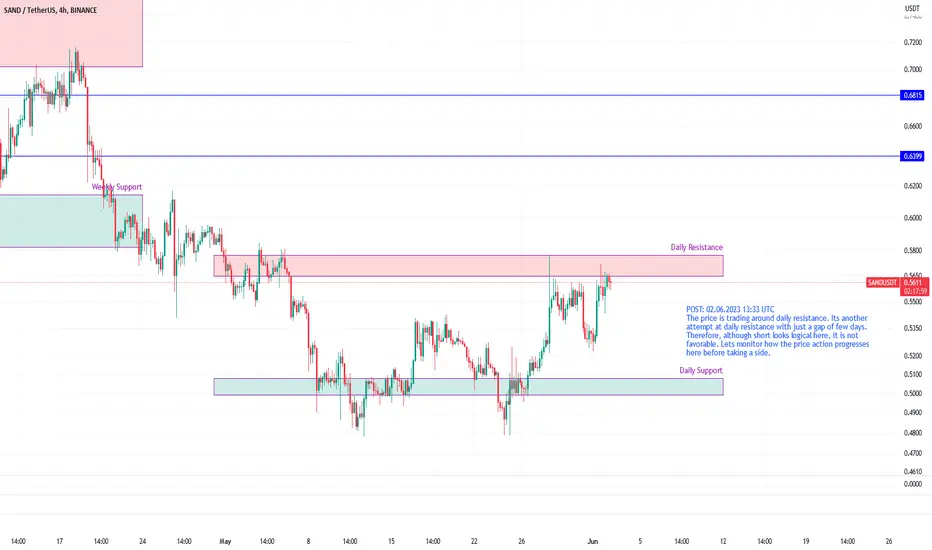
SANDUSDT at daily resistance but may break outThe price is trading around daily resistance. Its another attempt at daily resistance with just a gap of few days. Therefore, although short looks logical here, it is not favorable. Lets monitor how the price action progresses here before taking a side.
SANDUSD ❕ broken the downtrend lineRSI indicates that a bullish divergence is forming on the 4H Timeframe.
The RSI chart is near neutral values (4H, 1H and 30m TFs)
50EMA has broken up 200EMA on the 1H Timeframe.
I believe the asset will continue to rise after fixing above the resistance level.
SAND Looking bullish (Long entry setup)Sand looks to be reversing back from a pretty important area and after a nice change of character I expect a minot pullback to grab some liquidity before going all the way up!
NFA
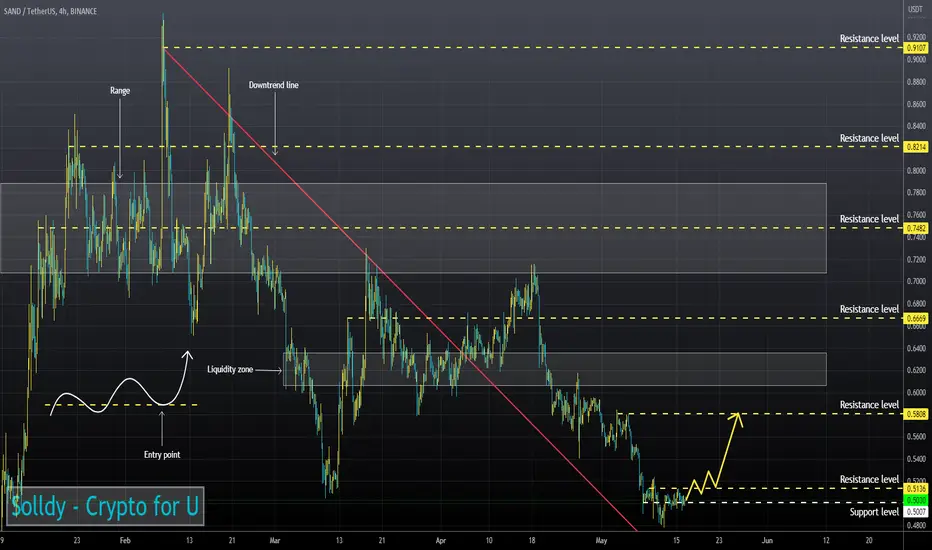
SANDUSD ❕ broken the downtrend lineSAND is trading in the liquidity zone.
Price, RSI chart and trading volumes have formed a bullish divergence (1H TF)
I believe the asset will bounce from the support level.
