SAND SCALP TRADE IDEA.1. Market Structure:
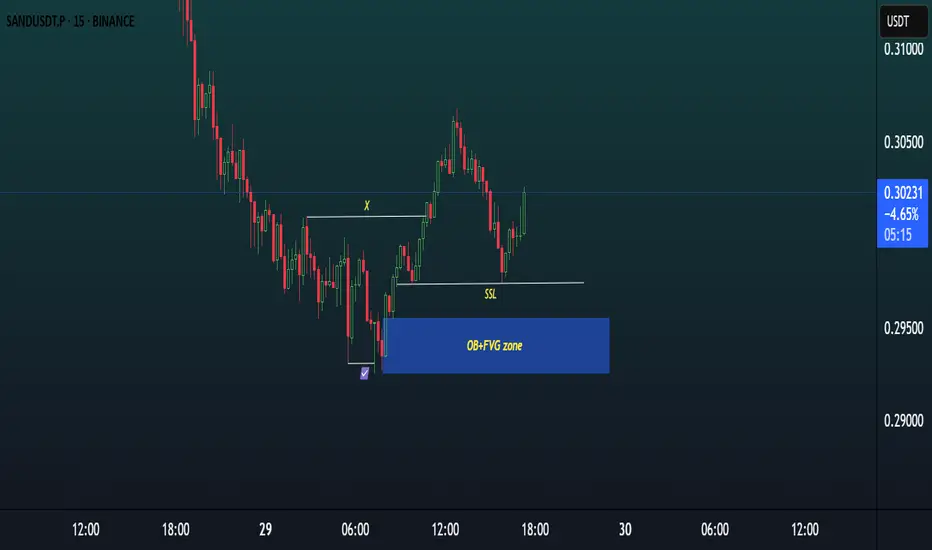
The chart shows a bullish market structure with a clear Break of Structure (BoS) to the upside (marked by “X”).
After this impulsive move, the price has entered a retracement phase, forming lower highs and lower lows within this short-term correction.
2. Liquidity Engineering:
Sell-Side Liquidity (SSL) is visible just below the 0.2980 level, formed by equal lows and previous swing lows.
This liquidity has not yet been swept, meaning the market may still target this area to grab liquidity before any strong bullish move.
3. Key Demand Zone – OB + FVG:
Below the SSL lies a strong demand zone, marked by a Bullish Order Block (OB) overlapping with a Fair Value Gap (FVG) in the 0.2940–0.2960 range.
This confluence increases the probability of a strong bullish reaction when price enters this zone.
4. Current Price Action:
Price is currently reacting around 0.3000, showing a minor bounce, but no key zone has been tapped yet.
As SSL is still intact and unmitigated, there is a high likelihood that price will first move lower to sweep the liquidity and tap into the OB + FVG zone.
5. Trade Expectation:
Ideal setup: Wait for price to sweep SSL, enter the OB + FVG zone, and then look for bullish confirmation (such as a bullish engulfing, change of character, or lower timeframe BOS) to consider a long position.
Stop Loss: Below the OB zone (~0.2930).
Take Profit: 1.5x to 2x RR, or targeting the recent high around 0.3060–0.3080.
6. Summary:
SAND/USDT is showing bullish intent, but is likely to first sweep sell-side liquidity and tap into the OB + FVG demand zone before resuming the uptrend. Patience is key — await a clean reaction and confirmation before entering long.
Sandusdt
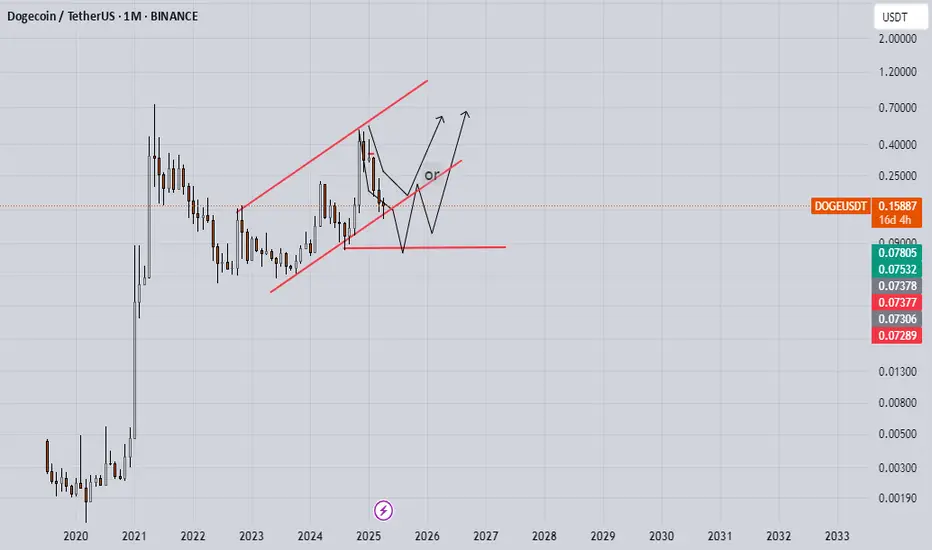
THE SANDBOX mid - to long - termThis might seem obvious to some, but it’s worth emphasizing —
📌 When analyzing charts like this, switch to a Line Chart instead of Candlesticks.
Why?
It filters out market noise and shake-outs
You can clearly see how price respects key zones and levels
Candles often distort the picture with wicks — line charts show the real body movement
Bullish Setup:
Market has printed a clean W-bottom, confirming bullish intent.
We are currently retesting the neckline of the pattern — a common and healthy move before continuation.
A successful retest could lead to an impulsive move upward toward target zones.
🎯 Target Zones:
Green zone (top) — this is the maximum target in the current structure.
Anything above the red line already carries increased risk, and should be approached with caution.
Above green zone = extreme risk / high-probability rejection unless backed by strong fundamentals.

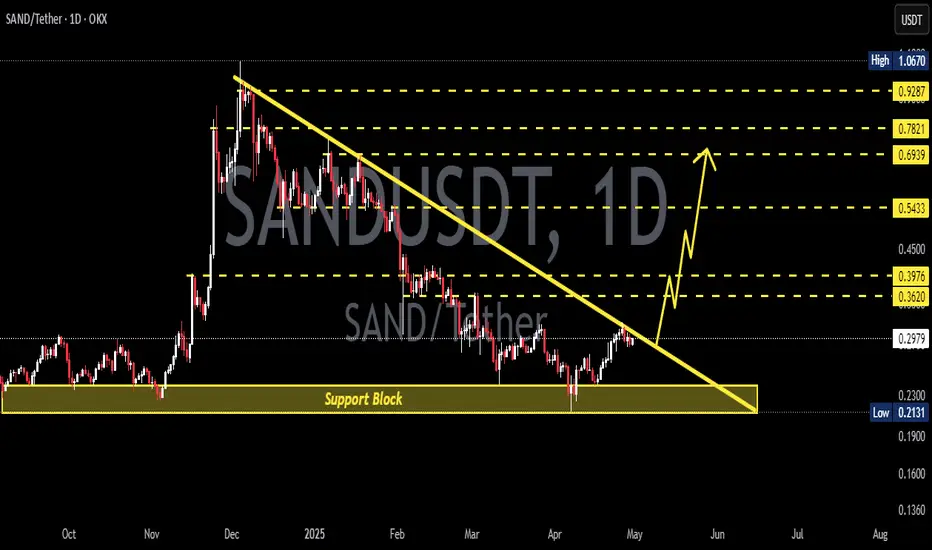
SANDUSDT Breaks Major Downtrend – Golden Pocket Retest!
Technical Analysis:
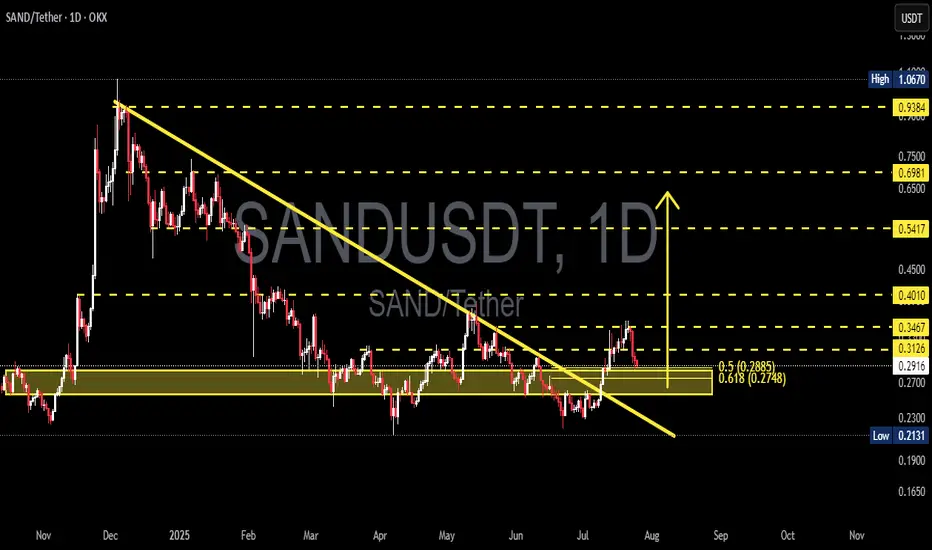
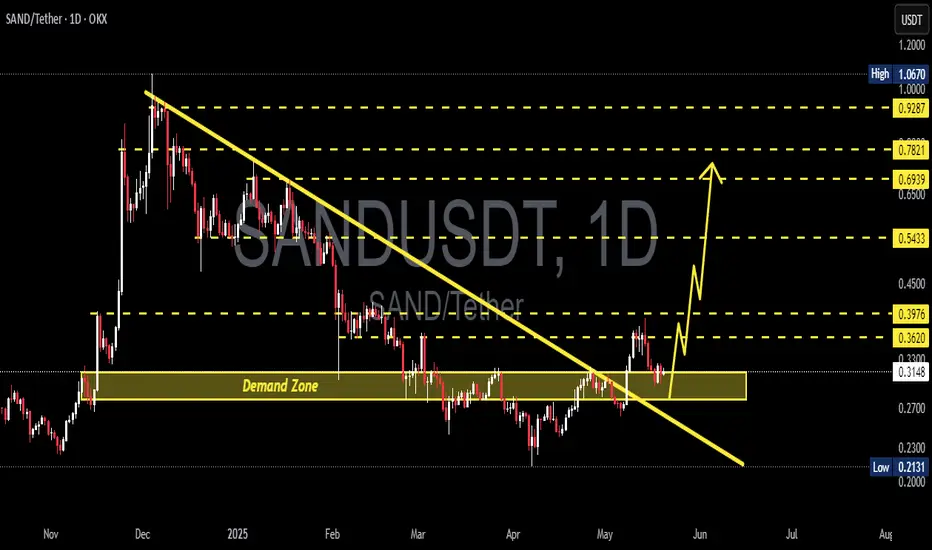
SAND/USDT has successfully broken out of a descending trendline that had been capping the price since late 2024. The breakout occurred with increased volume, signaling strong buyer interest.
Following the breakout, price rallied and is now retesting a key support zone, which includes:
A demand zone (yellow box) between 0.2748 - 0.2885, aligning with the Fibonacci Golden Pocket (0.618 - 0.5)
A solid horizontal support around 0.2913
Fibonacci retracement levels are clearly defined:
0.3126
0.3467
0.4010
0.5417
Up to major resistance near 0.9384
---
Bullish Scenario 🟢:
If the price holds above the Golden Pocket zone and prints bullish confirmation (such as a bullish engulfing or hammer candlestick), then further upside potential is likely:
1. Initial targets: 0.3126 and 0.3467
2. Mid-range targets: 0.4010 and 0.5417
3. Long-term potential: 0.6981 and possibly the major resistance at 0.9384
Stronger confirmation would come from a daily candle closing above 0.3126.
---
Bearish Scenario 🔴:
If price breaks below the 0.2748 zone, it could indicate a failed breakout, potentially leading to:
1. Initial support: 0.2700
2. Deeper pullback zone: 0.2131 (previous low)
3. Potential fakeout of the trendline breakout
A daily close below 0.2748 would strongly validate the bearish setup.
---
Chart Pattern Overview:
Descending Triangle Breakout already confirmed
Price is now in the retest phase of the breakout
The Golden Pocket Fibonacci zone is the crucial point of trend continuation or reversal
---
Conclusion:
The breakout from the long-standing downtrend marks a strong shift in structure. However, a successful retest at the Golden Pocket will be key to confirming further bullish continuation. If buyers defend this zone, SAND is likely to print a higher low and resume its upward move.
#SANDUSDT #CryptoBreakout #AltcoinAnalysis #TechnicalAnalysis #FibonacciLevels #TrendlineBreakout #GoldenPocket #BullishSetup #BearishSetup
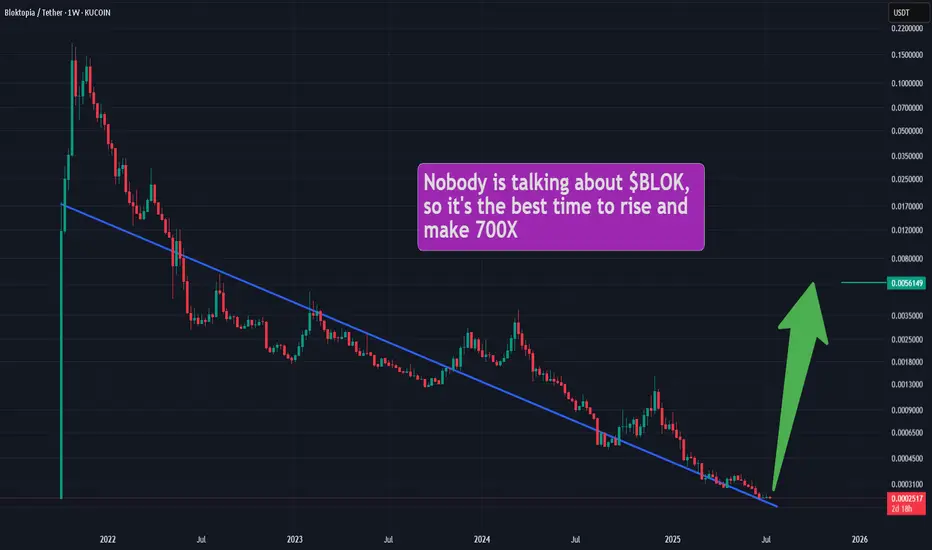
Bloktopia OutlookNobody is talking about #BLOK, so it's the best time to rise. It's like #SAND and #MANA when nobody knew them. 700X possible!
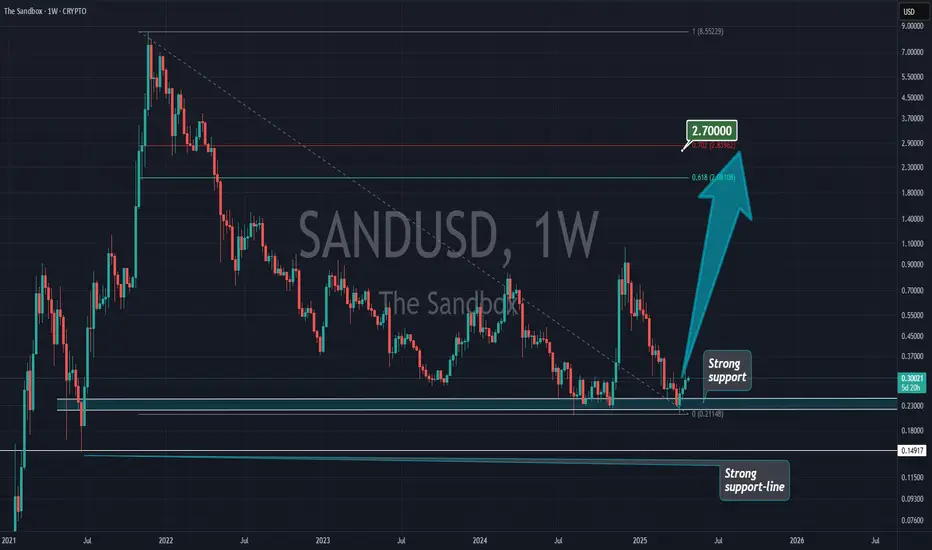
SANDBOX RALLY..Since 2021, SAND has been quiet but now holds strong support at $0.22. I believe a rally to $2.70 is likely in the coming months.
(ITS NOT A FINANCIAL ADVISE)

SAND – Rotation in PlaySAND is showing early signs of strength off the long-term demand zone near $0.23–0.24, where it's been accumulating for several months. Price just printed a strong weekly bounce, up +16%, reclaiming the bottom of the range.
This area has acted as a key base since mid-2023 — with each touch producing a notable reaction. Now trading at $0.286, SAND is attempting to rotate toward the top of the established range.
Key Levels
Support (Range Low): $0.23–0.24 (strong demand zone)
Resistance (Mid-Range): $0.43
Range High: $0.85
A clean flip of the mid-range ($0.43) could open the door to test $0.70+.
📌 Risk management: A break and weekly close below $0.23 invalidates this setup. As long as it holds, the upside potential is attractive from a risk/reward standpoint.
This is a classic accumulation > reclaim > expansion structure. Let the chart speak if the range holds, the rotation is in play.
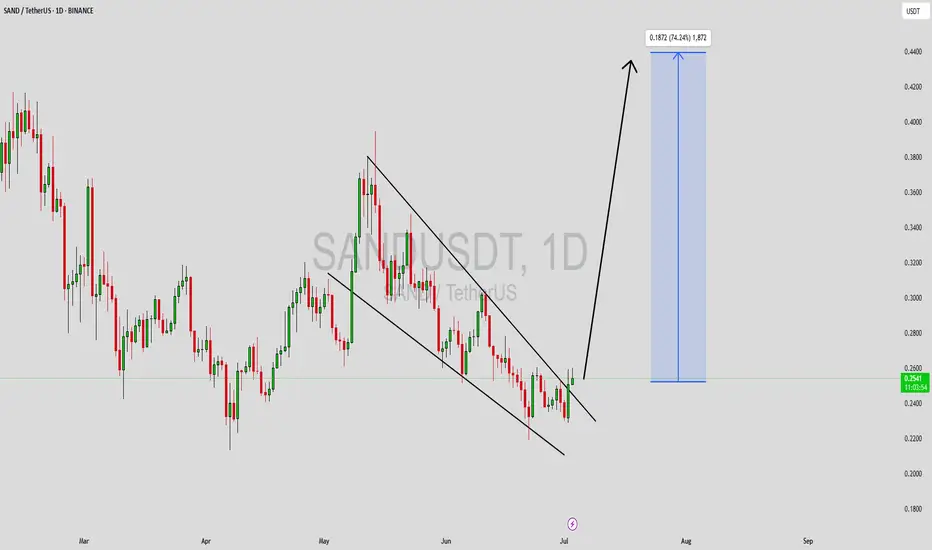
SANDUSDT Forming Bullish ReversalSANDUSDT is showing a promising technical setup that could attract more attention in the coming days. The chart clearly highlights a well-defined downward channel which many traders recognize as a potential bullish reversal zone, similar to a falling wedge pattern. The good trading volume adds more conviction to this setup, indicating that larger market participants may already be accumulating positions before a breakout. A projected gain of 70% to 80%+ could be realistic if this breakout plays out as expected, making it an exciting watch for swing traders and investors.
The Sandbox (SAND) project has been a popular topic in the crypto community thanks to its role in the metaverse and NFT ecosystems. With the broader market showing signs of recovery and investors regaining confidence, altcoins with strong fundamentals and favorable technical structures like SANDUSDT could outperform. Traders will want to monitor key resistance levels along the descending trendline for confirmation of a breakout, while also keeping an eye on rising volume to validate momentum.
Community sentiment and on-chain data suggest that interest in SAND is steadily picking up again. This aligns perfectly with the technical picture, offering a solid blend of narrative and chart strength. As more traders and investors look for the next big mover, SANDUSDT could easily become a standout performer if this pattern confirms. Always manage risk properly and watch for any signs of rejection to adjust your strategy accordingly.
✅ Show your support by hitting the like button and
✅ Leaving a comment below! (What is You opinion about this Coin)
Your feedback and engagement keep me inspired to share more insightful market analysis with you!
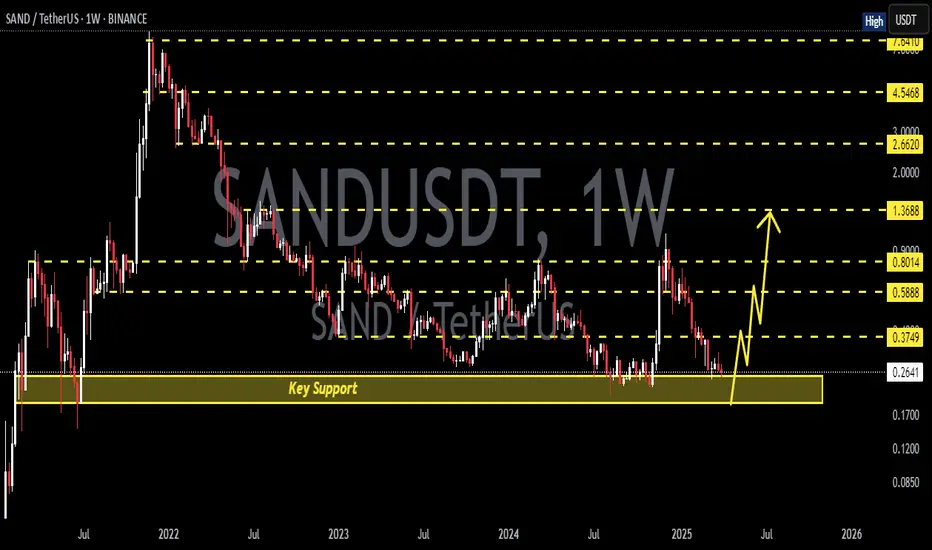
SAND/USDT at Critical Support Zone – Rebound Potential?Detailed Technical Analysis:
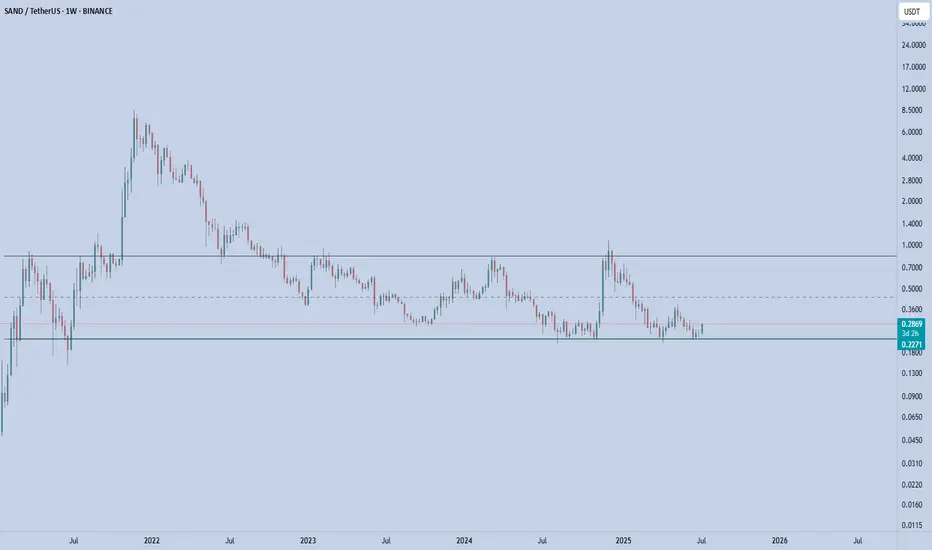
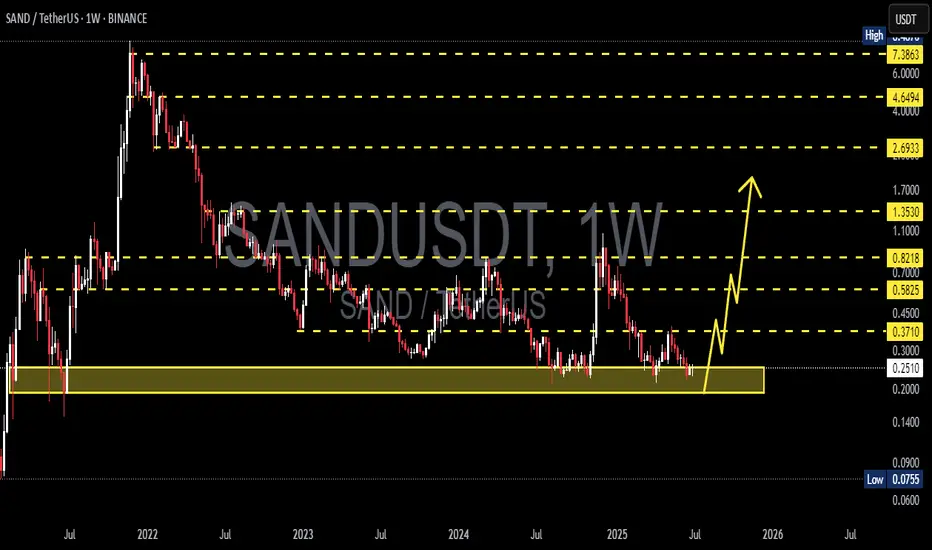
The SAND/USDT weekly chart shows the price currently hovering around a historically strong support zone between $0.20 – $0.25. This yellow-marked demand area has been tested multiple times since 2021 and has consistently prevented further downside, making it a crucial decision point for both bulls and bears.
🟢 Bullish Scenario:
If the price manages to hold this key support and prints bullish price action (e.g., a bullish engulfing or hammer candlestick), a reversal is likely. The projected upward path on the chart outlines the next key resistance levels:
1. $0.3710 – Initial resistance.
2. $0.4500 – First major breakout confirmation.
3. $0.5825 - $0.7000 – Mid-term resistance cluster.
4. $0.8218 - $1.3530 – Longer-term targets if bullish momentum sustains.
Bullish Confirmation:
Weekly candle close above $0.37
Breakout with strong volume beyond $0.45
🔴 Bearish Scenario:
If the price breaks below and closes under the $0.20 support zone, it would signal a bearish continuation, with possible downside targets at:
1. $0.14 – Minor historical support.
2. $0.09 - $0.075 – Extreme low support region and historical bottom.
Bearish Confirmation:
Weekly close below $0.20
Strong breakdown volume without immediate bullish rejection
📊 Chart Pattern Overview:
✅ Triple Bottom / Accumulation Zone:
The current support area resembles a potential triple bottom structure or long-term accumulation phase. If confirmed, this pattern could mark the beginning of a new bullish cycle.
🧠 Conclusion:
SAND is at a make-or-break level. As long as the price holds above the $0.20 - $0.25 support zone, bullish recovery remains a valid possibility. However, a breakdown below this level could trigger a significant bearish move.
#SANDUSDT #CryptoAnalysis #AltcoinSeason #TechnicalAnalysis #BullishScenario #BearishScenario #CryptoTrading #PriceAction #SupportResistance #TripleBottom
SANDUSDT 1W AnalysisSAND ~ 1W Analysis
#SAND Buy back gradually from here if you still have confidence in this coin with a short term target of at least 20%+ from this support.

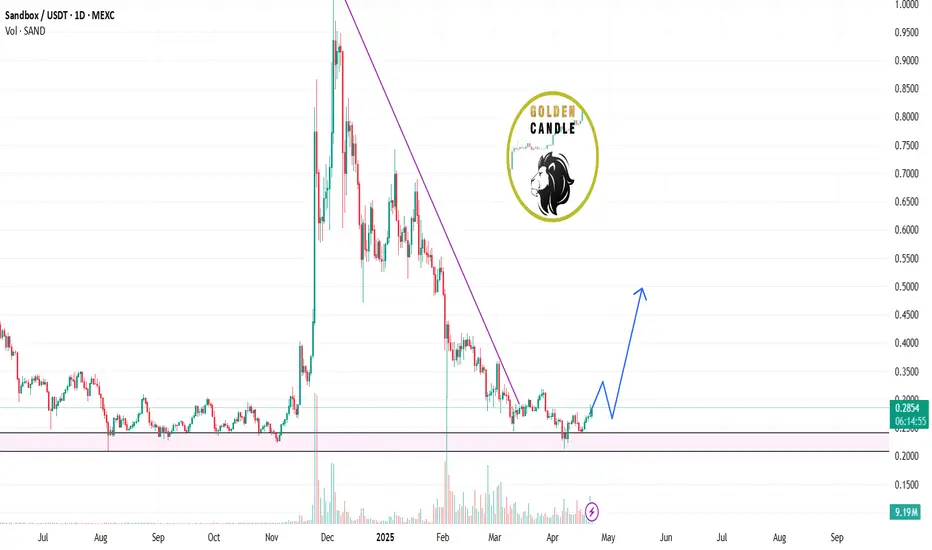
sand buy spot "🌟 Welcome to Golden Candle! 🌟
We're a team of 📈 passionate traders 📉 who love sharing our 🔍 technical analysis insights 🔎 with the TradingView community. 🌎
Our goal is to provide 💡 valuable perspectives 💡 on market trends and patterns, but 🚫 please note that our analyses are not intended as buy or sell recommendations. 🚫
Instead, they reflect our own 💭 personal attitudes and thoughts. 💭
Follow along and 📚 learn 📚 from our analyses! 📊💡"
SANDUSDT 1D Analysis SAND ~ 1D Analysis
#SAND Buy gradually from here if you still have confidence in this coin with a short term target of at least 15%+ from here.
SANDUSDT BUY/LONGBy utilizing Fibonacci retracement levels, historical patterns, , we can formulate a hypothesis that the market might follow a similar trajectory if bullish sentiment prevails.
#SAND/USDT#SAND
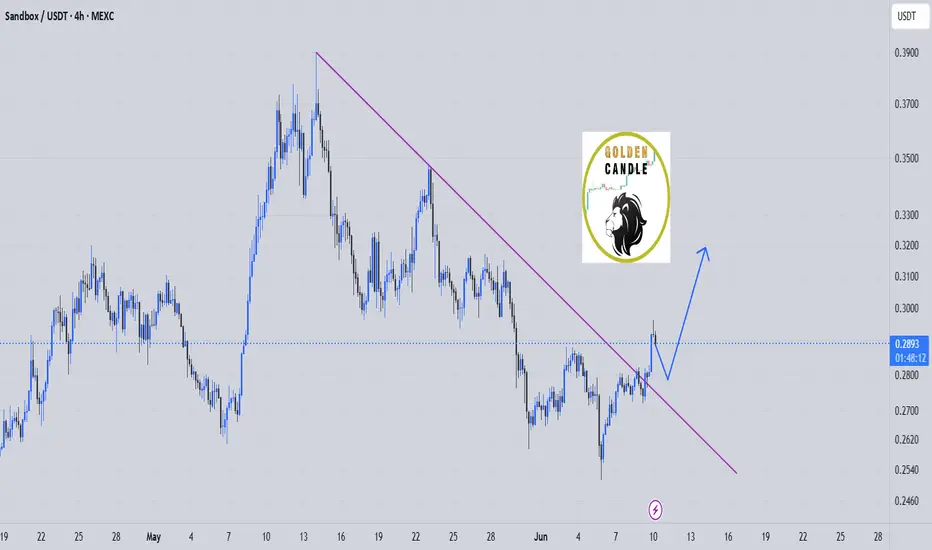
The price is moving within a descending channel on the 1-hour frame and is expected to break and continue upward.
We have a trend to stabilize above the 100 moving average once again.
We have a downtrend on the RSI indicator that supports the upward move with a breakout.
We have a support area at the lower boundary of the channel at 0.2790, which acts as strong support from which the price can rebound.
Entry price: 0.2828
First target: 0.2890
Second target: 0.2971
Third target: 0.3048

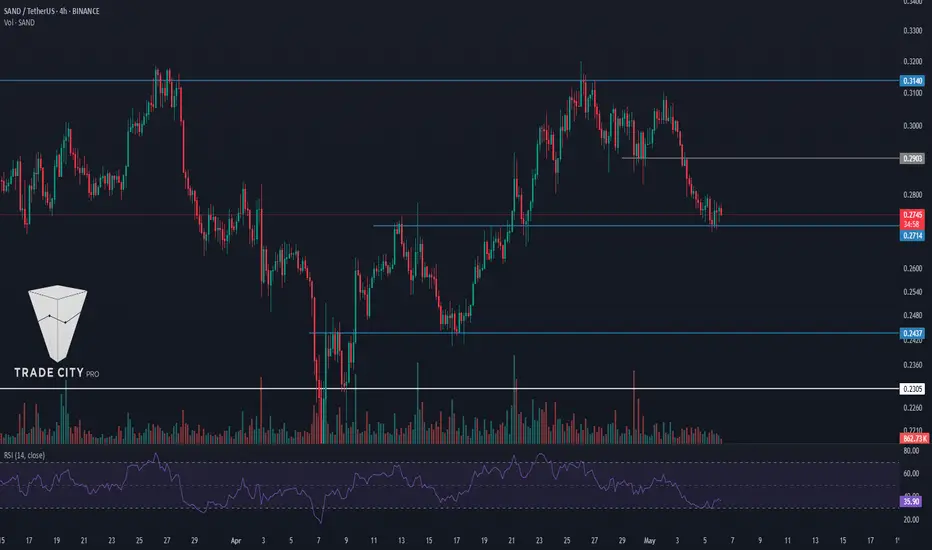
TradeCityPro | SAND: Critical Support Test After Pullback👋 Welcome to TradeCity Pro!
In this analysis, I want to review the SAND coin for you. It’s one of the most popular Metaverse projects, widely recognized and among the top in its category.
✔️ This project’s coin currently holds a market cap of $693 million and ranks 91st on CoinMarketCap.
⏳ 4-Hour Timeframe
As you can see on the 4H chart, after a bullish leg that pushed the price up to 0.3140, a correction phase began. Following the break of 0.2903, the price has now corrected down to 0.2714.
🔍 If this 0.2714 level breaks, the price could continue down to the support at 0.2437 — so a break below 0.2714 would be a valid short entry.
👀 Personally, I prefer waiting for the price to first bounce off 0.2714, move upward, and print a lower high relative to 0.2903, then break 0.2714 on a second attempt. In that case, the short setup becomes much more reliable.
🔽 That said, even if the level breaks now without a bounce — since RSI is already near the oversold zone — I’ll still open a short. If RSI enters oversold, it could lead to a sharp drop.
⚡️ One negative factor for short positions is that volume has been decreasing since the price started correcting from 0.3140, which isn't a good signal for further downside — there’s a divergence between price and volume.
📈 However, that’s a positive signal for potential long positions. When volume drops during a correction in an uptrend, it shows buyers still have control. As long as this divergence persists, the uptrend is more likely to continue than to reverse.
📊 For long positions, if buying volume enters the market and the price holds above 0.2714, you can enter based on lower-timeframe structure breaks. The main long entry will be confirmed once the price breaks above the 0.3140 high.
📝 Final Thoughts
This analysis reflects our opinions and is not financial advice.
Share your thoughts in the comments, and don’t forget to share this analysis with your friends! ❤️
SANDUSDT 1D AnalysisSAND ~ 1D Analysis
#SAND Buy gradually after successfully penetrating this resistant line with a short -term target of at least 15%+.
SAND BOX bullishsand box on monthly and weekly TF looks really bullish to me, and im expecting a huge upside movement to about $3 for mid-term
sand long longterm spot "🌟 Welcome to Golden Candle! 🌟
We're a team of 📈 passionate traders 📉 who love sharing our 🔍 technical analysis insights 🔎 with the TradingView community. 🌎
Our goal is to provide 💡 valuable perspectives 💡 on market trends and patterns, but 🚫 please note that our analyses are not intended as buy or sell recommendations. 🚫
Instead, they reflect our own 💭 personal attitudes and thoughts. 💭
Follow along and 📚 learn 📚 from our analyses! 📊💡"
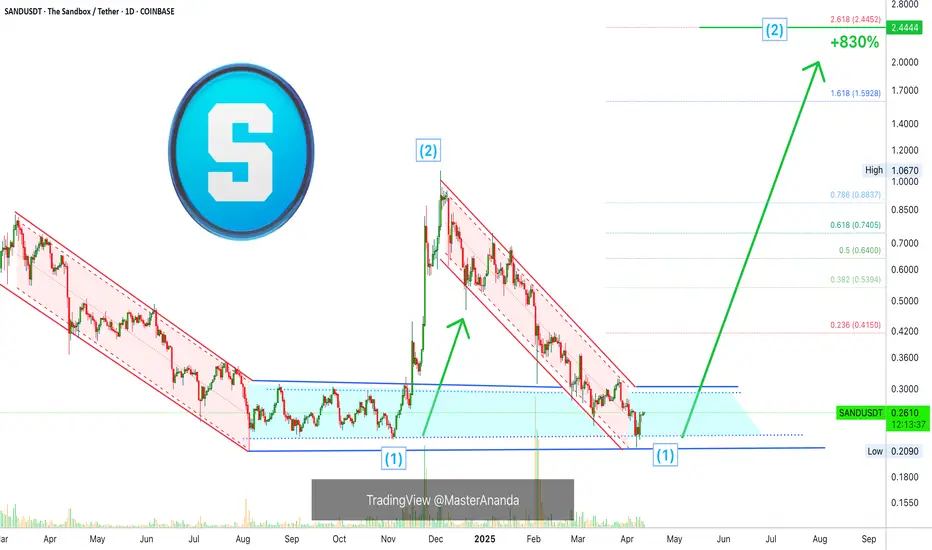
The Sandbox: Your Altcoin ChoiceLet's continue with Your Altcoin Choice. Some analysis can take a while, but all will be done.
The Sandbox is in a very good situation as shown on the chart. The price range marked with light blue is a long-term support and also a confirmed buy zone. The last wave, amounting to more than 375%, came out of this zone. After a correction and long-term higher low, SANDUSDT is ready to go at it again.
This chart shows potential for a "small wave" relatively speaking. Small in relation to the potential The Sandbox has for the full bull market. See this chart below:
Notice the big difference. This one has a total potential of more than 5,000%. This would include the bull market bull run phase which is not included in the first chart.
The previous bullish cycle, from November 2020 through November 2021 produced total growth of 29,371%. There was a stop, a correction between March and June 2021 lasting 87 days. After this the last bullish jump.
This is what needs to be kept in mind for this cycle. 87 days but much more growth happened afterward. With all the sideways action in these transition years, we get used to seeing a stop after just one wave. When the market is full blown bullish, this stop is only temporary and after it ends we get the resumption of the bullish wave.
We have been seeing sideways, the bull market is an uptrend. This is a big difference and something to keep in mind. Crypto will grow.
Bitcoin, The Sandbox, Gala Games, Cardano and much more.
Thanks a lot for your continued support.
Namaste.
SANDUSDT 1WSAND ~ 1W Analysis
#SAND Buy from here if you still have a Conviction on this coin with a short -term target of at least 20%+.
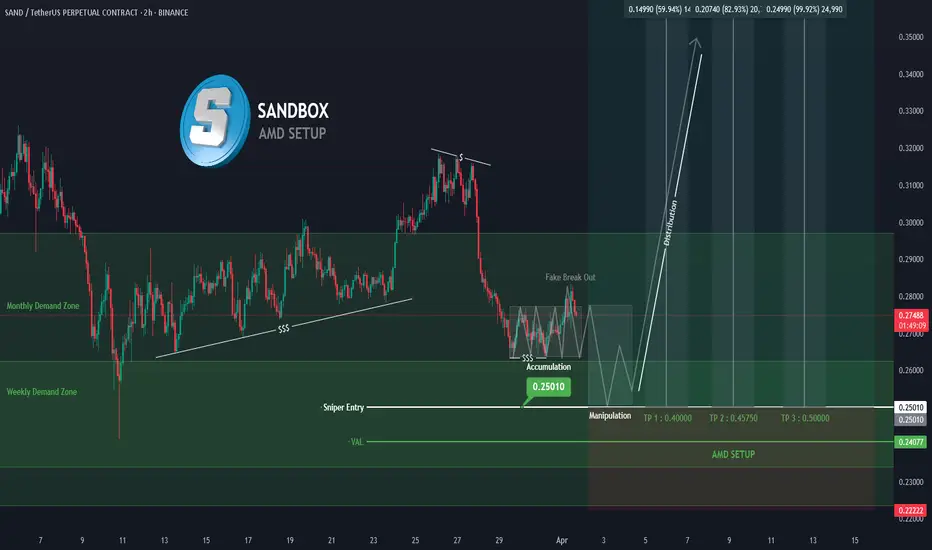
#SAND #SANDUSDT #SANDBOX #LONG #SWING #AMD #Eddy#SAND #SANDUSDT #SANDBOX #LONG #SWING #AMD #Eddy
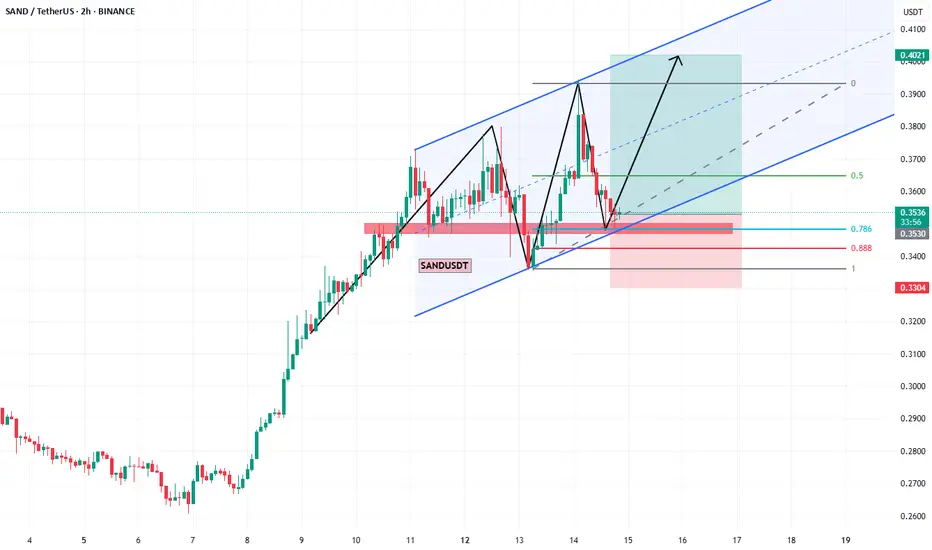
SANDUSDT.P SWING Long AMD Setup
Important areas of the upper time frame for scalping are identified and named.
This setup is based on a combination of different styles, including the volume style with the ict style. (( AMD SETUP ))
Based on your strategy and style, get the necessary confirmations for this Swing Setup to enter the trade.
Don't forget risk and capital management.
The entry point, take profit point, and stop loss point are indicated on the chart along with their amounts.
The responsibility for the transaction is yours and I have no responsibility for not observing your risk and capital management.
By scratching the price and time bar, you can see the big picture and targets.
Note: The price can go much higher than the second target, and there is a possibility of a 50%-100% pump on this currency. By observing risk and capital management, obtaining the necessary approvals, and saving profits in the targets, you can keep it for the pump.
Be successful and profitable.
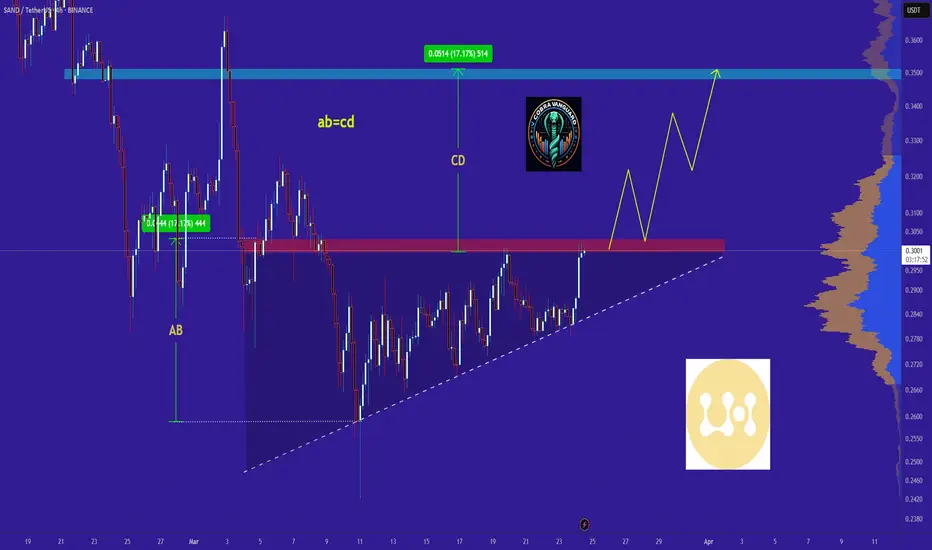
SAND in coming days ...Currently, SAND is forming an ascending triangle, indicating a potential price increase. It is anticipated that the price could rise, aligning with the projected price movement (AB=CD).
However, it is crucial to wait for the triangle to break before taking any action.
Give me some energy !!
✨We spend hours finding potential opportunities and writing useful ideas, we would be happy if you support us.
Best regards CobraVanguard.💚
_ _ _ _ __ _ _ _ _ _ _ _ _ _ _ _ _ _ _ _ _ _ _ _ _ _ _ _ _ _ _ _
✅Thank you, and for more ideas, hit ❤️Like❤️ and 🌟Follow🌟!
⚠️Things can change...
The markets are always changing and even with all these signals, the market changes tend to be strong and fast!!
$SAND Sandbox Over 70% Retracement... Ready for Higher?NYSE:SAND Sandbox has committed a over 70% retracement after superbuy signal from a height of approximately $1
Current Price: $0.36
Price action is forming a Falling Wedge and Bullish Divergences Spotted also
Expecting a retest of previous supports - now resistances at 0.41, 0.54, 0.7, 0.82, 0.96
#sand Invalidation is at under 0.3
