SANDUSDT analysis buying signal crypto Market is on the way to our wcl Orange area after formation of III (Impulsive sequence) with RR:2.8:1
Sandusdt
SAND GO TO HELLI think we will continue to move downwards. The red box is the right place to open short trades
SAND⚡⚡ #SAND/USDT ⚡⚡
Exchanges: Binance Futures
Signal Type: Regular (Long)
Leverage: Cross (20X)
Entry Zone:
1) 7875
2) 7700
3) 7537
Take-Profit Targets:
1) 8018
2) 8255
3) 8345
4) 8509
Stop Targets:
1) 7279
Trailing Configuration:
Entry: Percentage (0.5%)
Take-Profit: Percentage (0.5%)
Stop: Moving Target -
Trigger: Target (1)

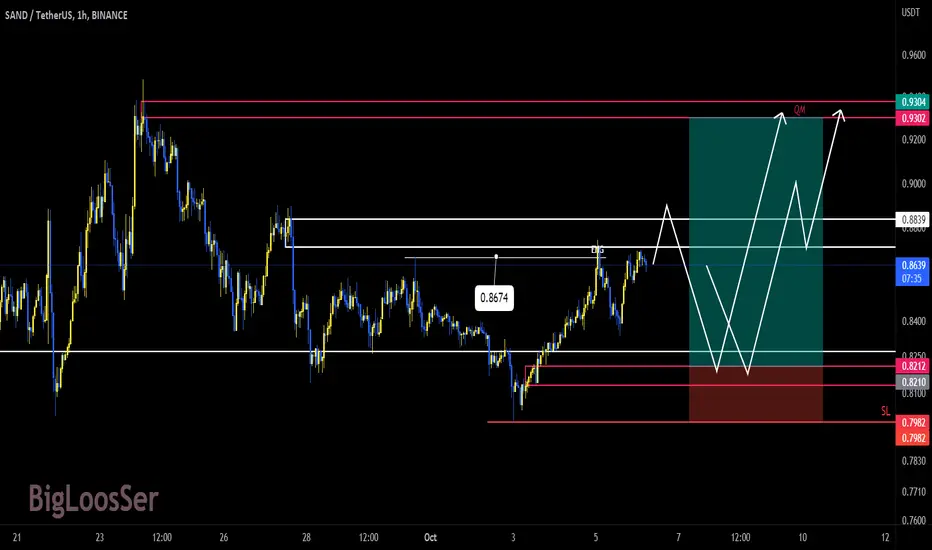
SANDUSDTHello friends
Considering that the current trend is not above the range of $0.8839, the possibility of continuing the upward trend from this range is weak.
There are two situations, or an increasing trend is formed from this range and the white area ($0.8839) is completely consumed.
Or from this price range, a corrective trend can be formed up to the area of $0.8212.
If the first mode is implemented, that is, the range of $0.8839 is consumed in the same movement, the validity of the area of $0.8212 will increase.
In the upward trend, the range of $0.8674 has been completely consumed, as a result, the pink area is valid and the probability of reaction to this range is high.
What do you think?
SAND risky Short "Falling Knife"Looks like falling Knife pattern.
Second part of the knife is not open yet.
Very tight Stop Loss above horizontal support on 15M
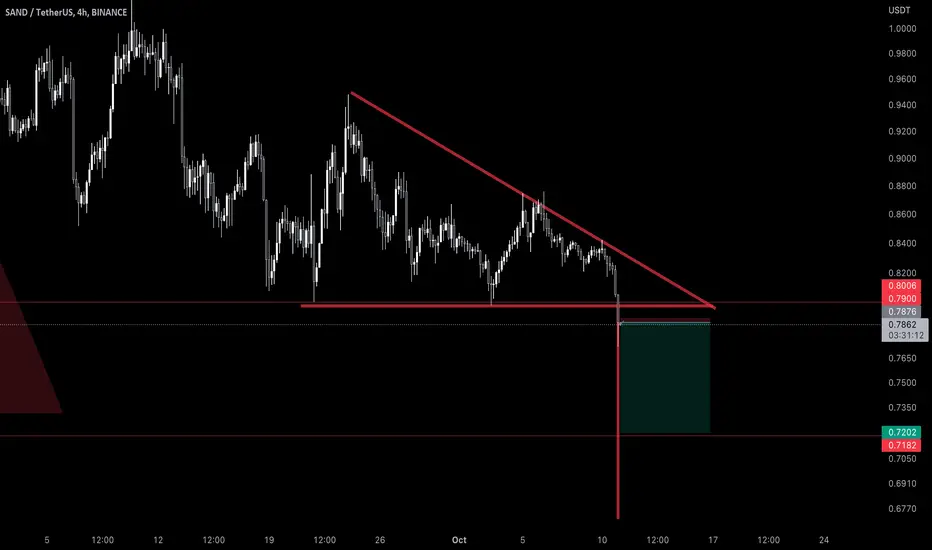
on 4H solid break out from Triangle
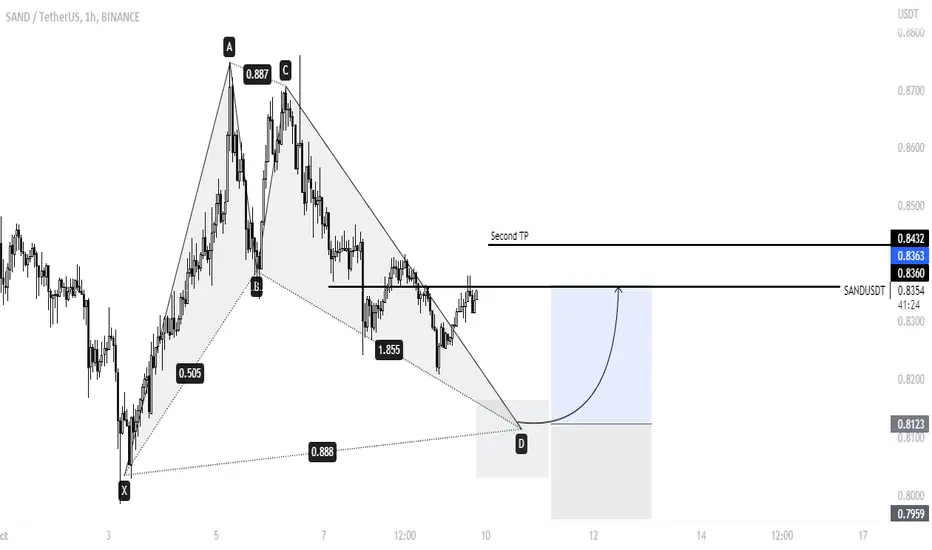
SAND/USDT#SAND/USDT #LONG #Scalp
I'm waiting for when sand will hit the demand zone.
Entry: 0.8117
TP: 0.8360
tp 2 0.8432
MANA is ready to move !10.9.2022MANA broke the triangle and retested the trendline. You can add more to the long position here with a tight stop loss below the $0.67 area. The resistance is $0.71 area and $0.75 area.
This Analysis will be update

SANDBOX : Day trade (LONG)SANDBOX: Day trade (LONG)
Some trends show some increased trends coming time for SAND
Its very hard to find the right coins in a moment where most coins don't move really, and same time we are in a time where the take profits are faster than before. but trends change with time
If there is real breakout trends or high increase, for 90% we will find them with our trading algorithmic including volume study
We use 10% of work depending on algorithmic the rest studies.
When we add coins it means not it will increase: but the coins that we add have the most chance at that moment to change or in the short term.
SANDUSDTHello Crypto Lovers,
Mars Signals team wishes you high profits.
This is a one-day-time frame analysis for SANDUSDT
There are R2 and R1 as the resistance areas which contain the disability of the price in order to rise. And S1 and S2 are the support areas that express the price is well supported in them. Presently, we have the fluctuation of price over S1 and we predict a rise will happen to it to reach R1. Then here we should wait for some falling signs and our expectation would be a fall toward S1. In case the price moves above R1 and fixes there, more rise is predicted for it. Note that consider the confirmation candles for having good logical trades.
Warning: This is just a suggestion and we do not guarantee profits. We advise you to analyze the chart before opening any positions.
Wish you luck

SANDBOX -Out of the Sand and back in the Sun 🌞SANDBOX sitting over 2 support levels at 0.814 and 0.780
October is On and it is usually one of the best months.
Let's see if the market can rebound or at least offer us a relief rally.
At the same time, watch out for the FEDS meeting tonight.
One Love,
The FXPROFESSOR

Sandbox SAND Bear Market RallyFriday the S&P hit a new 52 week low, being oversold right now.
I expect a bounce in the stock market next week, which will determine a bear market rally in the crypto space too!
Hedera HBAR is one of the cryptocurrencies that have a lot of potential for a bull run.
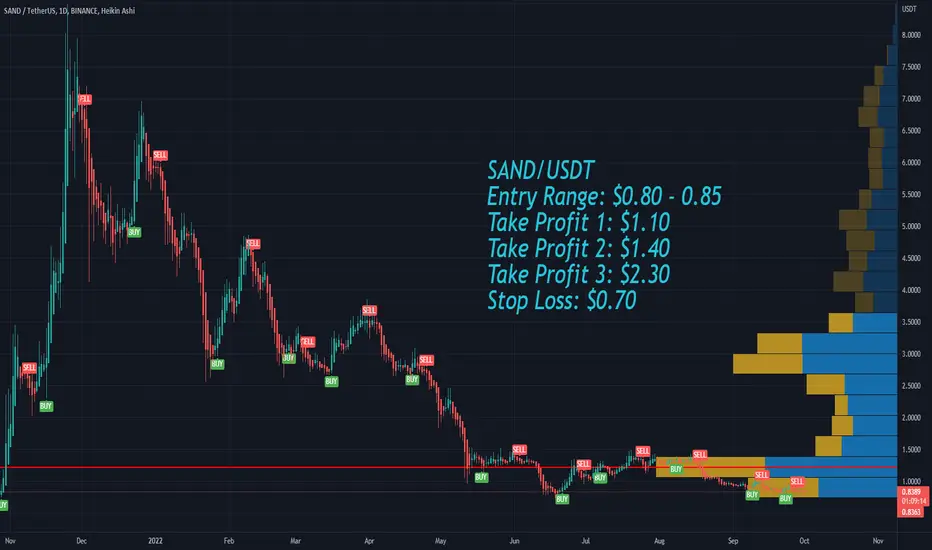
SAND/USDT
Entry Range: $0.80 - 0.85
Take Profit 1: $1.10
Take Profit 2: $1.40
Take Profit 3: $2.30
Stop Loss: $0.70
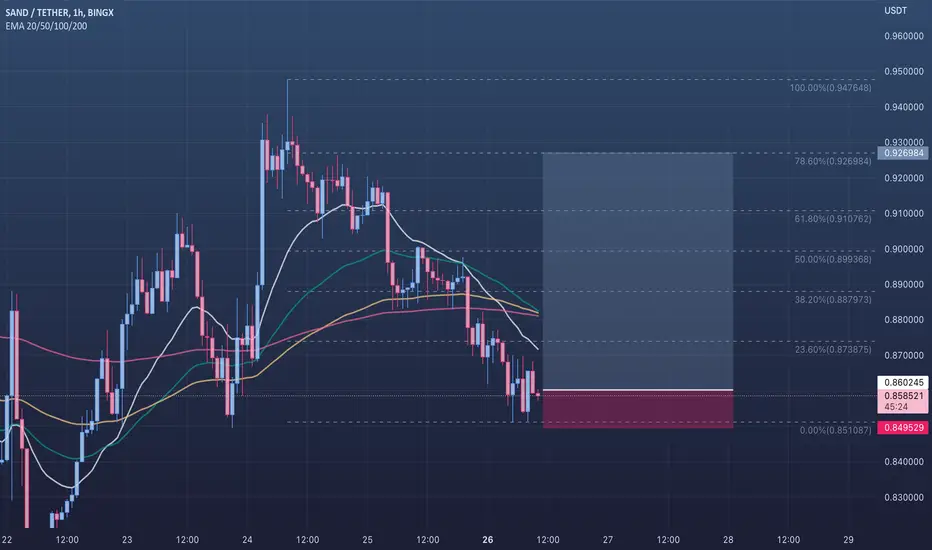
🟢 SANDUSDT - 1H (26.09.2022)🟢 SANDUSDT
TF: 1H
Side: Long
SL: $0.849529
Leverage: 5x
TP 1: $0.873875
TP 2: $0.887973
TP 3: $0.899368
SAND: market overview for September 27The resistance level was broken on the Daily timeframe on September 23, the trend is bullish. The correction may come to an end today and the pullback buying opportunity can be formed.
The first target in the upward movement is the resistance level formed on September 23 – 25 with the borders of $0.919 – $0.94.
In case of successful development of the trend, a more distant target will be on the highs of September 9 – 12, where the next resistance is located with the borders of $0.9875 – $1.0250.
When breaking through the support, the trend will reverse and we should look for selling opportunities. The borders of this level are $0.8015 – $0.8150.
Longs will remain relevant until the market is above the nearest support level on the Daily chart, the lows of September 20 – 22.

$SANDUSDT UPDATE!!!Hi Snipers,
Please refer to the recording for the next price levels and scenarios.
Thanks
MS

SAND/BTC 1DSAND/BTC respected the channel going up to the bottom edge and returning. it will face the resistances of 0.00004566 and 0.00004932 and reach its target. For now the selling force still dominates, but soon it will lose strength.

0.4$ target 95% will be the first target for sand box (0.4$)
Second 0.2$ it may not reach depends on btc move
GOOD LUCK

The Sandbox (SAND) 19 Sept 2022SAND may hit above $2 by mid 2023, it is currently in our accumulation zone

SAND/USDT Elliott Wave count 45min TFSAND may move to the upside with a Head and Shoulders pattern.
Wait for a clear breakout at 0.8984 to entry long with take profit at next resistance if this upisde move is a corrective pattern WXY.
It also may move more to the upside if this is an 12 12.
Good luck!

SANDUSDT - Ready to continue it's downside 📉SANDUSDT looks prepped to retest 0.86/0.85 and then potentially continue its fall from there towards target zones of 0.75.

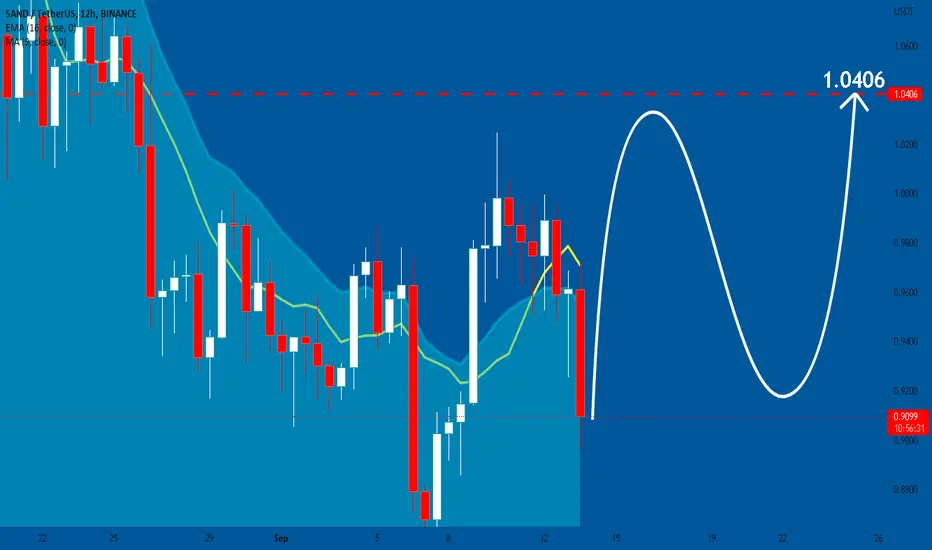
SANDUSDT: Growth & Bullish Continuation
Here is our technical view for SANDUSDT.
SANDUSDT is trading within a support cluster .
Based on our view the SANDUSDT will rise to the next structure resistance.
❤️ Please, support our work with like & comment! ❤️
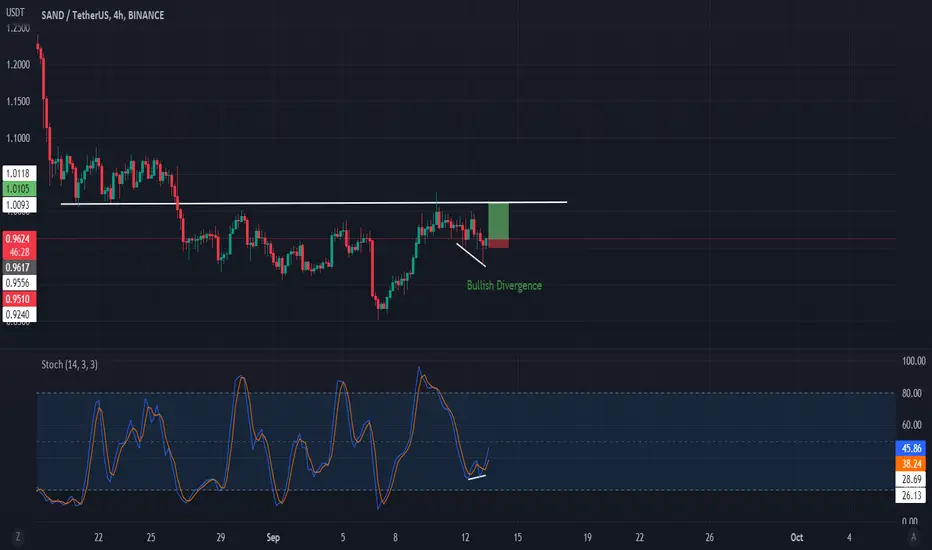
SAND/USDTBullish Divergence Spotted on Sand on Stochastic.
We have good confluence with the DXY moving down also.
Entry on 15 minute time frame stop loss below last low.
1:4.6 RR
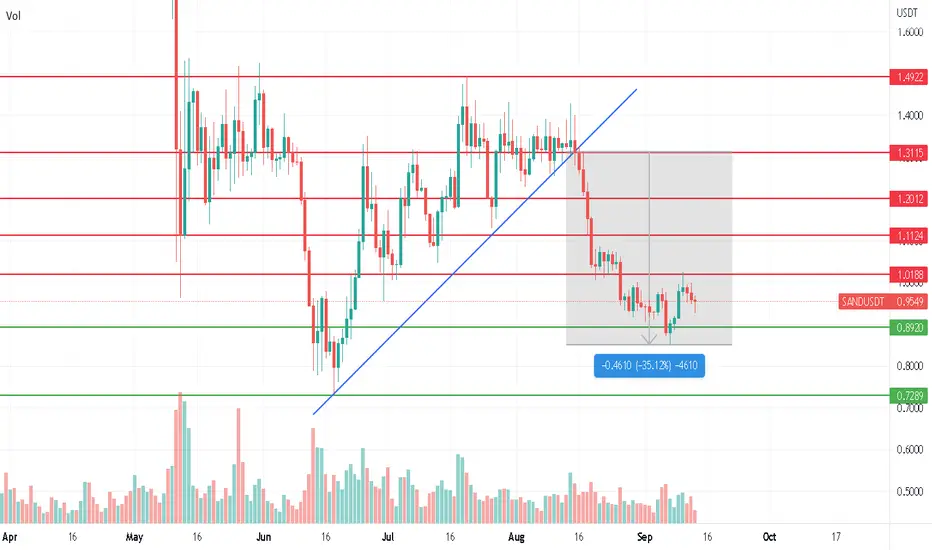
SANDUSDT LEVELS TO WATCH CURRENTLY.SANDUSDT LEVELS TO WATCH CURRENTLY.
After a nice recovery last month, since sand broke below this blue trendline and confirmed it as a resistance. It has retraced around 35% & now holding support of 0.89 cents.
The nearest resistance is around 1.02 area.
green horizontal lines - Support
red horizontal lines - resistance.