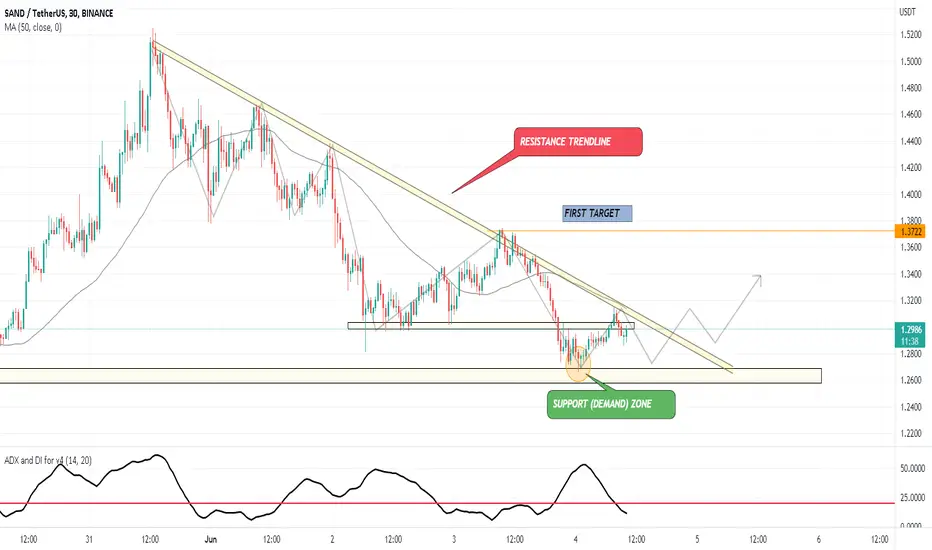
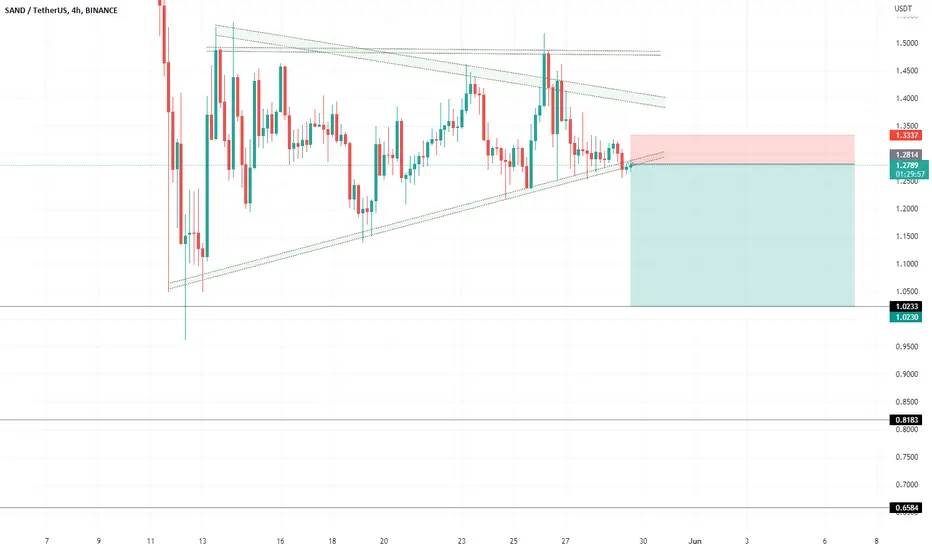
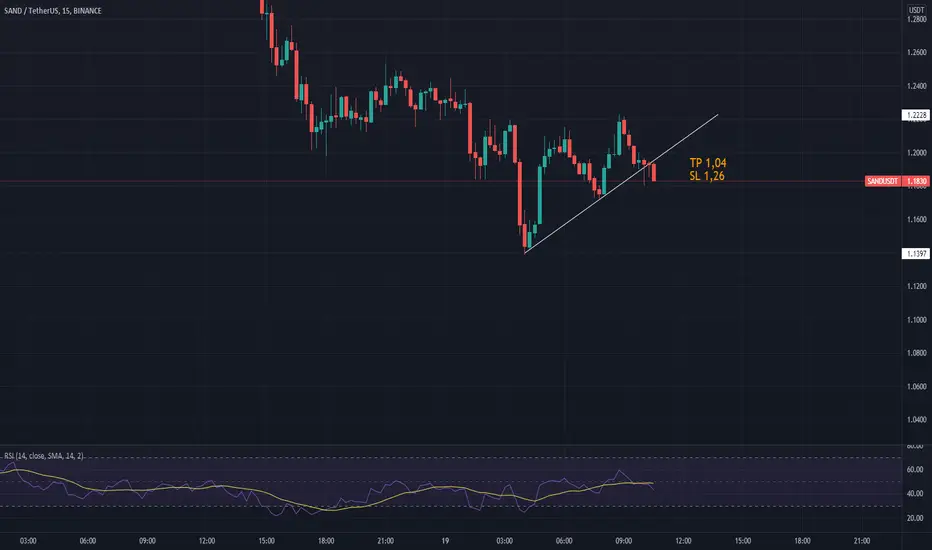
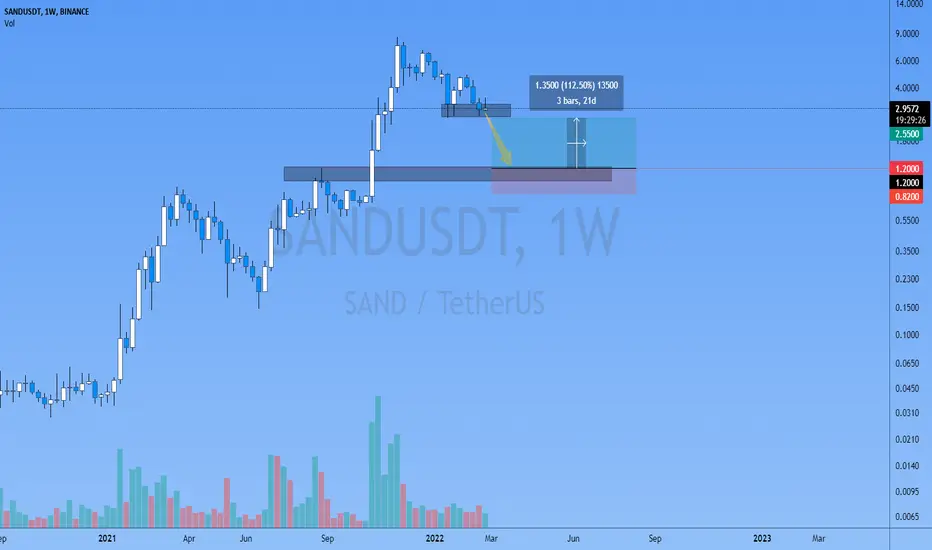
SAND DESCENDING TRIANGLE PATTERNSAND BINANCE:SANDUSDT is forming a Descenidng Triangle pattern....
I know that in Technical terms, it is mostly regarded as a sign of bearish pattern.... But sometimes it can be powerfully Bullish too!!
I think it might fool sellers when it make a pullback near Demand zone and might continue back to the 1st Target area...
If you can relate.... then please like and ask any comment you guyzz have!! (:
Sandusdt
Trading opportunity for SANDUSDTBased on technical factors there is a short position in :
📊 SANDUSDT
🔴 Short Now 1.2824
🧯 Stop loss 1.5400
🏹 Target 1 1.1100
🏹 Target 2 0.9000
🏹 Target 3 0.5700
💸Capital : 1%
We hope it is profitable for you ❤️
Please support our activity with your likes👍 and comments📝

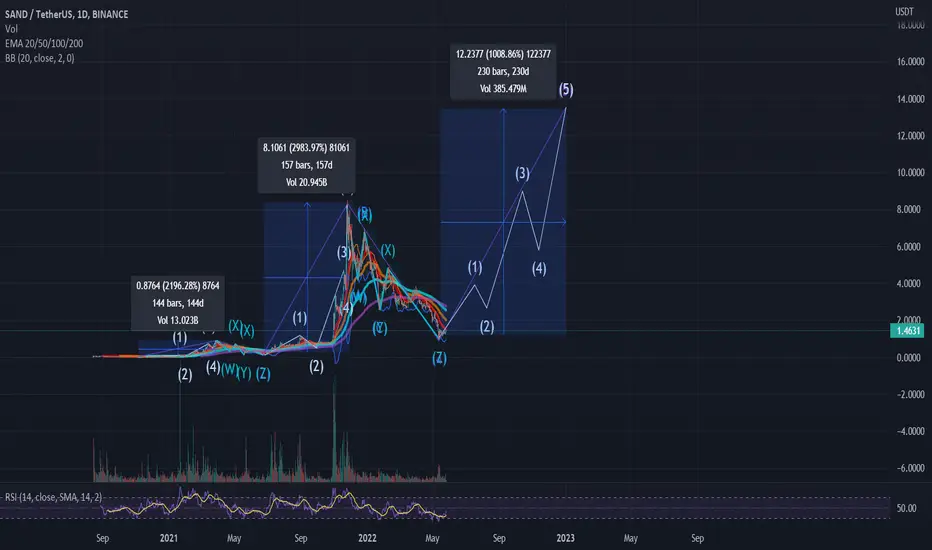
sand/usdtTesting/tracking elliot wave theory. Please do not trade off idea without S/L. Not financial advice.
With the recent events on cryptocurrency; I think we will start seeing less coins getting pumped and more of the solid coins getting attention. By solid, I mean coins that actually has a project and some kind of revenue coming in. Currently a lot of coins are back to prices of last year, if not, then lower. This makes it a great entry point for those that wanted to get in a few months ago, but thought prices were too high. Sand's (4th) wave count has retraced to the peak of wave (1) and bounced nicely. This is usually a good indication that the bottom is in. We don't normally enter wave 1 territory unless btc does something drastic. The market sentiment is still uncertain and people are fearful, which makes it a perfect opportunity for institutional investors to start investing.
#SAND/USDT TRADE SETUP Hi guys, This is CryptoMojo, One of the most active trading view authors and fastest-growing communities.
Do consider following me for the latest updates and Long /Short calls on almost every exchange.
I post short mid and long-term trade setups too.
Let’s get to the chart!
SAND also looks bullish here. Long some here and add more up to $1.44
Remember to get in partially don't buy at once. It's important to keep your entry as low as possible. The best way is to buy in parts which will eventually average your entries.
Target:- 20% to 30%
SL:- $1.38
Lev:- 10x
This chart is likely to help you in making better trade decisions, if it did do consider upvoting this chart.
Would also love to know your charts and views in the comment section.
Thank you

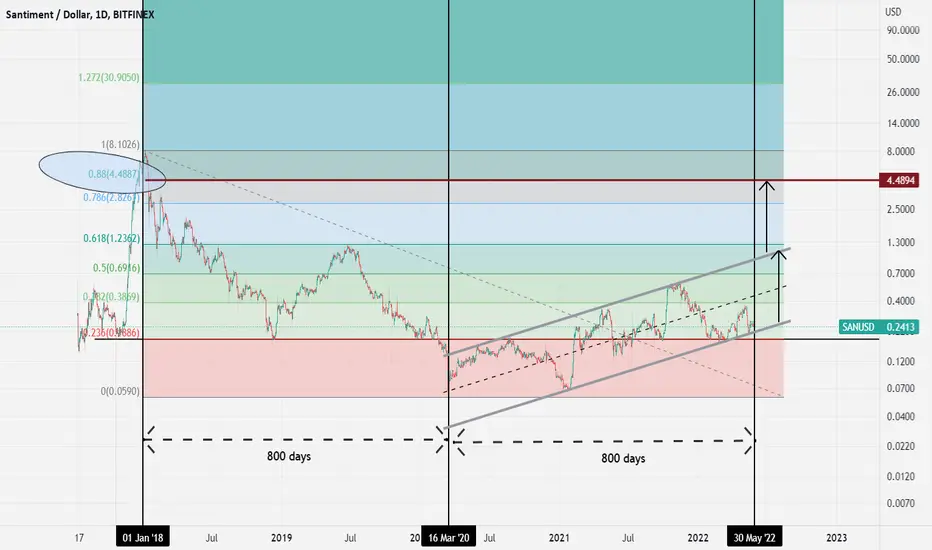
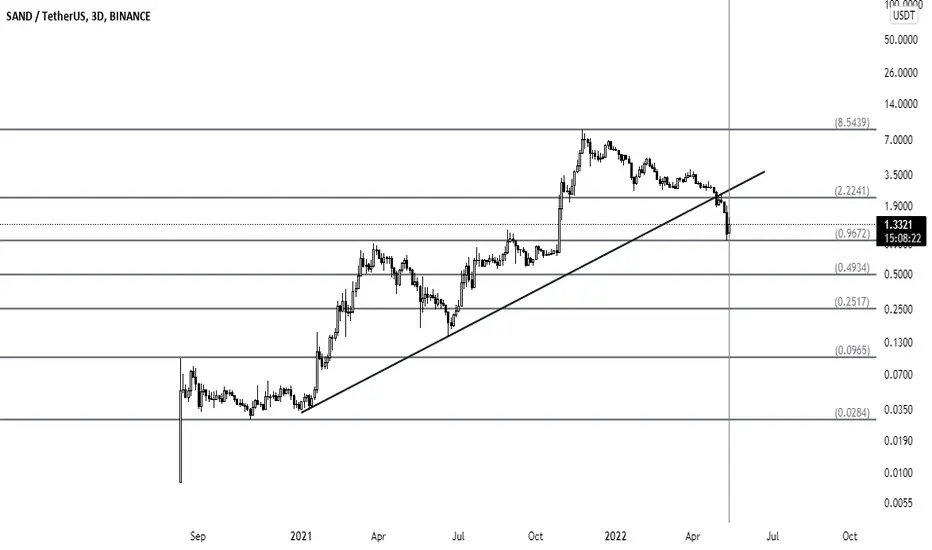
SAN has a clear bullish case to look atWe have spent 800 days from the top to the bottom and then we are almost at the 800 days after the bottom. It seems we are testing for the third time the lower part of the ascending channel as seen on the chart.
If we take the equidistance of the channel, the target price is around 4.5usd per SAN. There is a confluence at this level with the 0.88 fib level.
Personally I expect SAN to go way higher in the next few years but 4.5 usd will be my first target to sell some of it.
Don't forget to follow if you like the content.
SandUsdt Following the trend its look like there is a breakout in Sand, Following Simple Price Action with SL and target.
Keeping it simple in messy time
SANDUSD Buy Above Downtrend LineThis chart shows periods of sharp growth followed by a down period
So far the pattern has repeated twice
A third up move is up coming next if the pattern repeats again
This will most likely occur once price breaks the orange downtrend line
Price once upward break out will most likely reclaim the weak yellow uptrend
Weekly Chart
SANDUSDT: Bearish Symmetrical Triangle, Going to Under 1 USDT?Hello Fellow Sandbox Investor/Trader, Here's a Technical outlook of SANDUSDT!
Support our content by smashing the like and follow button, you also can share your opinion on the comment section below.
SANDUSDT has broken out of the symmetrical triangle pattern. The breakout accompanies by increasing volume which indicates a potential bearish bias ahead. Furthermore, The MACD indicator created a death cross, which confirmed a potential downside momentum to the target area.
The roadmap will be invalid after reaching the target/ resistance area.
"Disclaimer: The outlook is only for educational purposes, not a recommendation to buy or sell the cryptocurrency"

SANDUSDTWOW!
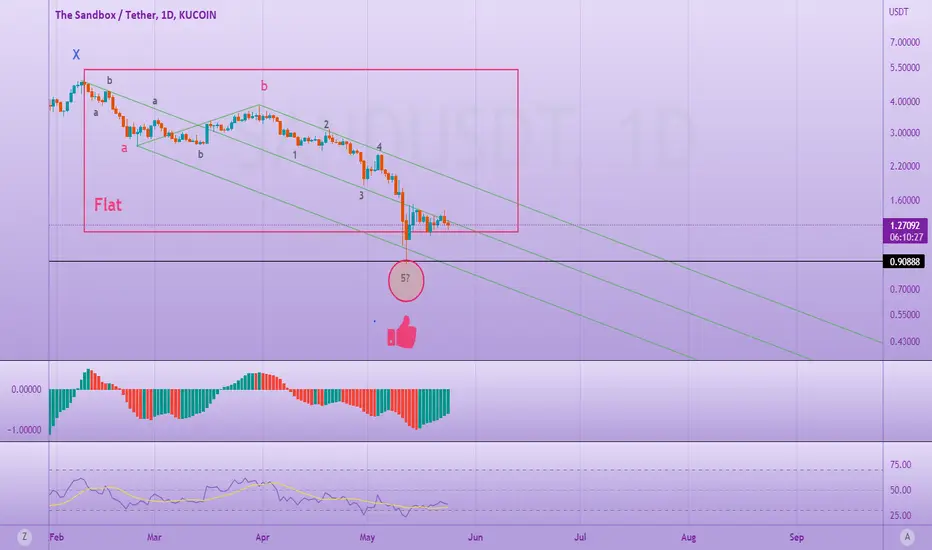
sandusdt/D1
GREAT reaction on pitchfork where I was shown that there must be the end of the wave 5 .
this wave 5 is the end of the wave c of flat pattern.
the last analyze of sandusdt is on my profile you can see it ]:
[ALTCOIN] SANDUSDT CRYPTO SIGNALS TREND LINE ANALYSISHello, everyone
We're a team that specializes in chart analysis
We will always analyze and provide you with charts to help you sell
There are so many trading laws and there are so many good technologies that come with them, but I'm confident that the trend line is really strong.
If you read the point of view and get to know the line, every line will adjust
Thank you.
------------------------------------------------------------------------------------------------
Chart Analysis Content -
The rebound came from the thick white upward trend, and like PEOPLEUSDT, the candle is rising after checking the bottom once more.
It will break through the downward trend of bold red and cross the downward trend of bold yellow after crossing the downward trend of bold yellow.
And if we go up to the upward trend of thick sky blue, we can go up to the position we expect.
The most important point is to test it after breaking through the thick red downward trend line and what kind of movement it shows.

SAND/USDT Technical Analysis overview#SAND Chart Analysis:-
- $SAND trying to bounce from support because now holding $1 support levle.
- If hold $1 Support then we can see $2.10 ( 100% Move from here
- Below $1 is super bearish and expect to Test $0.5 and $0.2 ( we can expect more then -50% dump below $1
- Placed Stop Loss after opening any trade because Market is very volatile.
thnak you

SANDBOXSAND/USDT i saw performing BULLISH penant chart i will take LONG position around 1.55 - 1.60 i close this Position

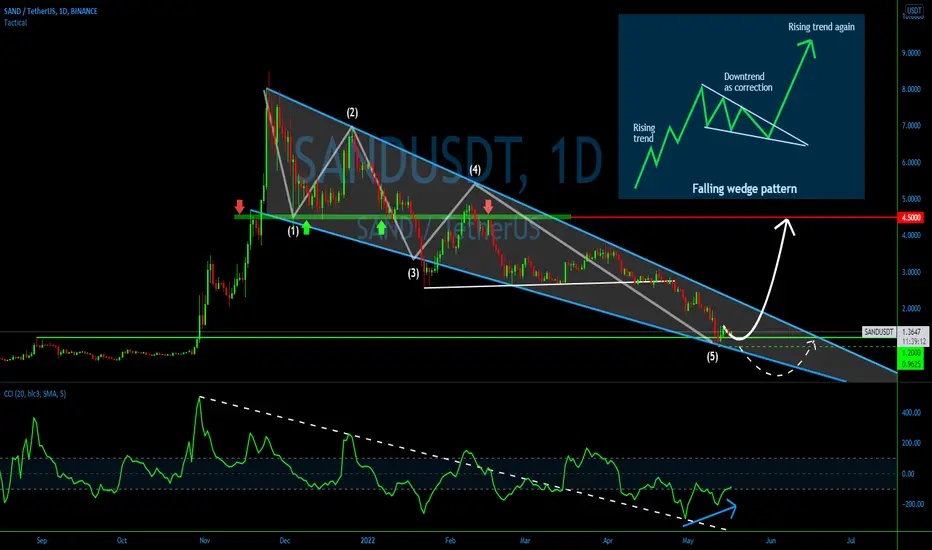
[ALTCOIN]SANDUSDT FALLING WEDGEHello, everyone
We're a team that specializes in chart analysis
We will always analyze and provide you with charts to help you sell
There are so many trading laws and there are so many good technologies that come with them, but I'm confident that the trend line is really strong.
If you read the point of view and get to know the line, every line will adjust
Thank you.
------------------------------------------------------------------------------------------------
Chart Analysis Content -
#SANDUSDT FALLING WEDGE
It's a coin that our team is keeping a close eye on in the market now.
It has not gone down to a place that should never be broken, and the angle is low, but it is one of the few coins that still has an upward trend.
It is forming a downward wedge based on the 4h and I think it is almost at the end.
So I'm thinking about the painting that I'm raising, and first of all, I have to put it up through the resistance at the top of the most important wedge.

SAND - QUICK ONEHey Guys, have to be quick. SAND short! See the chart!
BE CAREFU | NO FINANVIAL ADVICE | DYOR | HAPPY TRADING
SANDUSDT think this zone is good to enter for short positions
we also shared it as a VIP signal in our channel

SAND - Falling Wedge bullish pattern?💎Throughout this year SAND has been trending down, but perhaps this was only a corrective pattern of a major bullish trend?
💎The pattern, started back in November 2021, is identical to a Falling Wedge pattern, which most of is bullish. Wave five could be ending any time, and once completed, we are likely to see a price rally. Still, Paradise Team is waiting for a few more confirmations .................
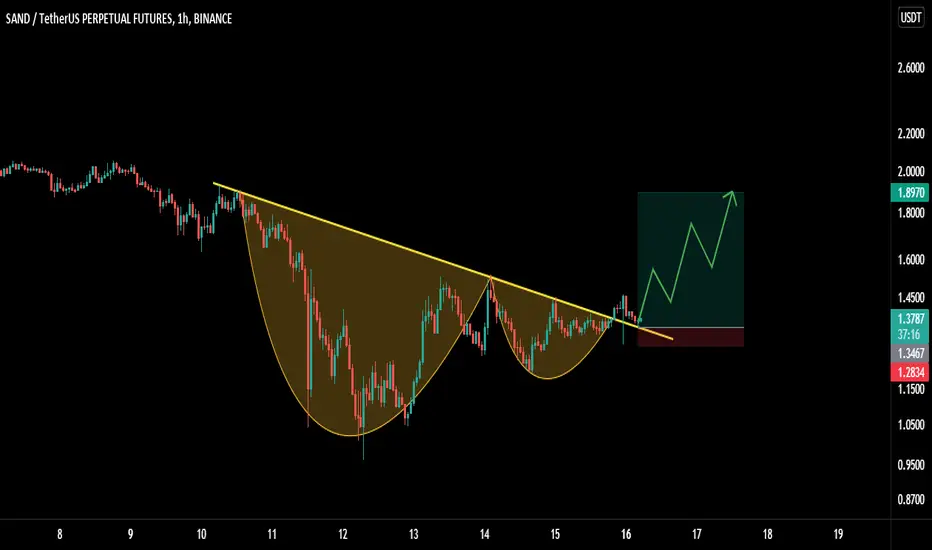
SAND/USDT LONG SCALP SETUP!Hello everyone, if you like the idea, do not forget to support with a like and follow.
Welcome to this SAND/USDT TRADE setup. SAND looks good here.
SAND is breaking out from the cup and handle pattern in 1hr time frame. After the breakout retest is also done. Long some now and add more in the dip.
Entry range:- $1.34-$1.38
Target1:- $1.46
Target2:- $1.58
Target3:- $1.76
Target4:- $1.90
SL:- $1.28
Use low leverage (4x-6x)
If you like this idea then do support it with like and follow.
Also, share your views in the comment section.
Thank You!
SANDUSDT◻️SAND has broken an uptrend that lasted almost two years.
◻️If you take it apart from the technical side: I would not consider this asset now, after the trend breaks.
🔥Subscribe to my Tradingview profile
Short Sand (Lower High Lower Low)safe trade with this pattern (my entry price=1.42), target 1.13
happy profit guys

Sand will go 1.20$It makes perfect sense. what do you think?
Follow for more Ideas❤️
Like 👍🏻 & Comment 💬
SHORT TERM TRADE IDEA FOR SAND/USDTTrade is based on the daily time frame and bullish divergence formed, Use a stop loss
Entry is based on the rising wedge pattern/ channel formed on the 3 min chart as shown below;
Target is horizontal or channel resistance
Apply proper risk management!
