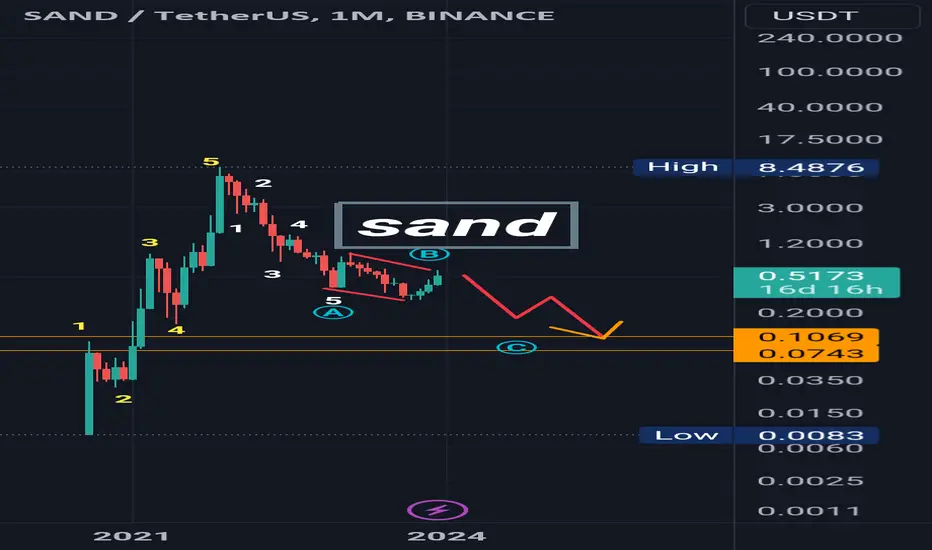
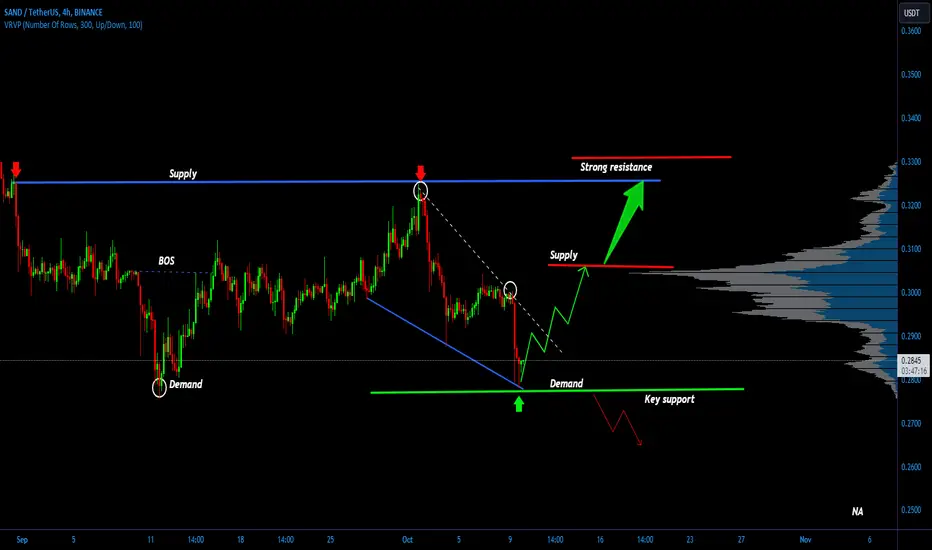
sandusdtFrom the apparent and new data, the price is currently forming a corrective flat action only, not a new real rise, and that the decline is continuing again for another support area that will be stronger, and all the data has been clarified on the chart.
Note: I am only sharing my point of view and what I see, and it may be wrong or right, so make your own analysis
Good luck
Sandusdt
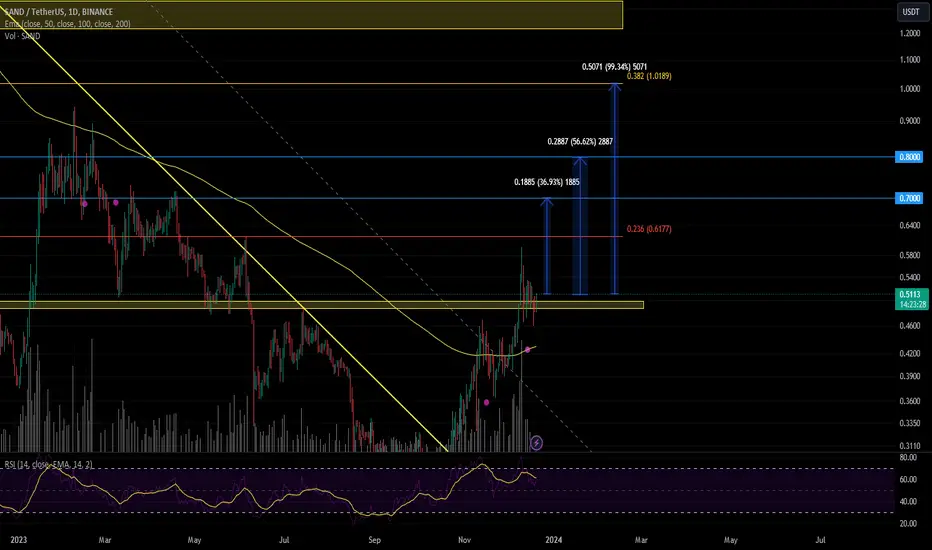
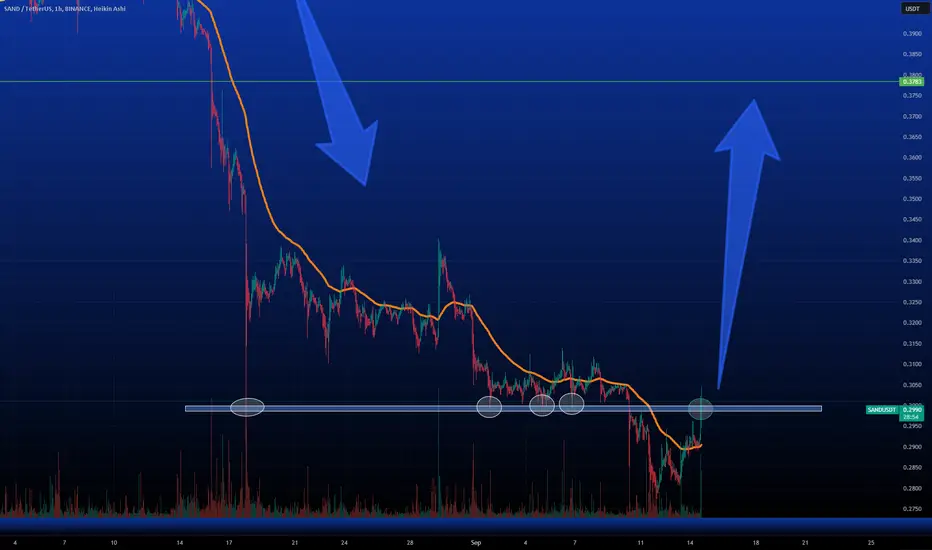
I expect SAND to move towards the 0.382 Fibonacci level.Hello everyone!
I suggest considering entering positions based on the current values on Sandbox.
Recently, the asset managed to break and sustain above the 200-day moving average EMA, and then break the global resistance level in the ~$0.49 range.
The following targets are in place:
$0.7 - +36%
$0.8 - +56%
$1.01 - +99%
Please note that this is not financial advice, and any actions you take are at your own risk!
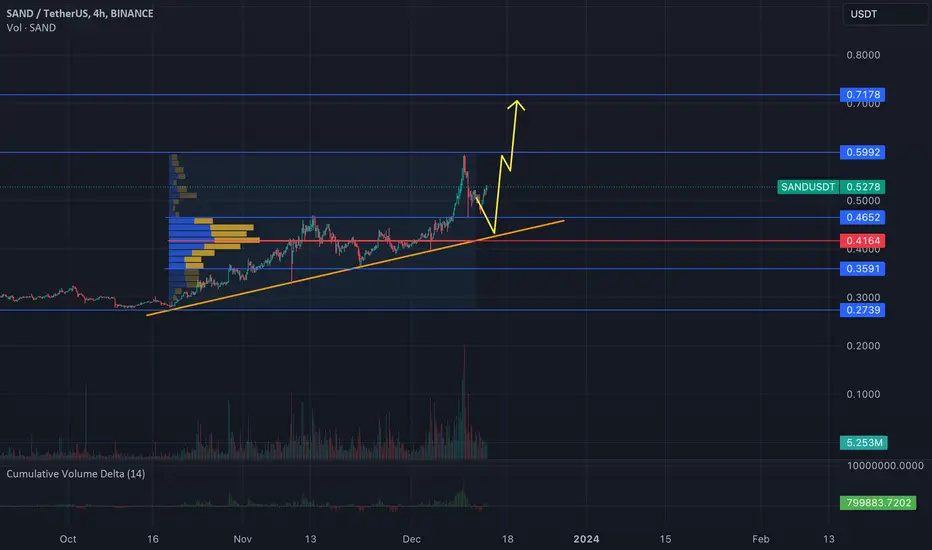
SAND/USDT Trading IdeaBelow is a trading idea for the SAND/USDT pair.
Since the beginning of October, this asset has shown a consistent upward trend. Starting at $0.2739 and reaching a current high of $0.5970 , it has grown by more than 114% . The trend line, acting as support, confirms continued interest from buyers in this coin, having held up through three significant approaches. Currently, the asset is undergoing a correction after hitting a local price peak.
The idea is to consider buying the asset if the price drops below the Value Area High and approaches the level close to the support trend line.
The trend's stability is confirmed by the continuation of the upward movement after the correction from the local peak, accompanied by noticeable increases in trading volumes. After entering a position, the first target is considered to be $0.5992, with the second target at $0.7178.
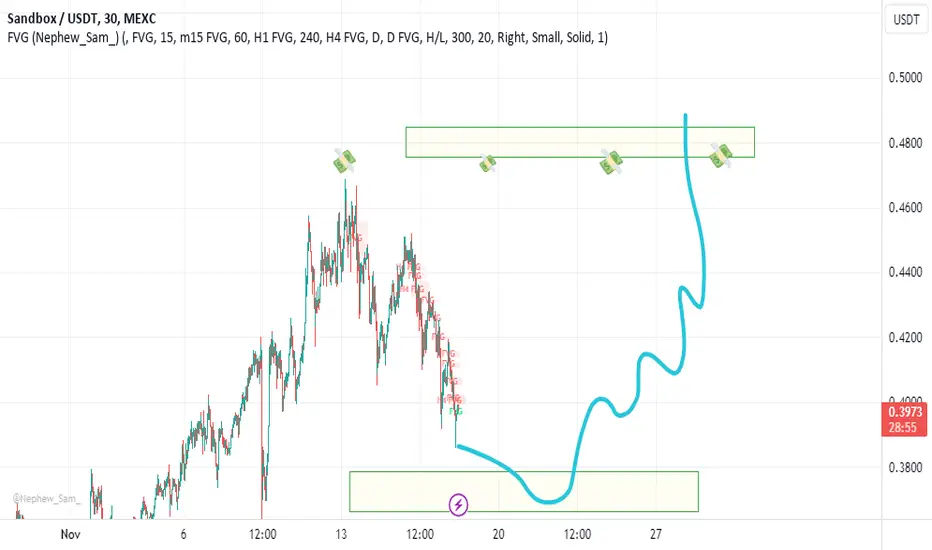
#SANDIn 30 minutes, it is moving in an upward channel, which can continue its growth by maintaining the green range until the next supply areas.

Sandbox (SAND): Metaverse with Biggie's LegacyDec 9
Hello Virtual World Explorers!
👋 The FXProfessor here, bringing you the latest buzz from Sandbox (SAND), an Ethereum-based metaverse game making waves with its innovative collaborations.
The Notorious B.I.G. Experience in The Sandbox:
🎤 A tribute to the legendary rapper, Notorious B.I.G., is now live in The Sandbox. This collaboration brings a unique Brooklyn, New York-inspired area to the metaverse.
🕹️ Dubbed “Breakin’ B.I.G.,” this experience allows players to interact with Biggie’s avatar in a 2D, arcade-style world, engaging in quests that reflect the rapper's iconic legacy.
New NFT Avatar Collection:
🖼️ Alongside the B.I.G. experience, Sandbox is set to release a new NFT avatar collection, further bridging the gap between the crypto world and popular culture.
🌉 This update marks a significant expansion of Warner Music Group’s social hub within the game, offering a rich, interactive Brooklyn environment for players.
Sandbox's Metaverse Vision:
🚀 The Sandbox continues to push the boundaries of what's possible in virtual worlds, integrating elements of music, culture, and gaming.
🌐 These collaborations exemplify how blockchain technology can merge with entertainment, creating immersive experiences that redefine user interaction in the digital realm.
My personal Take:
🌟 Sandbox's ability to blend iconic cultural elements with cutting-edge blockchain technology showcases its potential as a leader in the metaverse sector.
💭 Imagine the possibilities as we witness more such innovative collaborations in the metaverse, transforming how we interact, play, and commemorate legends.
Stay curious, dive into the metaverse, and let's explore the endless possibilities that Sandbox (SAND) has to offer!
One Love,
The FXProfessor 💙
Link: decrypt.co
#SAND/USDT#SAND
The price has broken out of the large descending triangle since last March
The trend was retested and returned upward, supported by the rise of Bitcoin
Looking at the previous triangle patterns, each breakout is strongly bullish
We expect a strong rise after breaching the current triangle
With an initial goal of 170%
After that, we expect a second goal of 250%.
All of this is due to the rise of Bitcoin to reach strong areas soon

SAND/USDT Break out the Bullish pattern. Ready to continue UP ??💎 SAND is currently in the spotlight within the market, achieving a breakout from a bullish flag pattern. It is now approaching a local resistance point at $0.425. Should SAND successfully break through this resistance, it could pave the way for a continued ascent towards a stronger resistance area.
💎 However, if SAND struggles to surpass this resistance, it may face a downturn, leading to a retesting phase at the demand zone between $0.4 and $0.41.
💎 In this demand area, it's crucial for SAND to exhibit a strong bounce. Failure to do so could result in the loss of this zone. If such a scenario unfolds, SAND could then be heading towards a test at the support level around $0.357.
💎 A particularly concerning situation would arise if SAND also breaks down from this support level, which could lead to a continued downward trajectory towards a more substantial demand area.

SAND/USDT Had a Good Run | 👀🚀What's Next for the SAND?💎 Paradisers, turn your attention to SANDUSDT, which is currently showing a promising setup in the demand zone, enhanced by a recent Market Structure Shift (MSS). This configuration indicates a considerable potential for a bullish trend.
💎 In examining SAND's pattern, Sandbox has a notable track record of breaking above its descending trendline, a clear signal of bullish trends. Presently, it's confronting a significant Bearish Order Block (OB) challenge, with ongoing momentum above the EMA100, aiming for supply targets at $0.61 and $0.70.
💎 Given the ever-changing nature of the crypto market, SAND traders should be ready to adapt to different scenarios. Should the anticipated bullish breakout not materialize, shifting to a rebound strategy from the support level at $0.38 will become crucial.
💎 If SAND falls below this support level, a change in strategy will be imperative, signaling the need to rethink the bullish perspective and adjust trading strategies to align with the new market conditions.
💎 Stay alert and tactically prepared, Paradisers. Your ParadiseTeam is dedicated to providing you with insightful analysis and guidance, ensuring you make well-informed trading decisions in these dynamic market scenarios.

MANA Suggests SAND will Push HigherComparing these charts suggests SAND will go higher to follow MANA. They both are following the exact price action, and MANA is currently retesting 200ema, whereas SAND is lagging behind.

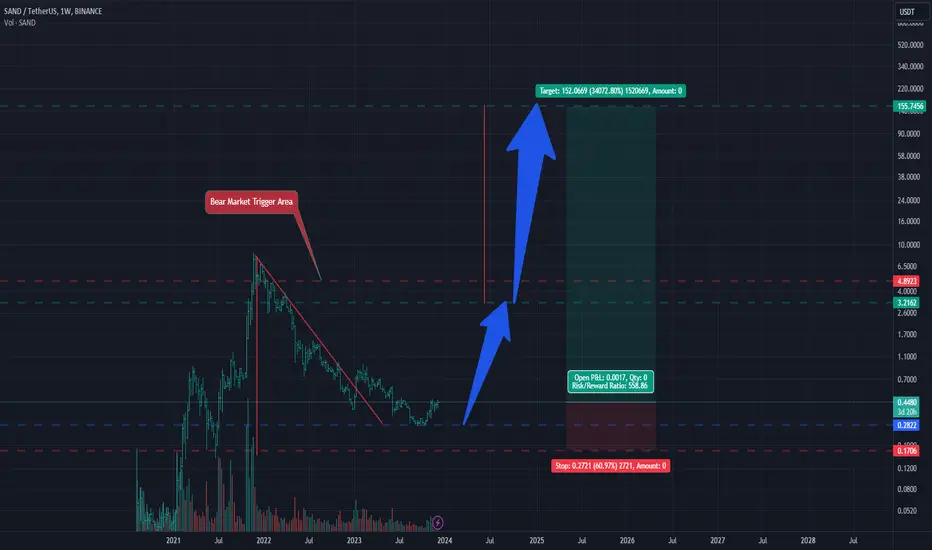
SAND showing a very impressive investment opportunityHi Everyone;
today we have one of the best risk to reward Investment opportunity
it is more than 550 times the risk and the chart is look very promising.
I expect breaking the previous bear market key point will clear the way to the final target
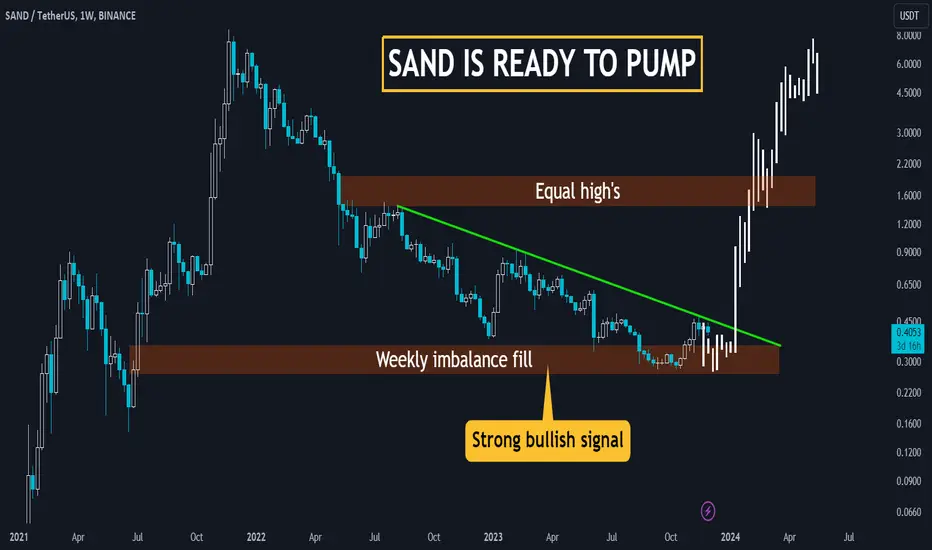
🏖️ SAND's Bullish : Descending Wedge BreakoutThe crypto seas are witnessing the rise of Sandbox's native token, SAND, as it navigates a bullish pattern amidst market dynamics. In this exploration, we dive into SAND's chart, unveiling a compelling narrative of a descending wedge and a strategic reaction to a weekly imbalance.
Chart Analysis: The SAND Dunes Unveiled
SAND's recent price action has painted a fascinating picture on the charts, with the formation of a descending wedge—a classic bullish pattern signaling potential upward momentum.
Key Observations:
Descending Wedge Overview:
SAND's price movement has been confined within the walls of a descending wedge.
This pattern, characterized by lower highs and lower lows, often precedes a bullish breakout.
Strategic Response to Weekly Imbalance:
SAND has exhibited a noteworthy reaction to a weekly imbalance point.
Imbalance zones often act as catalysts for price reactions, serving as pivotal levels for traders.
Critical Levels: SAND's Journey to $1.6
Wedge Breakout and Liquid Pool at $1.6:
The breakout from the descending wedge is a crucial milestone for SAND.
The $1.6 level marks a significant zone where a liquidity pool has congregated.
Potential Scenarios: SAND's Expedition to $1.6 and Beyond
Wedge Breakout and Momentum Surge:
A confirmed breakout from the descending wedge could trigger a surge in bullish momentum.
Traders are keenly eyeing the $1.6 level for potential liquidity-driven movements.
Validation through Imbalance Response:
SAND's acknowledgment of the weekly imbalance further validates the bullish narrative.
A combination of technical patterns and strategic reactions enhances the confidence in potential upside movements.
Trading Strategy: Navigating the SAND Dunes
For traders considering SAND in their portfolio:
Wedge Breakout Confirmation: Wait for a clear breakout from the descending wedge before entering positions.
Targeting $1.6: Identify strategic entry and exit points around the $1.6 level, considering the liquidity pool dynamics.
Risk Management: Implement effective risk management strategies, given the inherent volatility in crypto markets.
Conclusion: SAND's Ascent and the $1.6 Oasis
As SAND charts its course within the bullish descending wedge, the $1.6 level emerges as a potential oasis—a liquidity-filled pool awaiting exploration. Traders and enthusiasts are watching closely as SAND seeks to transcend its current patterns and dance to the rhythm of a potential bullish symphony.
🏖️ SAND Analysis | 📉 Descending Wedge Breakout | 🎯 $1.6 Liquidity Oasis
❗See related ideas below❗
Have your grains of SAND ready for the bullish tide? Share your thoughts, analyses, and predictions in the comments, contributing to the collective wisdom of the crypto community. The journey through descending dunes brings forth the promise of upward momentum for SAND enthusiasts. 🚀🏝️💚
SAND is ready for a deep correctionAltcoins that have a large market cap indicate that a correction is coming soon.
The SAND chart also seems to have completed its diametric wave F and we will soon see a drop for wave G.
We have a very large liquidity pool on the lower left side, which we marked with an arrow. It seems that the goal is to hunt this pool and then change the trend.

SAND target 0.564h time frame
-
SAND is creating a potential bottom head and shoulders, the right shoulder hasn't been formed yet. Currently, 0.37 achieve the condition of HS, but shall notice another possibility that SAND go back to 0.35 to make the low of right shoulder.
I will provide another trading plan if SAND reach 0.35, and now we can follow this plan which targets as below.
TP: 0.56 / 0.66
SL: 0.381

#SAND Short Term Plan#SAND Short Term Plan.. #SAND is ready to clear upside liquidity / previous days high.

SAND/USDT It required Break to continue Upward movement !!💎 SAND has indeed caught the market's attention with its remarkable ascent. It is currently facing a challenge in breaking through the supply area at $0.4, and there are clear signs of bearish rejection in this area.
💎 If it fails to break through this resistance in the near future, there's a possibility that SAND could decline and retest the demand area around $0.339 to gather new momentum. However, if SAND successfully breaks the supply area, it opens the door for further upward movement and the probability to reach our target in the supply area.
💎 In the bad scenario, if SAND retraces to the demand area at $0.339 and doesn't show signs of a bounce, it suggests a potential breakdown of the demand level. If this occurs, it indicates a bearish momentum, and there's a possibility that SAND may continue its descent, possibly returning to the strong support area.

SAND/USDT Had a Good Run 🚀| What's Next for SAND?💎Yello, Paradisers! turn your focus to SAND/USDT. We've spotted some compelling price dynamics. A standout observation is the rejection from the bearish OB, shedding light on the asset's potential direction.
💎From our latest analysis, SAND has successfully broken away from a descending trendline, setting its sights upward. We're currently anticipating two possible scenarios:
💎The Sandbox might undergo a slight retracement, finding support and bullish drive from the demand level at 0.3386, with an aim to challenge the bearish OB once more.
💎If SAND faces challenges in holding its ground above the .3936 demand mark, it's likely to seek bullish support from the .3386 demand zone. Yet, if it drops below this level, bearish movements could be on the horizon.
💎Always stay alert and craft your strategies based on these potential outcomes. Refine your trading decisions for SAND with ParadiseFamilyVIP.

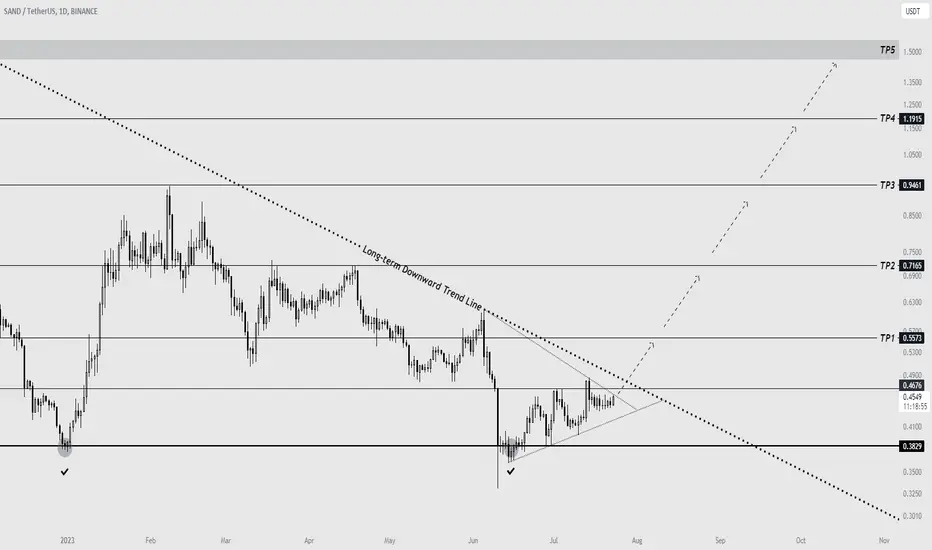
SANDBOX(SAND) - Double Bottom & TP
* 1D
SAND has a double bottom pattern.
It seems to be bullish.
Based on the above, TP can be set at 5 places.
Grab the SANDWe have a large diametric for SAND. To complete the F branch, we can go up. If it pull back to the green zone, it is a good opportunity to buy/long.
For risk management, please don't forget stop loss and capital management
Comment if you have any questions
Thank You

SANDUSDT Sell SignalThe bearish setup in the sand has already been confirmed. This position goes against the main trend, so caution is advised. Risk reward 1:5

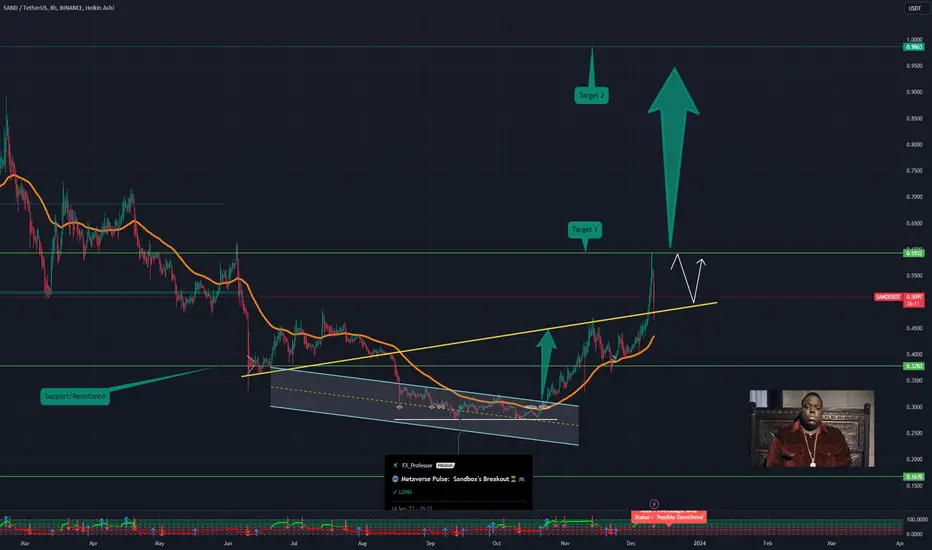
🌐 Metaverse Pulse: Sandbox's Breakout🏝️🎮🌐 Metaverse Pulse: 📈 AXIE Infinity's Rise, 🚀 Decentraland's Gains, and 🎮 Sandbox's Breakout—What Investors Need to Know 🤑"
"Hey folks, let's dive into the metaverse 🌌, with a special focus on Sandbox 🏝️. Today, AXE Infinity's AXS is up a solid 17% 📈, and Decentraland's Mana is gaining at 7.2% 🚀.
Sandbox is lagging a bit, but it's showing a promising breakout above 30 cents 💎, breaking past previous resistance. Binance delisted it, causing an all-time low 😬.
But there's also an explosive land update 🌋, which is huge news. So, should investors hold or fold? My bet's on hold 🤔.
Despite some hiccups (and heart attacks), like 99% of play-to-earn investors counting losses 😓, the metaverse is still a hot sector 🔥. Remember, Sandbox had a massive 300 million token unlock four weeks ago 🗝️.
So, keep an eye on Sandbox whales 🐳; they could turn the tide.
Bottom line: Sandbox is a standout project in the metaverse 🌟. I'm bullish on it 🐂. This is Professor, signing off and going Long on SANDBOX. My favorite Metaverse token. Peace ✌️."
One Love,
The FXPROFESSOR 💙
SAND/USDT bullish momentum ? 👀 🚀 Sand Today Analysis💎Paradisers, turn your attention to SANDUSDT as it showcases a captivating trajectory. After a notable dip, it's firmly grasping a pivotal support level, hinting at an impending bullish surge.
💎 Not long ago, we noticed SAND reaching an overhead supply zone, only to face rejection and embark on a downward path. The recent substantial dip in the market, driven by a significant drop in BTC, impacted the upward momentum of many altcoins. In line with this trend,it experienced a decline, touching the crucial support at 0.2776, but is now regaining its bullish stride.
💎 Additionally, the emergence of a channel pattern is evident. A breakout from this channel could amplify the bullish momentum. However, if SANDUSDT struggles to sustain above the support zone, a pronounced downward shift is plausible. As always, strategize your trades meticulously.
💎 Remember to employ prudent trading strategies and use proper stop-loss measures! Stay alert to market movements and look forward to more insights
SAND/USDT Bullish Momentum ??? Break the resistance or Reject?💎 SAND has undoubtedly captured our attention, achieving a breakout from the Symmetrical Triangle pattern with a notable ascent. Currently, SAND is at a pivotal juncture, facing a resistance zone that needs to be overcome to maintain its upward trajectory. However, SAND has not yet initiated a downward movement for a retesting phase.
💎 For optimal entry points, we can await confirmation by observing either a breakout from the resistance zone or a pullback to the demand area. If SAND manages to breach the resistance promptly, it's likely to proceed smoothly towards its next targets, the supply zone, and the bearish OB region.
💎 Should SAND face another rejection at the resistance, it might enter a retesting phase at the demand zone. In such a case, SAND would require a definitive bounce to continue its attempts to shatter the resistance barrier.
💎 Failure to do so could result in SAND relinquishing its hold on the demand zone, indicating a potential false breakout and initiating a downward momentum. Consequently, SAND might seek support, potentially testing the resilience of a significant support area below.
