SAND/USDT at Critical Support Zone – Rebound Potential?Detailed Technical Analysis:
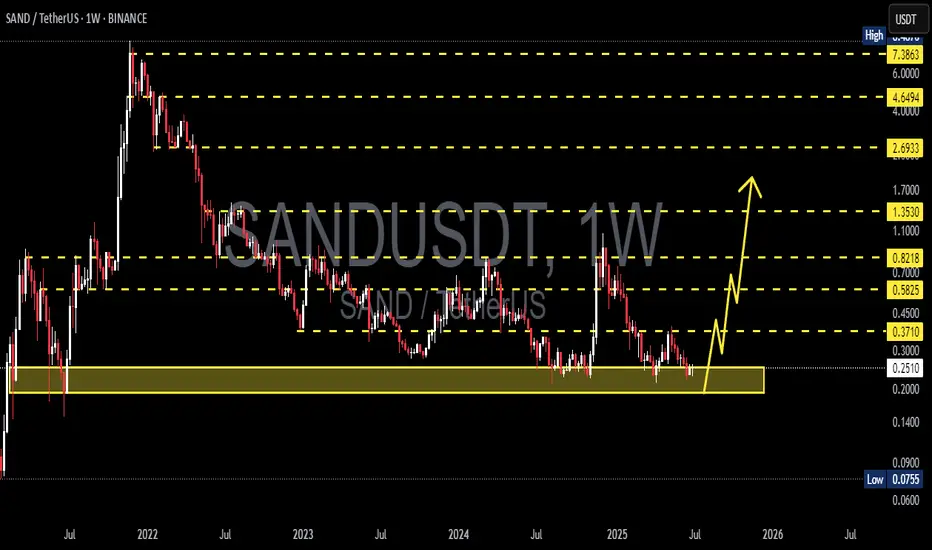
The SAND/USDT weekly chart shows the price currently hovering around a historically strong support zone between $0.20 – $0.25. This yellow-marked demand area has been tested multiple times since 2021 and has consistently prevented further downside, making it a crucial decision point for both bulls and bears.
🟢 Bullish Scenario:
If the price manages to hold this key support and prints bullish price action (e.g., a bullish engulfing or hammer candlestick), a reversal is likely. The projected upward path on the chart outlines the next key resistance levels:
1. $0.3710 – Initial resistance.
2. $0.4500 – First major breakout confirmation.
3. $0.5825 - $0.7000 – Mid-term resistance cluster.
4. $0.8218 - $1.3530 – Longer-term targets if bullish momentum sustains.
Bullish Confirmation:
Weekly candle close above $0.37
Breakout with strong volume beyond $0.45
🔴 Bearish Scenario:
If the price breaks below and closes under the $0.20 support zone, it would signal a bearish continuation, with possible downside targets at:
1. $0.14 – Minor historical support.
2. $0.09 - $0.075 – Extreme low support region and historical bottom.
Bearish Confirmation:
Weekly close below $0.20
Strong breakdown volume without immediate bullish rejection
📊 Chart Pattern Overview:
✅ Triple Bottom / Accumulation Zone:
The current support area resembles a potential triple bottom structure or long-term accumulation phase. If confirmed, this pattern could mark the beginning of a new bullish cycle.
🧠 Conclusion:
SAND is at a make-or-break level. As long as the price holds above the $0.20 - $0.25 support zone, bullish recovery remains a valid possibility. However, a breakdown below this level could trigger a significant bearish move.
#SANDUSDT #CryptoAnalysis #AltcoinSeason #TechnicalAnalysis #BullishScenario #BearishScenario #CryptoTrading #PriceAction #SupportResistance #TripleBottom
Sandusdtbuy
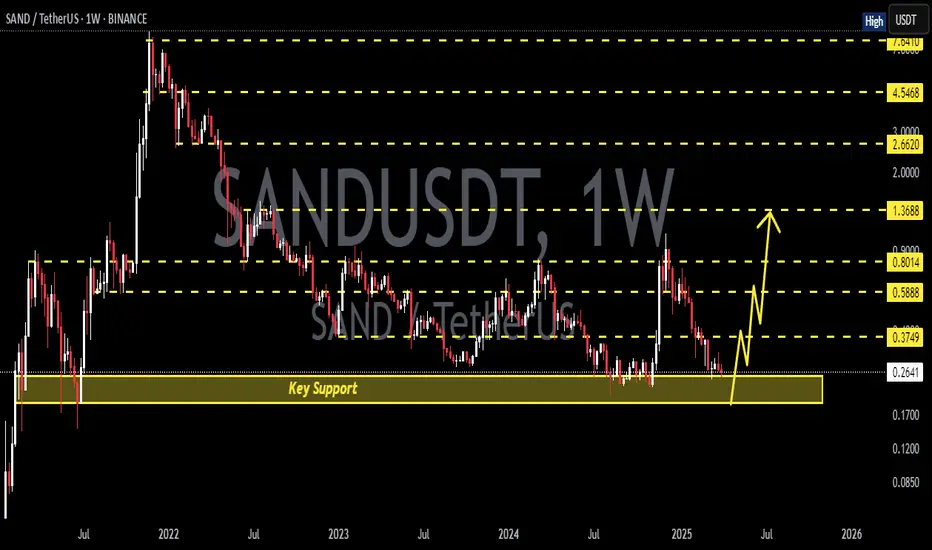
SANDUSDT 1W AnalysisSAND ~ 1W Analysis
#SAND Buy back gradually from here if you still have confidence in this coin with a short term target of at least 20%+ from this support.

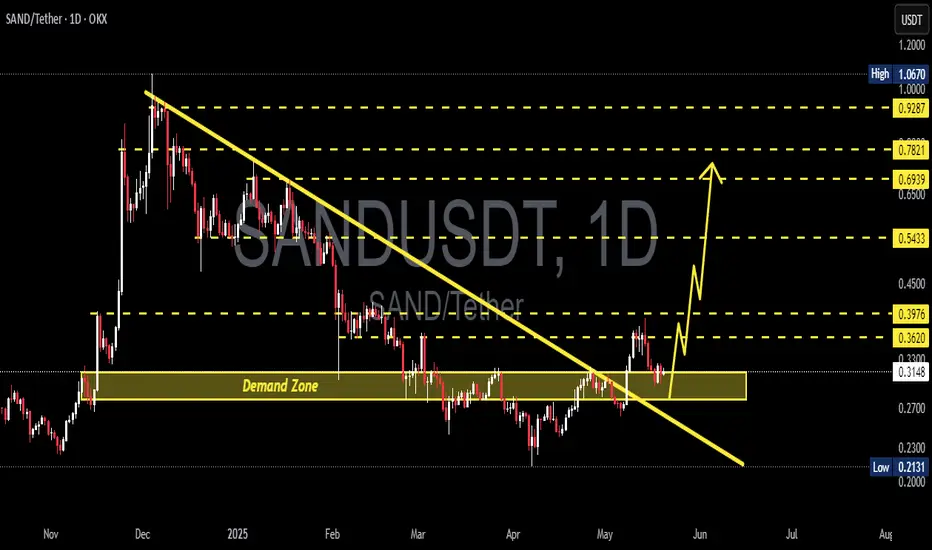
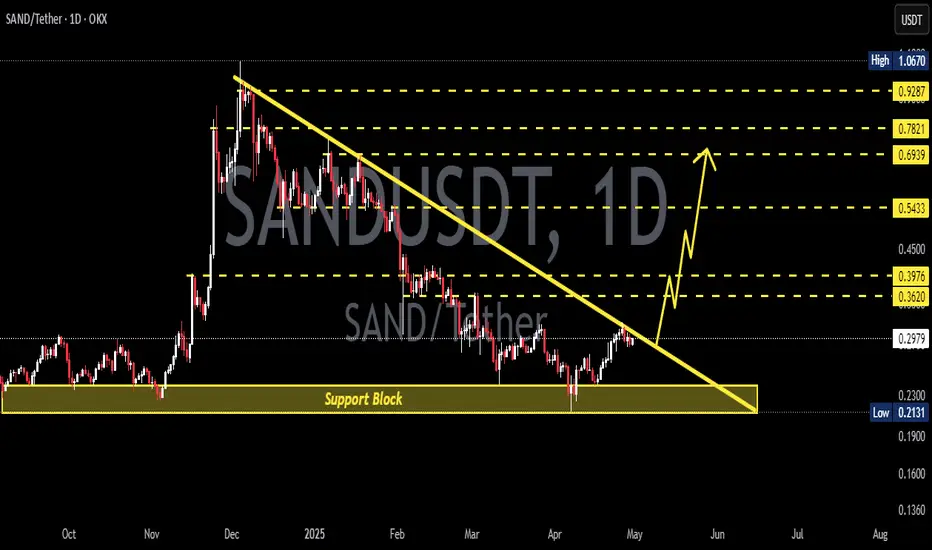
SANDUSDT 1D Analysis SAND ~ 1D Analysis
#SAND Buy gradually from here if you still have confidence in this coin with a short term target of at least 15%+ from here.
SANDUSDT BUY/LONGBy utilizing Fibonacci retracement levels, historical patterns, , we can formulate a hypothesis that the market might follow a similar trajectory if bullish sentiment prevails.
SANDUSDT 1D AnalysisSAND ~ 1D Analysis
#SAND Buy gradually after successfully penetrating this resistant line with a short -term target of at least 15%+.
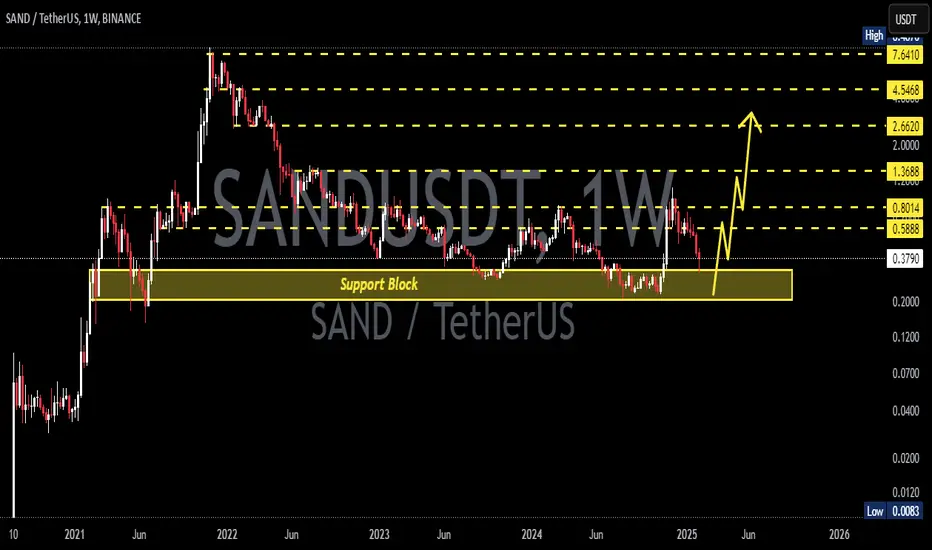
SANDUSDT 1WSAND ~ 1W Analysis
#SAND Buy from here if you still have a Conviction on this coin with a short -term target of at least 20%+.
SANDUSDT 1WSAND ~ 1W Analysis
#SAND Buy gradually from here if you still have a Conviction on this Coin with a minimum target of 20%+
SANDUSDT 1WSAND Update ~ 1W
#SAND Still maintaining its bullish structure. This is the 2nd wave in the Eliot Wave pattern. Buy in stages. Target 20%++
sand idea"🌟 Welcome to Golden Candle! 🌟
We're a team of 📈 passionate traders 📉 who love sharing our 🔍 technical analysis insights 🔎 with the TradingView community. 🌎
Our goal is to provide 💡 valuable perspectives 💡 on market trends and patterns, but 🚫 please note that our analyses are not intended as buy or sell recommendations. 🚫
Instead, they reflect our own 💭 personal attitudes and thoughts. 💭
Follow along and 📚 learn 📚 from our analyses! 📊💡"

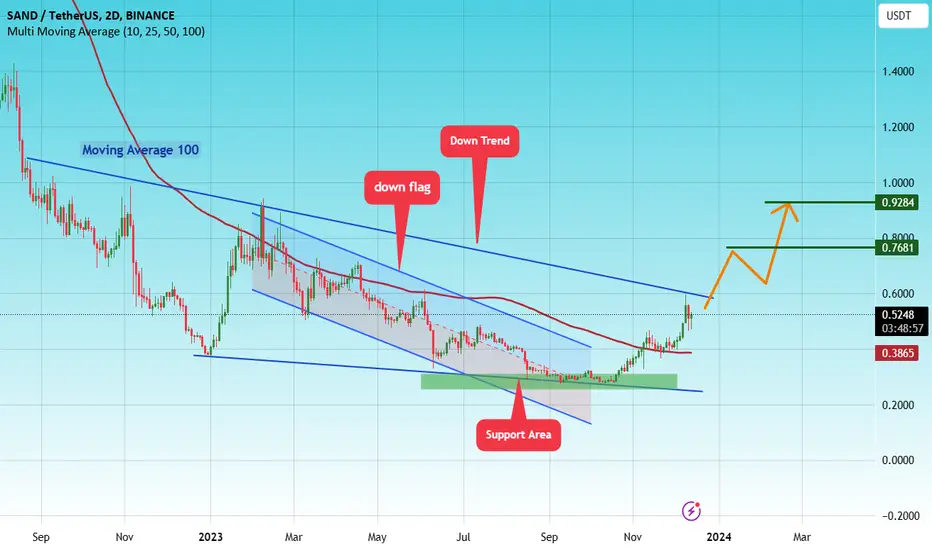
#SAND/USDT#SAND
We have had a down flag since July 2202
We have strong upward momentum that will help us breakout
We have a clear breakout of the Moving Average 100.
Current price 0.5260
First target 0.7770
Second goal 0.9284
Which represents 195% of the current price
SANDUSDT 1WSAND ~ 1W
#SAND So far continuing to maintain this support Block,. If you still have Conviction on this coin,. Buy in increments on this support block, with a minimum target of 20%++

SANDUSDTSAND ~ 1W
#SAND If you still have Conviction on this coin,. This support block would be a very good buy for now.

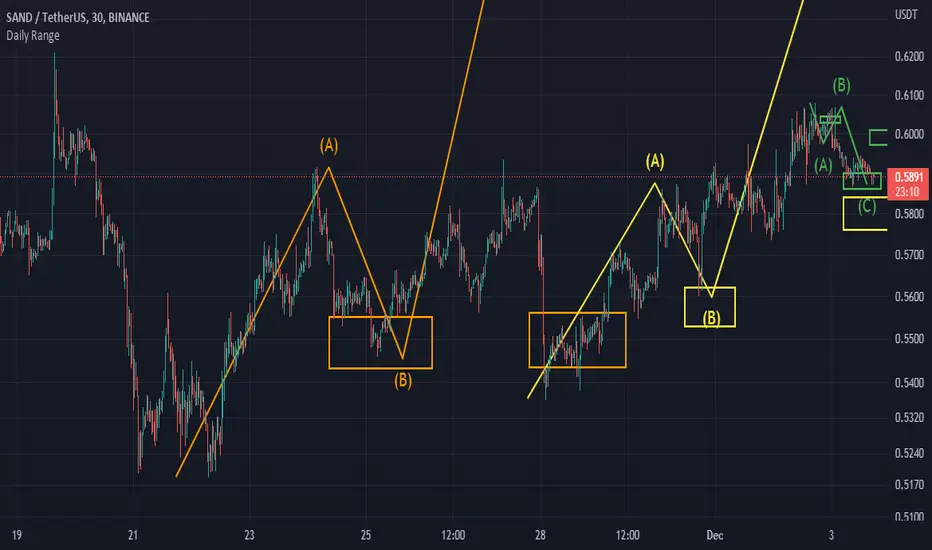
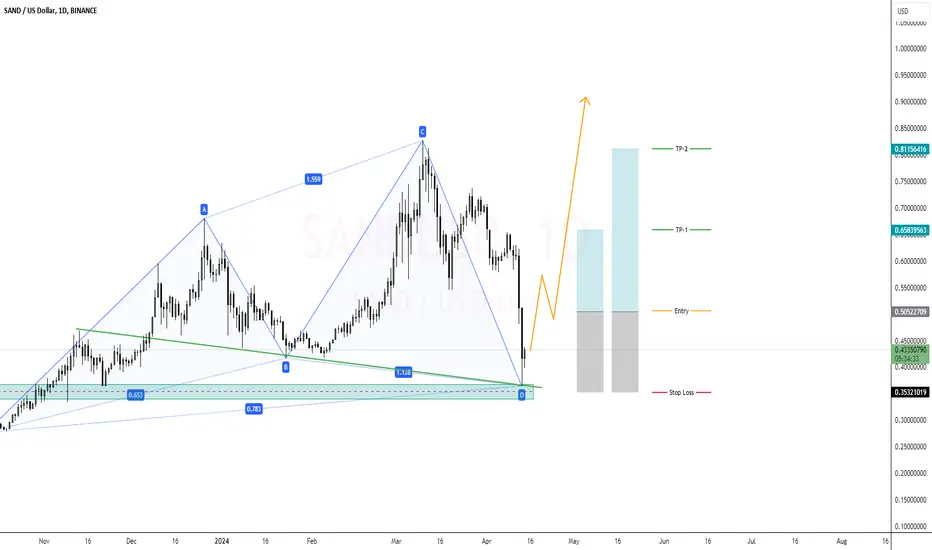
SAND/USDT Technical Analysis - Potential Bullish OpportunitySAND/USDT has exhibited a notable XABCD harmonic pattern formation, coinciding with a pivotal support level. This suggests a potential bullish reversal from point D, indicating favorable trading opportunities for discerning investors.
Harmonic Pattern Analysis:
The XABCD harmonic pattern observed in SAND/USDT signals a systematic price structure characterized by precise Fibonacci relationships. The completion of this pattern at point D suggests a high probability of trend reversal, presenting an optimal entry point for bullish positions.
Key Support Area:
The convergence of the XABCD pattern with a key support area strengthens the bullish bias, reinforcing the significance of the anticipated price movement. This confluence enhances the reliability of our analysis and underscores the importance of the identified entry level.
Entry Strategy:
We recommend initiating long positions near the price level of 0.5053, strategically aligning with the completion of the harmonic pattern and the established support region. This entry point offers favorable risk-reward dynamics and positions traders advantageously for potential upside movements.
Risk Management:
To mitigate downside risks, it is prudent to implement a stop-loss order near 0.3532. This predefined exit point safeguards capital and preserves trading discipline, ensuring minimal losses in the event of adverse price fluctuations.
Profit Targets:
Our profit-taking strategy encompasses two distinct targets to capitalize on the anticipated bullish momentum. The initial profit target (TP-1) is set at 0.6584, representing a conservative approach to securing gains. Subsequently, the secondary profit target (TP-2) is identified at 0.8115, offering the potential for extended profitability as the uptrend unfolds.
Conclusion:
In conclusion, the technical analysis of SAND/USDT reveals a compelling bullish outlook, characterized by the formation of a XABCD harmonic pattern and the confluence with a key support area. By adhering to the suggested entry, stop-loss, and profit-taking levels, traders can optimize their trading strategy and capitalize on the anticipated price appreciation.
Disclaimer:
This analysis is based solely on technical indicators and historical price data. It is imperative to conduct thorough risk assessments and exercise prudent risk management practices when executing trades in the financial markets.*
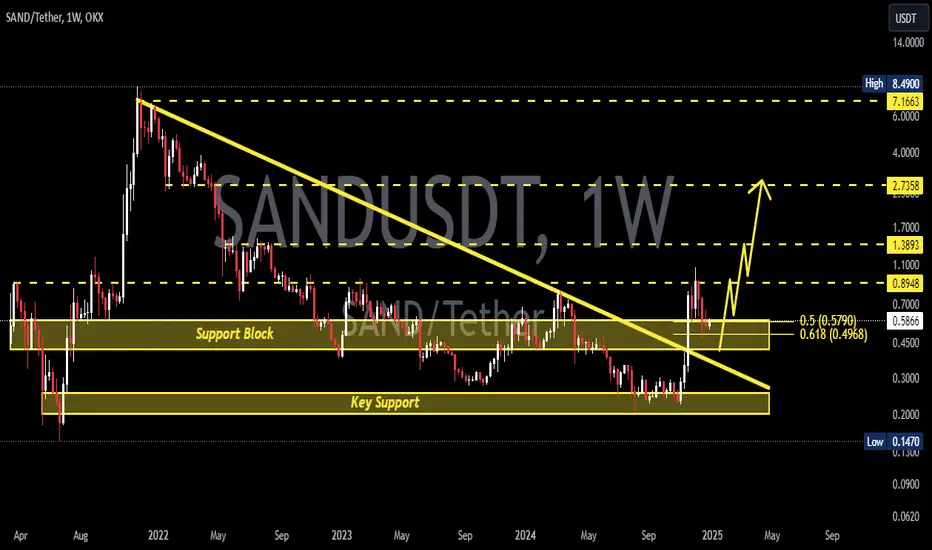
SAND/USDT AnalysisSAND has recently surged, breaking free from its weekly downward trend and presenting a significant growth potential in the upcoming period. There is an opportunity for a potential 5x increase. Key targets include $0.7, $1.3, and $2.6.

SAND showing a very impressive investment opportunityHi Everyone;
today we have one of the best risk to reward Investment opportunity
it is more than 550 times the risk and the chart is look very promising.
I expect breaking the previous bear market key point will clear the way to the final target
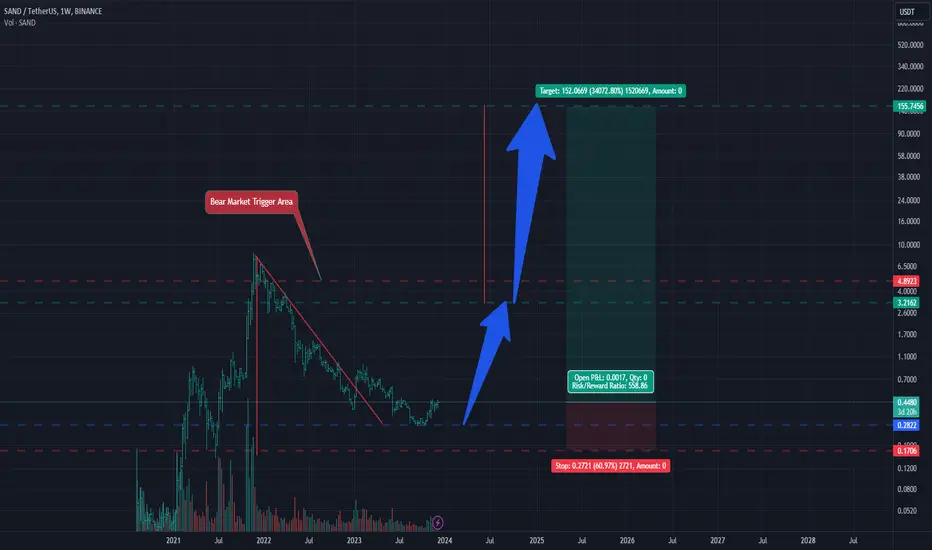
SAND target 0.564h time frame
-
SAND is creating a potential bottom head and shoulders, the right shoulder hasn't been formed yet. Currently, 0.37 achieve the condition of HS, but shall notice another possibility that SAND go back to 0.35 to make the low of right shoulder.
I will provide another trading plan if SAND reach 0.35, and now we can follow this plan which targets as below.
TP: 0.56 / 0.66
SL: 0.381

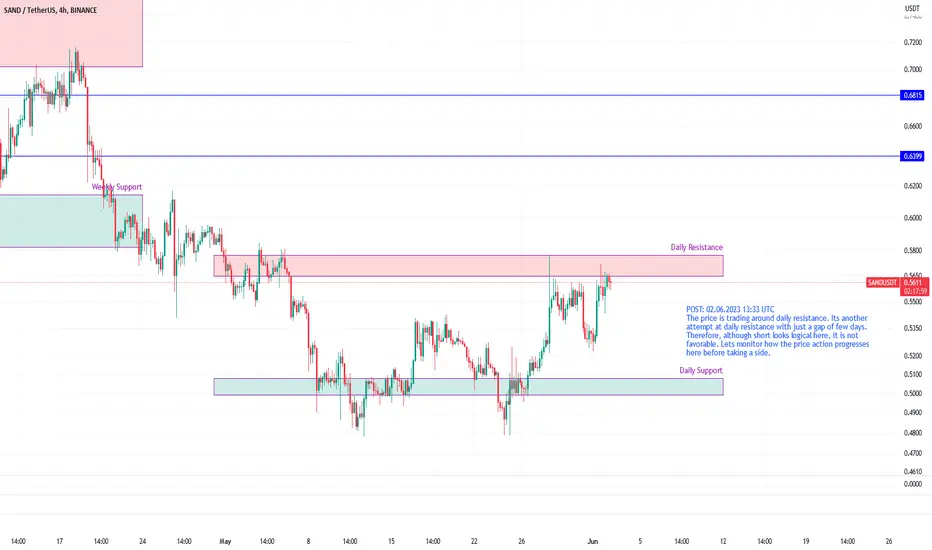
SANDUSDT at daily resistance but may break outThe price is trading around daily resistance. Its another attempt at daily resistance with just a gap of few days. Therefore, although short looks logical here, it is not favorable. Lets monitor how the price action progresses here before taking a side.
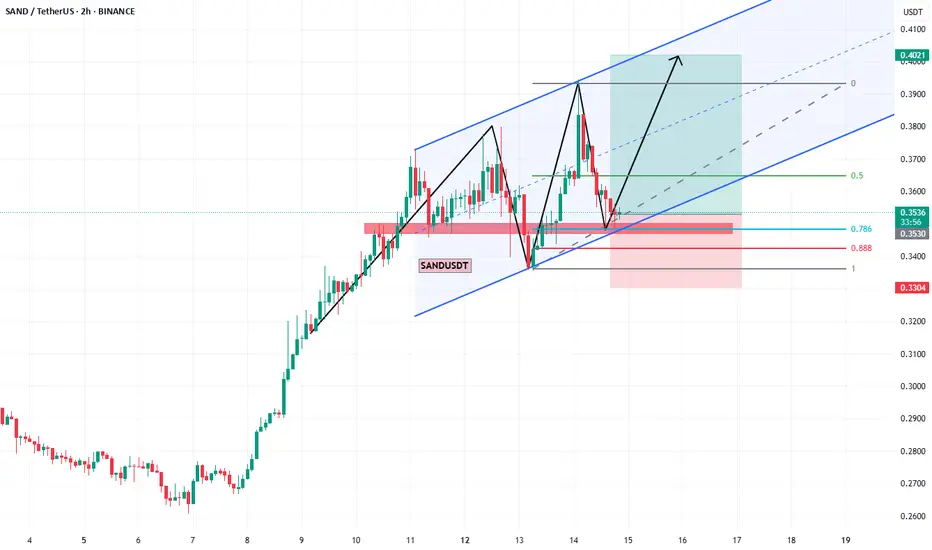
SAND Looking bullish (Long entry setup)Sand looks to be reversing back from a pretty important area and after a nice change of character I expect a minot pullback to grab some liquidity before going all the way up!
NFA
Sandusdt Retesting Sandusdt
Sandusdt Breakout Was Already Confirmed, retest is in process incase of successful retest expecting 40-80% Bullish Move
Wait For Confirmation, Risk Under Your Control
Dyor

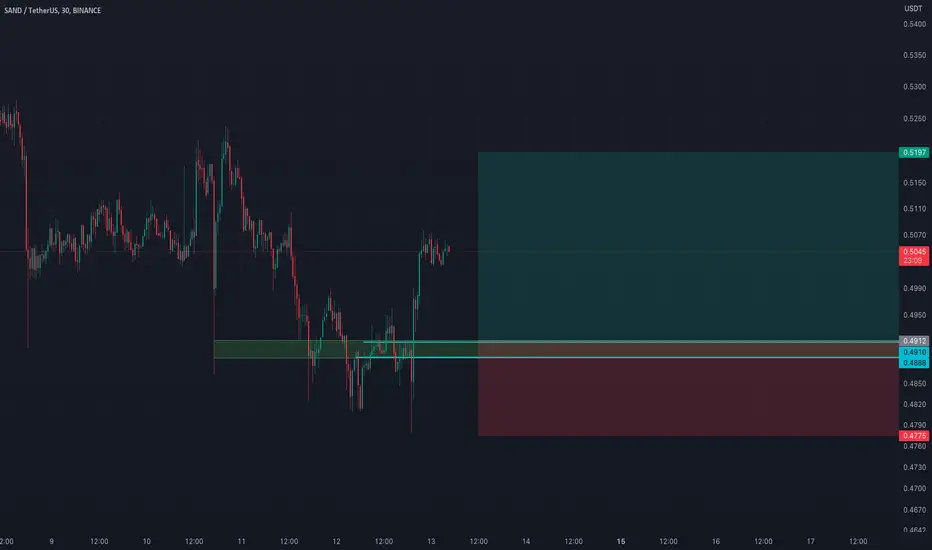
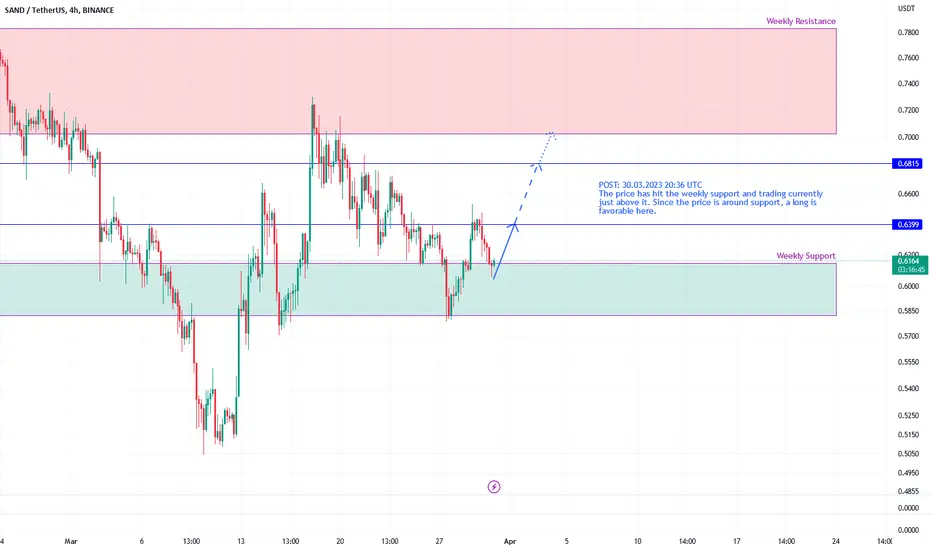
SANDUSDT on weekly support, long favorable towards weekly resistThe price has hit the weekly support and trading currently just above it. Since the price is around support, a long is favorable here.
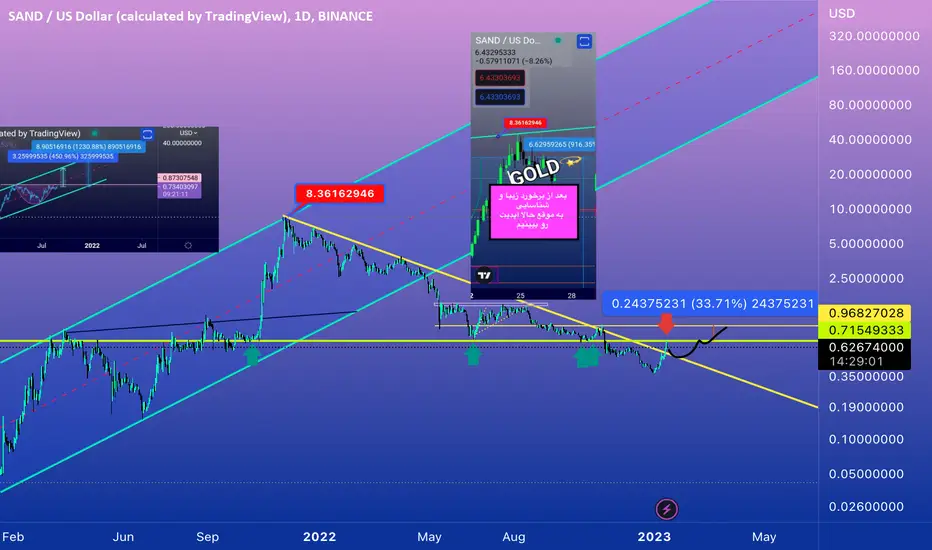
NeutralSand
It was behind a downward trend for months , But now it has managed to break .
The last time we exited this currency with the beautiful identification of the channel ceiling and the number 8.36 .
If we manage to break 0.71 , we can set the next target at 0.96
Best entries for SAND and why I think it's a bull trap right nowI will be waiting for 25 and 20 cents to buy SAND if it couldn.t cross the the 200 EMA. If it did I will be entering after some retracement from the leg that broke the EMA maybe (61 or deeper retracement). Let me know what you think.

SANDUSDT analysis buy signal 12/3/2022we will stick to our yellow BC buying area after formation of III yellow sequence RR :3:1 talking in consideration that the market can take the bearish green target as point of starting bullish sequence