SAND/USDT Analysis – Major Accumulation or Imminent Breakdown?🔍 Overview:
SAND is currently trading at a crucial historical support zone, which has held firm multiple times since mid-2022. The chart shows a prolonged accumulation phase, offering significant potential for a major breakout or a decisive breakdown depending on market reaction.
---
🧠 Price Structure & Price Action:
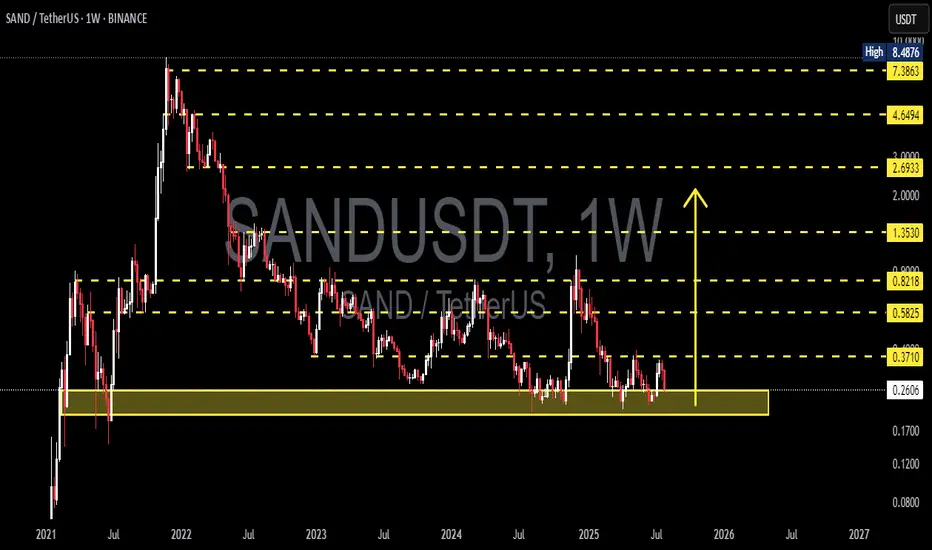
After reaching an all-time high at $8.4876 in late 2021, SAND has been in a long-term downtrend.
However, over the past year, it has formed a wide base around the $0.26–$0.37 range — a clear sign of potential accumulation.
Price is currently moving sideways in a compression structure, signaling the build-up of energy for the next explosive move.
---
🧱 Key Levels:
Level Function Status
$0.2613 Primary Historical Support Currently being tested
$0.3710 Local Resistance Needs to be reclaimed
$0.5825 Major Resistance Bullish confirmation level
$0.8218 Weekly S/R Flip Mid-range target
$1.3530 Psychological Resistance Potential medium-term target
$2.6933 / $4.6494 Expansion Phase Targets Long-term upside potential
$7.3863 Pre-ATH Resistance Late-cycle target
---
🟢 Bullish Scenario:
1. If price holds and bounces off the $0.26–$0.37 demand zone, a bullish reversal may unfold.
2. A weekly close above $0.3710 would be the first sign of strength.
3. Breaking $0.5825 with solid volume would confirm trend reversal and open the path toward $0.82 – $1.35.
📌 Additional Bullish Confirmation:
Bullish divergence on RSI (if present)
Increasing volume during upward moves
---
🔴 Bearish Scenario:
1. A clear breakdown below $0.2613 on the weekly timeframe would signal a loss of major support.
2. This opens downside risk toward:
$0.17
$0.12
Possibly even $0.08 if the market seeks a deeper revaluation.
3. Such a move would likely represent a full structure reset.
📌 Additional Bearish Confirmation:
Strong bearish candles with high volume
Weak or no bullish reaction within the demand zone
---
🔁 Formations in Play:
Accumulation Rectangle: A sideways range often found at market bottoms before new bull cycles.
Multi-year Base Formation: Can serve as a launchpad for major parabolic moves if resistance is broken.
---
📚 Conclusion:
SAND is at a make-or-break zone. The market is coiled like a spring — preparing either for a new bullish expansion or for further downside pain. Smart traders and investors will:
Wait for breakout confirmation
Or exit positions on breakdown signals
This is a golden zone for preparation, not reaction.
---
📌 Suggested Trading Plan:
✅ Bullish Bias: Scale in within support zone; tight stop below $0.26
❌ Bearish Bias: Short only after weekly close below $0.26
🧠 Neutral/Waiting: Let the market prove itself
#SANDUSDT #CryptoBreakout #AltcoinAnalysis #TechnicalAnalysis #MetaverseToken #SupportZone #BullishScenario #BearishOutlook #SmartMoneyAccumulation #CryptoTA #AccumulationPhase
Sandusdtlong
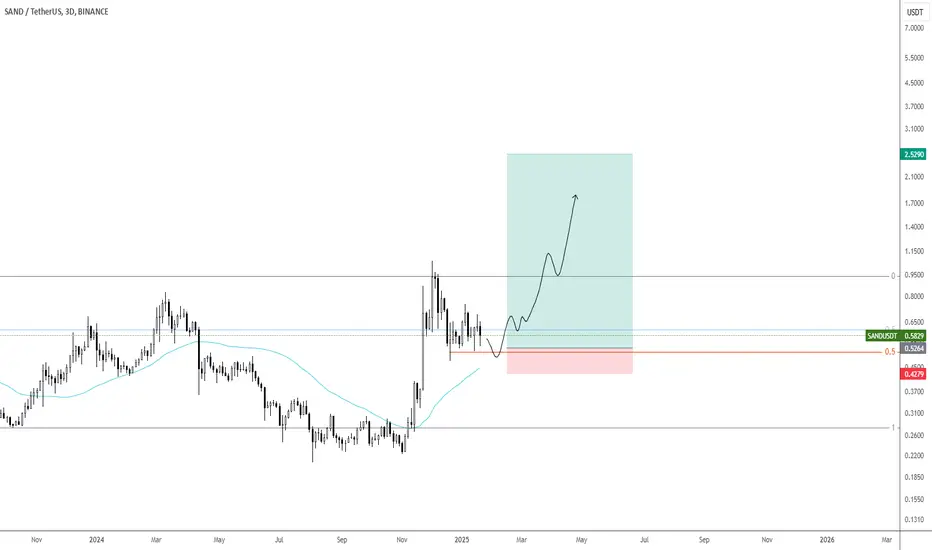
SANDUSDT Breaks Major Downtrend – Golden Pocket Retest!
Technical Analysis:
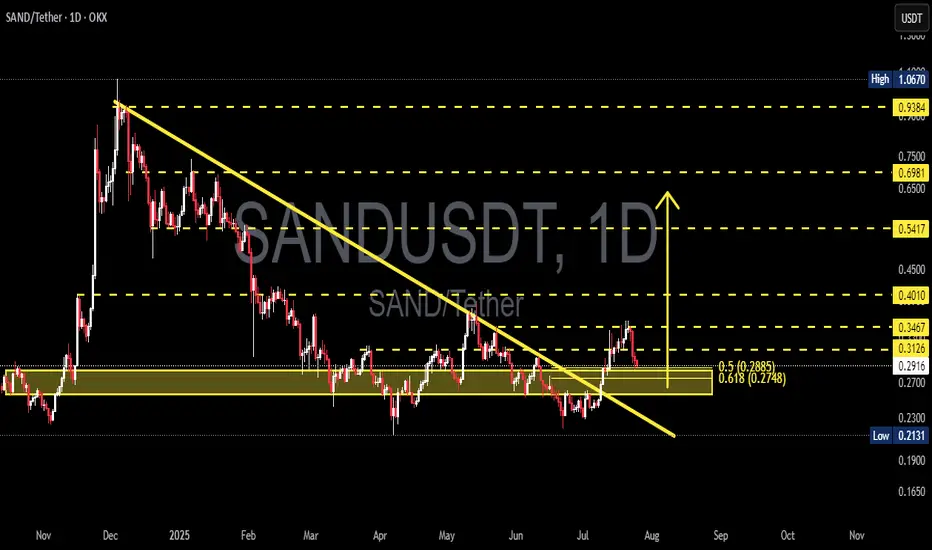
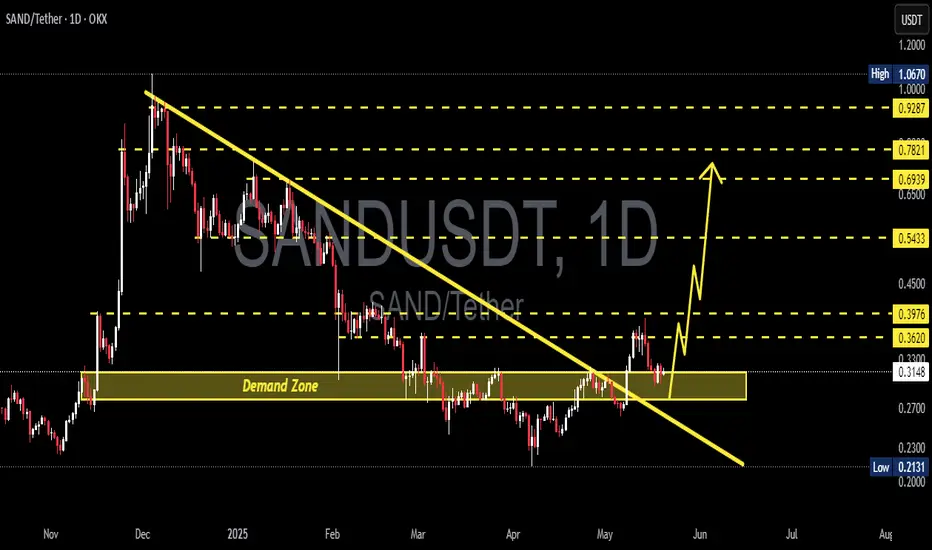
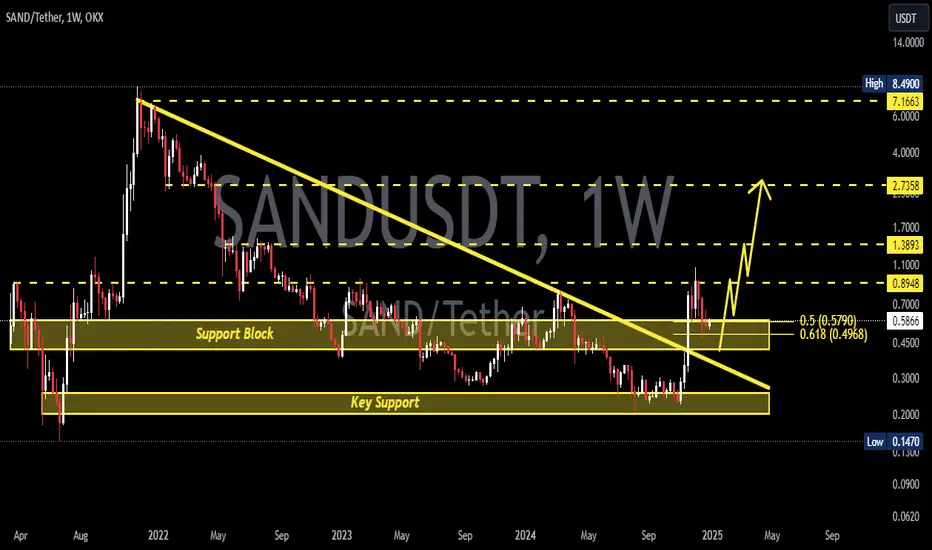
SAND/USDT has successfully broken out of a descending trendline that had been capping the price since late 2024. The breakout occurred with increased volume, signaling strong buyer interest.
Following the breakout, price rallied and is now retesting a key support zone, which includes:
A demand zone (yellow box) between 0.2748 - 0.2885, aligning with the Fibonacci Golden Pocket (0.618 - 0.5)
A solid horizontal support around 0.2913
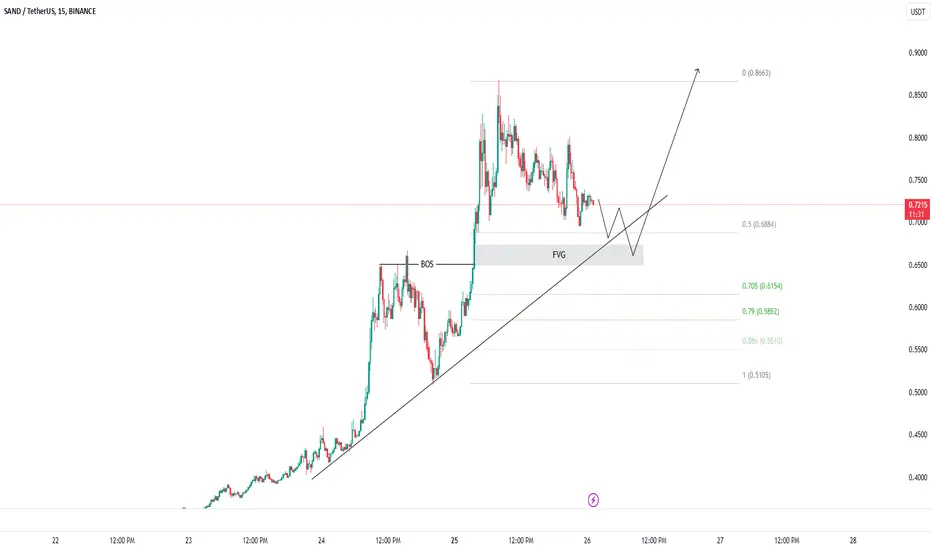
Fibonacci retracement levels are clearly defined:
0.3126
0.3467
0.4010
0.5417
Up to major resistance near 0.9384
---
Bullish Scenario 🟢:
If the price holds above the Golden Pocket zone and prints bullish confirmation (such as a bullish engulfing or hammer candlestick), then further upside potential is likely:
1. Initial targets: 0.3126 and 0.3467
2. Mid-range targets: 0.4010 and 0.5417
3. Long-term potential: 0.6981 and possibly the major resistance at 0.9384
Stronger confirmation would come from a daily candle closing above 0.3126.
---
Bearish Scenario 🔴:
If price breaks below the 0.2748 zone, it could indicate a failed breakout, potentially leading to:
1. Initial support: 0.2700
2. Deeper pullback zone: 0.2131 (previous low)
3. Potential fakeout of the trendline breakout
A daily close below 0.2748 would strongly validate the bearish setup.
---
Chart Pattern Overview:
Descending Triangle Breakout already confirmed
Price is now in the retest phase of the breakout
The Golden Pocket Fibonacci zone is the crucial point of trend continuation or reversal
---
Conclusion:
The breakout from the long-standing downtrend marks a strong shift in structure. However, a successful retest at the Golden Pocket will be key to confirming further bullish continuation. If buyers defend this zone, SAND is likely to print a higher low and resume its upward move.
#SANDUSDT #CryptoBreakout #AltcoinAnalysis #TechnicalAnalysis #FibonacciLevels #TrendlineBreakout #GoldenPocket #BullishSetup #BearishSetup
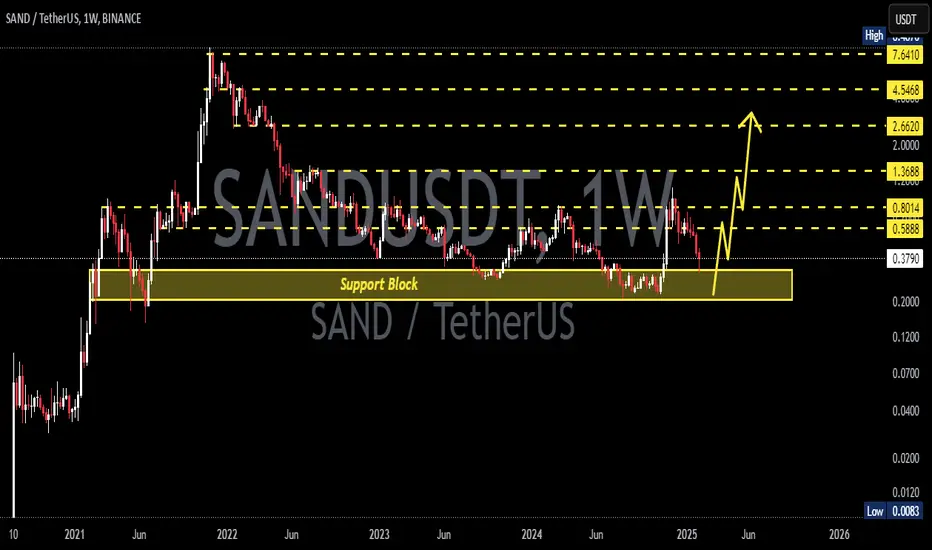
SANDBOX RALLY..Since 2021, SAND has been quiet but now holds strong support at $0.22. I believe a rally to $2.70 is likely in the coming months.
(ITS NOT A FINANCIAL ADVISE)

SAND/USDT at Critical Support Zone – Rebound Potential?Detailed Technical Analysis:
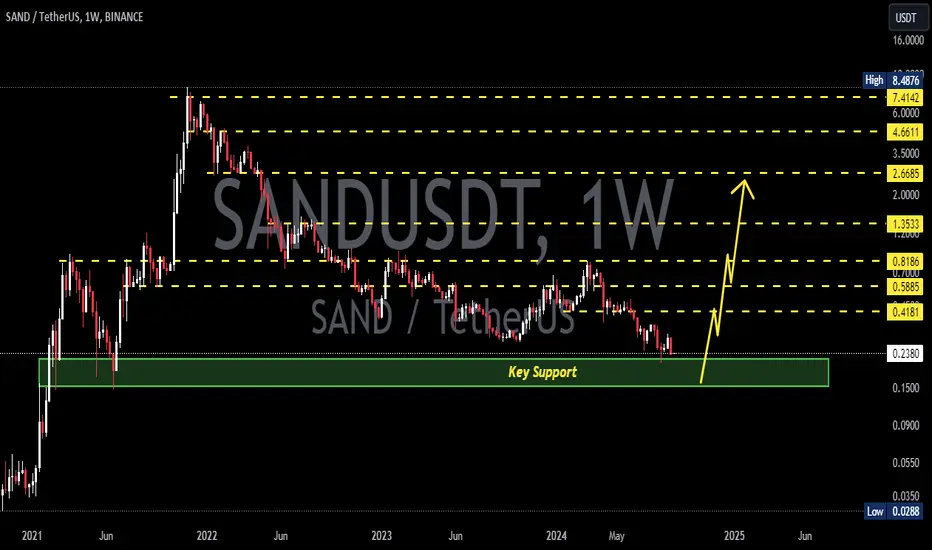
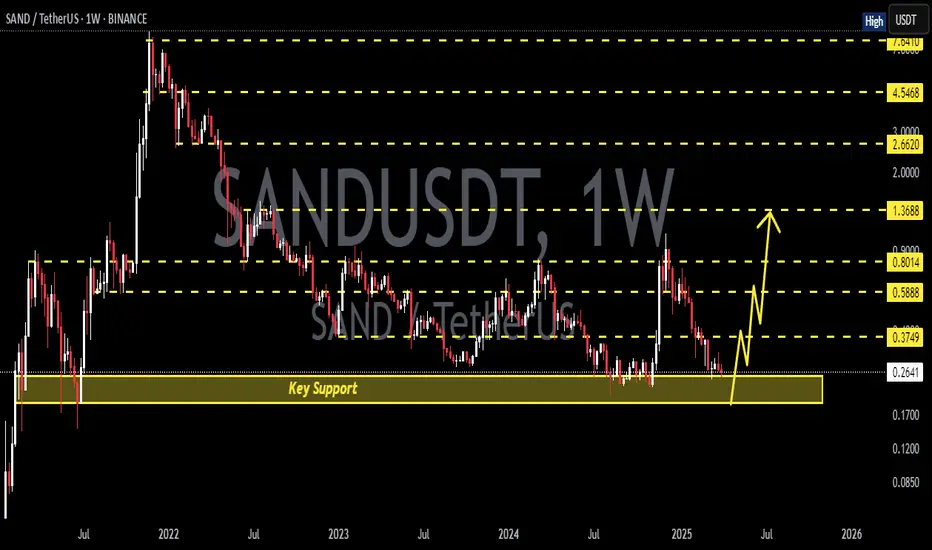
The SAND/USDT weekly chart shows the price currently hovering around a historically strong support zone between $0.20 – $0.25. This yellow-marked demand area has been tested multiple times since 2021 and has consistently prevented further downside, making it a crucial decision point for both bulls and bears.
🟢 Bullish Scenario:
If the price manages to hold this key support and prints bullish price action (e.g., a bullish engulfing or hammer candlestick), a reversal is likely. The projected upward path on the chart outlines the next key resistance levels:
1. $0.3710 – Initial resistance.
2. $0.4500 – First major breakout confirmation.
3. $0.5825 - $0.7000 – Mid-term resistance cluster.
4. $0.8218 - $1.3530 – Longer-term targets if bullish momentum sustains.
Bullish Confirmation:
Weekly candle close above $0.37
Breakout with strong volume beyond $0.45
🔴 Bearish Scenario:
If the price breaks below and closes under the $0.20 support zone, it would signal a bearish continuation, with possible downside targets at:
1. $0.14 – Minor historical support.
2. $0.09 - $0.075 – Extreme low support region and historical bottom.
Bearish Confirmation:
Weekly close below $0.20
Strong breakdown volume without immediate bullish rejection
📊 Chart Pattern Overview:
✅ Triple Bottom / Accumulation Zone:
The current support area resembles a potential triple bottom structure or long-term accumulation phase. If confirmed, this pattern could mark the beginning of a new bullish cycle.
🧠 Conclusion:
SAND is at a make-or-break level. As long as the price holds above the $0.20 - $0.25 support zone, bullish recovery remains a valid possibility. However, a breakdown below this level could trigger a significant bearish move.
#SANDUSDT #CryptoAnalysis #AltcoinSeason #TechnicalAnalysis #BullishScenario #BearishScenario #CryptoTrading #PriceAction #SupportResistance #TripleBottom
SANDUSDT 1W AnalysisSAND ~ 1W Analysis
#SAND Buy back gradually from here if you still have confidence in this coin with a short term target of at least 20%+ from this support.

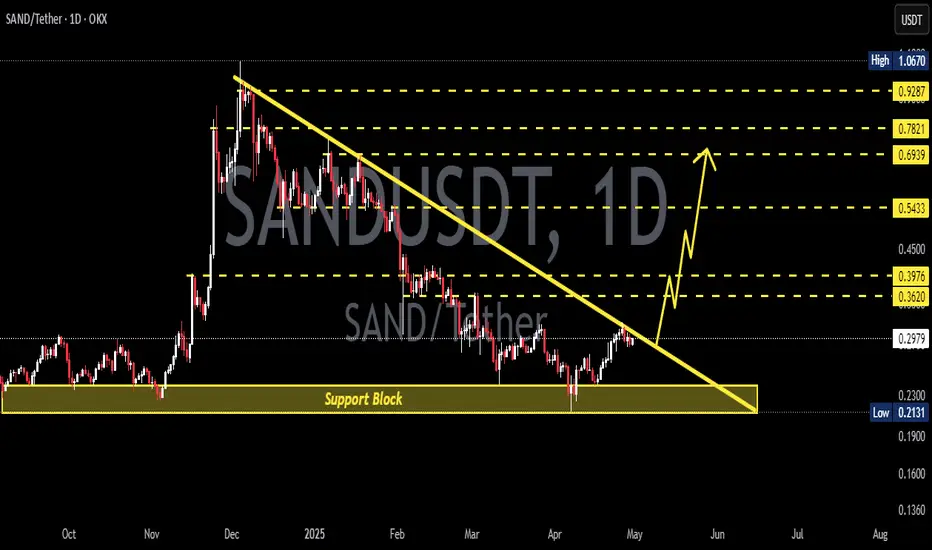
SANDUSDT 1D Analysis SAND ~ 1D Analysis
#SAND Buy gradually from here if you still have confidence in this coin with a short term target of at least 15%+ from here.
SANDUSDT BUY/LONGBy utilizing Fibonacci retracement levels, historical patterns, , we can formulate a hypothesis that the market might follow a similar trajectory if bullish sentiment prevails.
#SAND/USDT#SAND
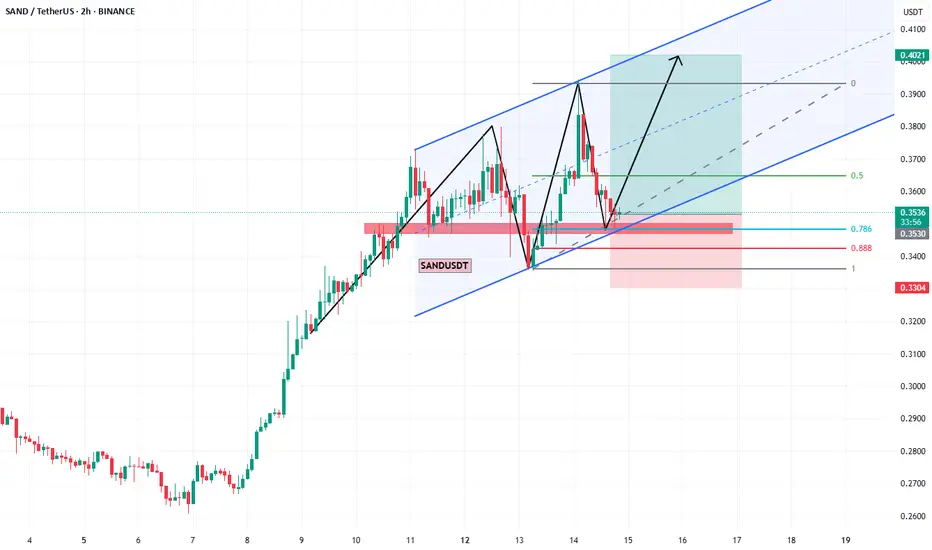
The price is moving within a descending channel on the 1-hour frame and is expected to break and continue upward.
We have a trend to stabilize above the 100 moving average once again.
We have a downtrend on the RSI indicator that supports the upward move with a breakout.
We have a support area at the lower boundary of the channel at 0.2790, which acts as strong support from which the price can rebound.
Entry price: 0.2828
First target: 0.2890
Second target: 0.2971
Third target: 0.3048

SANDUSDT 1D AnalysisSAND ~ 1D Analysis
#SAND Buy gradually after successfully penetrating this resistant line with a short -term target of at least 15%+.
SANDUSDT 1WSAND ~ 1W Analysis
#SAND Buy from here if you still have a Conviction on this coin with a short -term target of at least 20%+.
SANDUSDT 1WSAND ~ 1W Analysis
#SAND Buy gradually from here if you still have a Conviction on this Coin with a minimum target of 20%+
GALA Play Vibes – $SAND Massive Potential Once Above $1!Just like my INDEX:GALA play. Old-timers know the potential of metaverse and gaming.
Still needs to break above the $1 zone. Might not get tapped below 51c, but I still think that’s the best entry area.
Is a 5x in the making? We’ll see soon... BINANCE:SANDUSDT
SANDUSDT 1WSAND Update ~ 1W
#SAND Still maintaining its bullish structure. This is the 2nd wave in the Eliot Wave pattern. Buy in stages. Target 20%++
sand idea"🌟 Welcome to Golden Candle! 🌟
We're a team of 📈 passionate traders 📉 who love sharing our 🔍 technical analysis insights 🔎 with the TradingView community. 🌎
Our goal is to provide 💡 valuable perspectives 💡 on market trends and patterns, but 🚫 please note that our analyses are not intended as buy or sell recommendations. 🚫
Instead, they reflect our own 💭 personal attitudes and thoughts. 💭
Follow along and 📚 learn 📚 from our analyses! 📊💡"

SANDUSDT Pumps Note :
Do your own Research and Trade Wisely Never rely on my opinions.
Good Luck folks
(Follow for more Valuable Updates)
#SAND/USDT#SAND
The price is moving in a bearish channel on the 12-hour frame, and it adheres to it well, and the price rebounded from the green zone
After rebounding from a significant decline, it is expected that the downward gap will be filled
We have a tendency to stabilize above the Moving Average 100
We have a downtrend on the RSI indicator that is expected to break higher to support the rise
Entry price is 0.4430
The first target is 0.5300
The second target is 0.6094
The third goal is 0.7113

#SAND/USDT#SAND
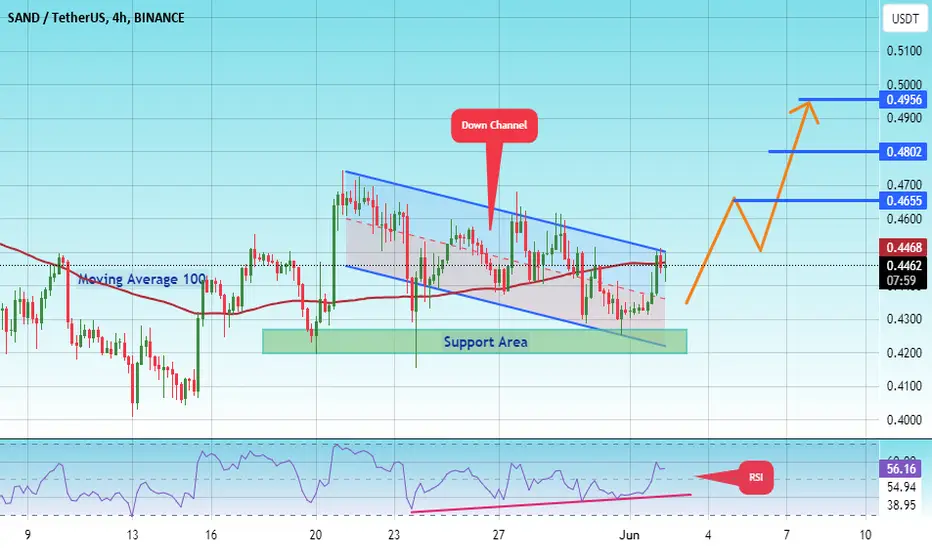
The price is moving within a bearish channel on a 4-hour frame and is strongly committed to it.
We have a support area at 0.4200 and we bounced from it at the lower border of the channel
We have a tendency to stabilize above the Moving Average 100
We have an upward trend on the RSI indicator that supports the rise and gives greater momentum
Entry price is 0.4350
The first target is 0.4650
The second target is 0.4802
The third target is 0.4950
#SAND/USDT#SAND
The price is moving in a triangle on a 4-hour frame and we have a green support area at the price of 0.6500
We have a higher stability of 100% moving forward
Now we have a nice breakout coming up
Our RSI indicator has a trend that is about to break to the upside
We are based on the rising trend
Entry price is 0.6700
The first target is 0.7200
The second target is 0.7700
The third goal is 0.8200

#SAND/USDT#SAND
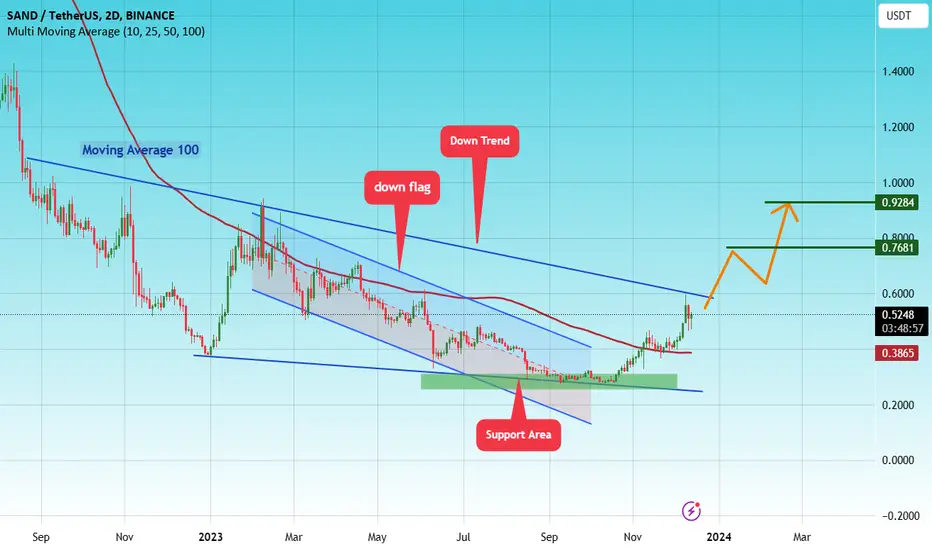
We have had a down flag since July 2202
We have strong upward momentum that will help us breakout
We have a clear breakout of the Moving Average 100.
Current price 0.5260
First target 0.7770
Second goal 0.9284
Which represents 195% of the current price
#SAND/USDT#SAND
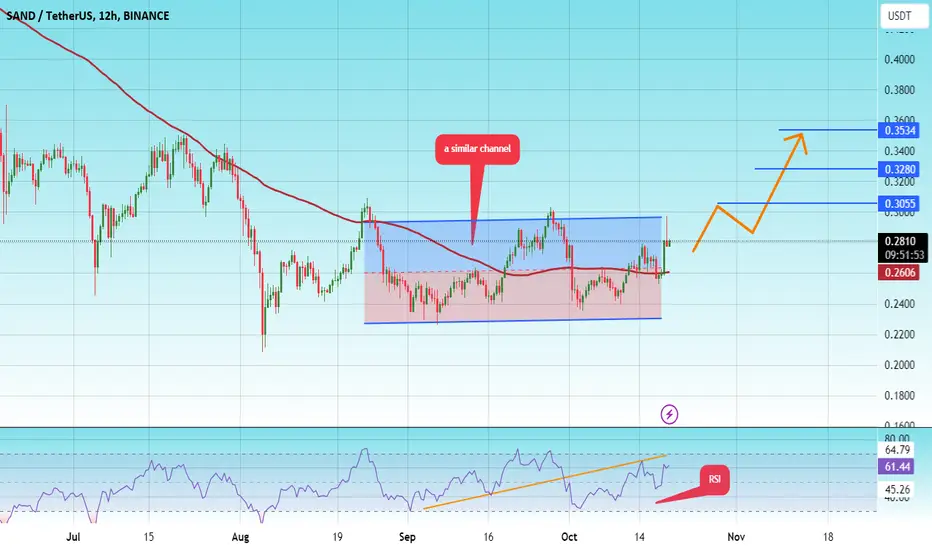
The price is moving in a similar channel on the 12-hour frame upwards and is expected to continue.
We have a trend to stabilize above the moving average 100 again.
We have an upward trend on the RSI indicator that supports the rise by breaking it upwards.
We have a support area at the lower limit of the channel at a price of 0.2380.
Entry price 0.2800.
First target 0.3055.
Second target 0.3280.
Third target 0.3533
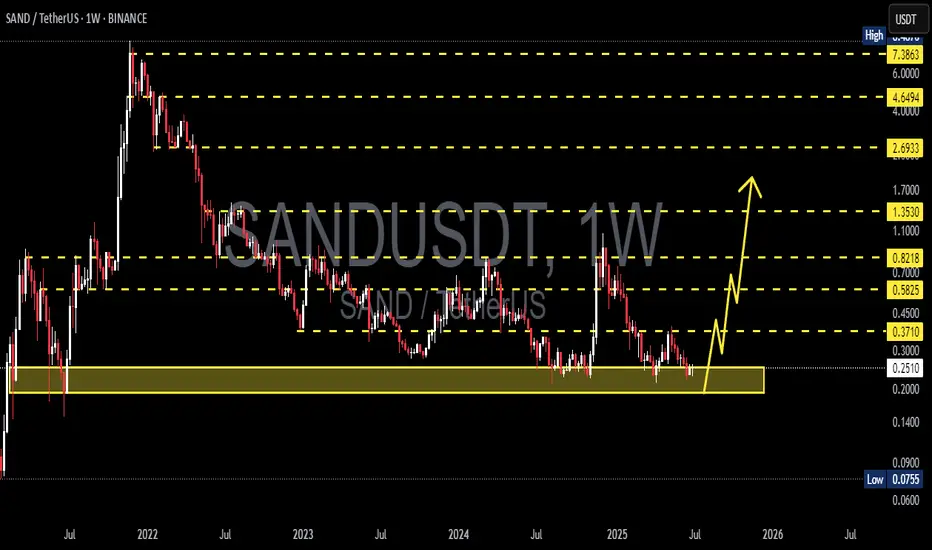
SANDUSDT 1WSAND ~ 1W
#SAND So far continuing to maintain this support Block,. If you still have Conviction on this coin,. Buy in increments on this support block, with a minimum target of 20%++

SANDUSDTSAND ~ 1W
#SAND If you still have Conviction on this coin,. This support block would be a very good buy for now.

SANDUSDTSAND ~ 1W
#SAND We think this key support will start to be retested. If this support block is strong enough to hold the price,. then the price will bounce off this support block.
We will update if plans change to this Chart.