SAND target 0.564h time frame
-
SAND is creating a potential bottom head and shoulders, the right shoulder hasn't been formed yet. Currently, 0.37 achieve the condition of HS, but shall notice another possibility that SAND go back to 0.35 to make the low of right shoulder.
I will provide another trading plan if SAND reach 0.35, and now we can follow this plan which targets as below.
TP: 0.56 / 0.66
SL: 0.381
SANDUSDTPERP

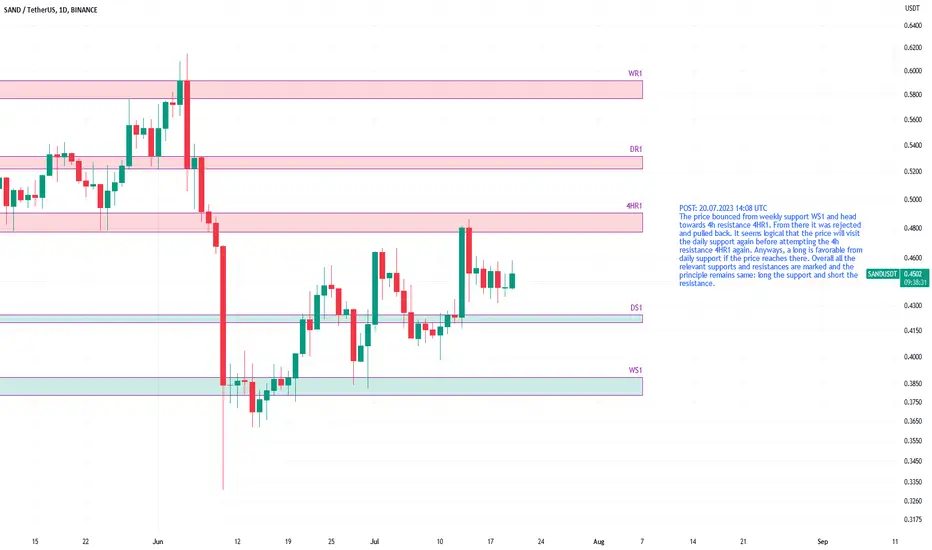
SANDUSDT relevant support and resistance levelsThe price bounced from weekly support WS1 and head towards 4h resistance 4HR1. From there it was rejected and pulled back. It seems logical that the price will visit the daily support again before attempting the 4h resistance 4HR1 again. Anyways, a long is favorable from daily support if the price reaches there. Overall all the relevant supports and resistances are marked and the principle remains same: long the support and short the resistance.
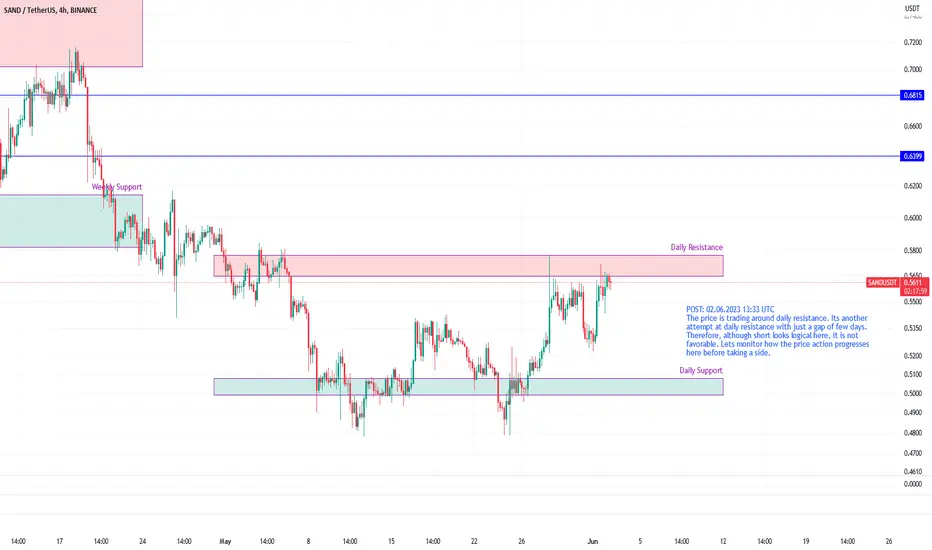
SANDUSDT at daily resistance but may break outThe price is trading around daily resistance. Its another attempt at daily resistance with just a gap of few days. Therefore, although short looks logical here, it is not favorable. Lets monitor how the price action progresses here before taking a side.
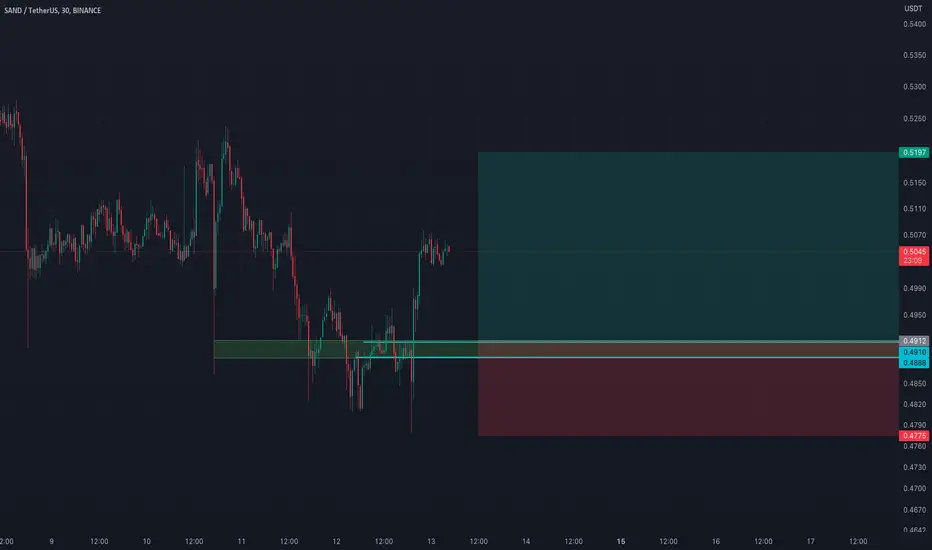
SAND Looking bullish (Long entry setup)Sand looks to be reversing back from a pretty important area and after a nice change of character I expect a minot pullback to grab some liquidity before going all the way up!
NFA
Sandusdt Retesting Sandusdt
Sandusdt Breakout Was Already Confirmed, retest is in process incase of successful retest expecting 40-80% Bullish Move
Wait For Confirmation, Risk Under Your Control
Dyor

Sand Attempting For Breakout Sandusdt
Incasenof successful breakout expecting 20-40% Bullish move in coming hours
Do Your own research & always manage risk
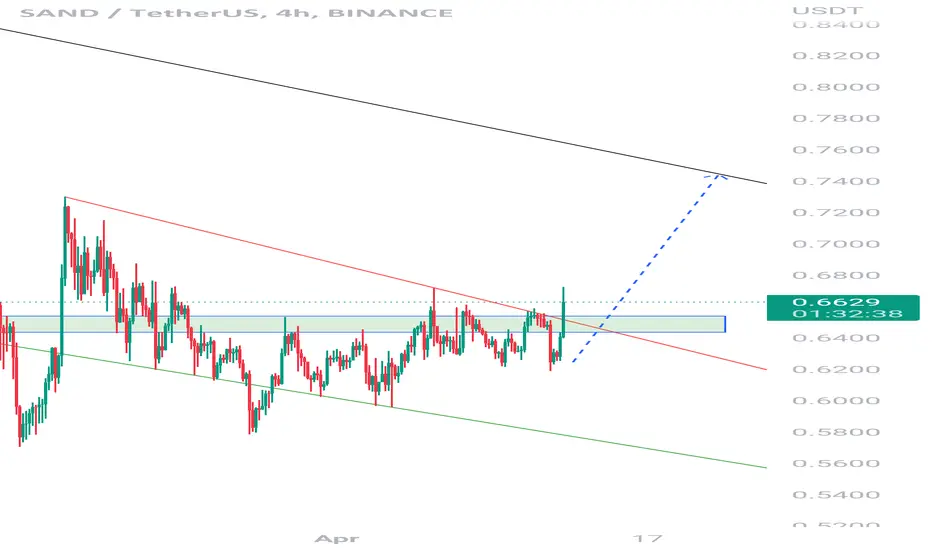
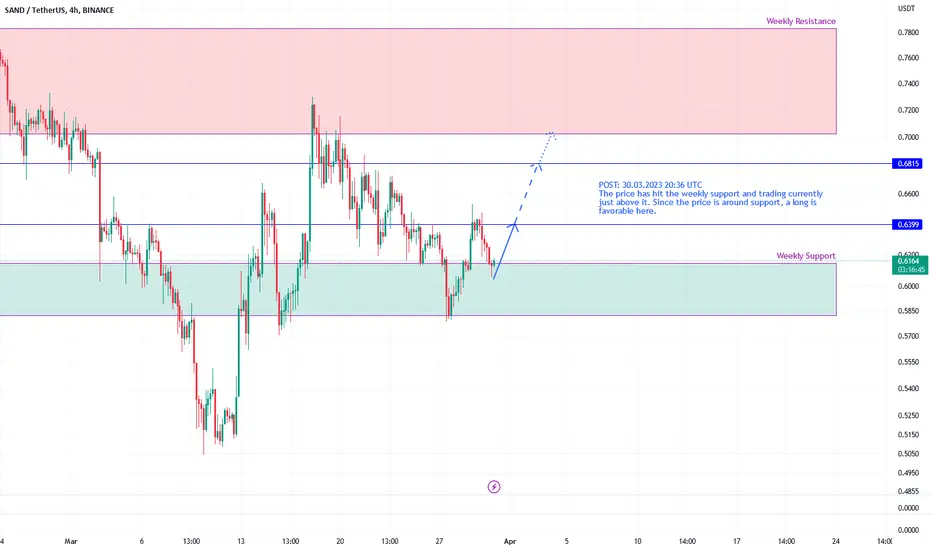
SANDUSDT on weekly support, long favorable towards weekly resistThe price has hit the weekly support and trading currently just above it. Since the price is around support, a long is favorable here.
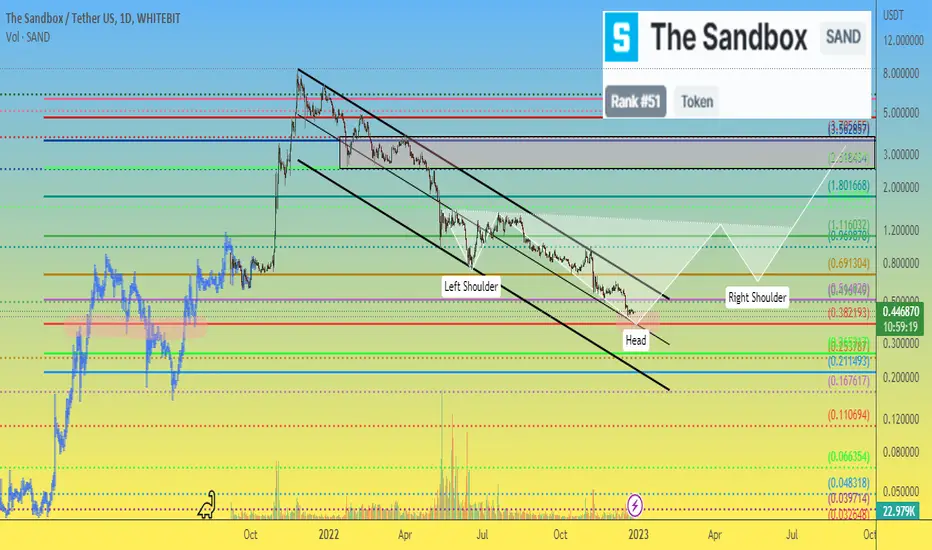
The Sandbox SANDUSDT price has a chance to form "Inverted H & S"It is very likely that the SAND token price of the once quite popular The Sandbox project is now close to the low of this protracted downtrend.
Looking at the global chart of SANDUSDT, it is safe to say that the price range of $0.38 - $0.45 is a tasty zone for placing buy orders with a grid. Of course, if you believe in this project and see future prospects in it and in the gaming crypto world in general.
The first target for the possible growth of the SANDUSD price is $1-1.20 (x3-x4 growth)
In the longer term, if and when the crypto market comes to life, we can think about the SAND price in the range of $2.50-3.50.
It is in this liquidity zone that the target of the probable "Inverted Head and Shoulders" pattern falls.
More precisely, the final growth target can be calculated when the formation of this pattern is finally confirmed.
Then we will update the idea of SANDUSDT with more specific targets for the final growth.
_____________________
Did you like our analysis? Leave a comment, like, and follow to get more
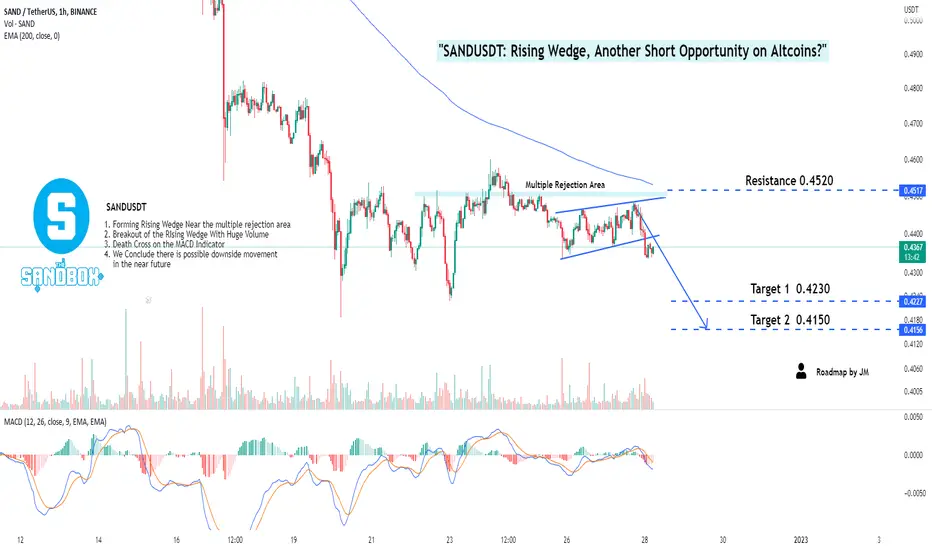
"SANDUSDT: Rising Wedge, Another Short Opportunity on Altcoins?"Hello Fellow Stock Global Trader/Investor! Here's Technical Outlook on SANDUSDT
Chart Perspective
SANDUSDT has retested the multiple rejection area and formed a rising wedge. The breakout of the rising wedge pattern indicated a possible bearish bias ahead. The MACD Indicator made a death cross signifying a possible downside movement shortly.
All other explanations are presented on the chart.
The roadmap will be invalid after reaching the target/resistance area.
"Disclaimer: The outlook is only for educational purposes, not a recommendation to put a long or short position on the SANDUSDT"
SANDUSDT analysis buy signal 12/3/2022we will stick to our yellow BC buying area after formation of III yellow sequence RR :3:1 talking in consideration that the market can take the bearish green target as point of starting bullish sequence
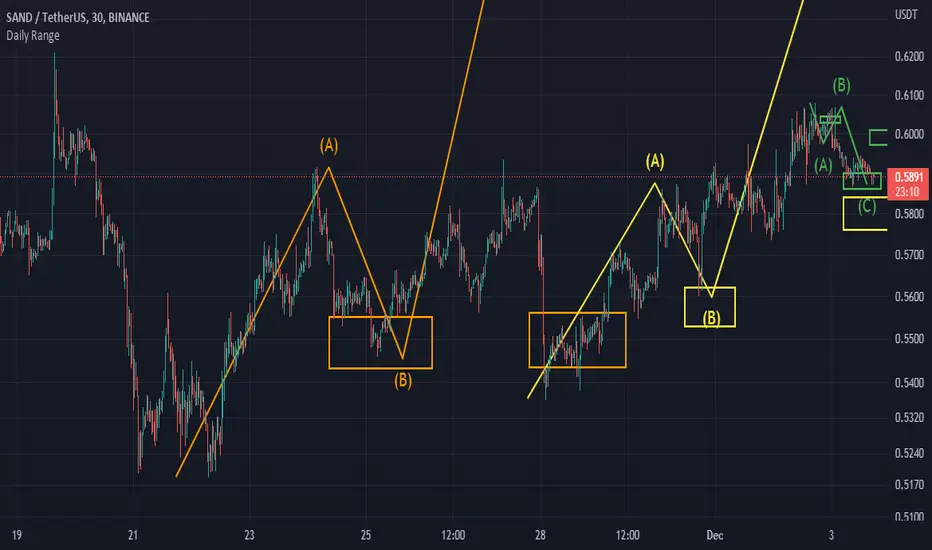
SANDUSDT analysis buy setup 12/11/2022if market go with the scenario shown with the green area it will give strength to bulls to raise the market ICI sequence will be formed

SANDUSDT - Descending Broadening wedge pattern!SANDUSDT (1D Chart) Technical analysis
SANDUSDT (1D Chart) Currently trading at $0.893
Buy level: Above $0.88
Stop loss: Below $0.65
TP1:$1
TP2: $1.4
TP3: $2
TP4: $2.5
Max Leverage 2x
Always keep Stop loss
Follow Our Tradingview Account for More Technical Analysis Updates, | Like, Share and Comment Your thoughts
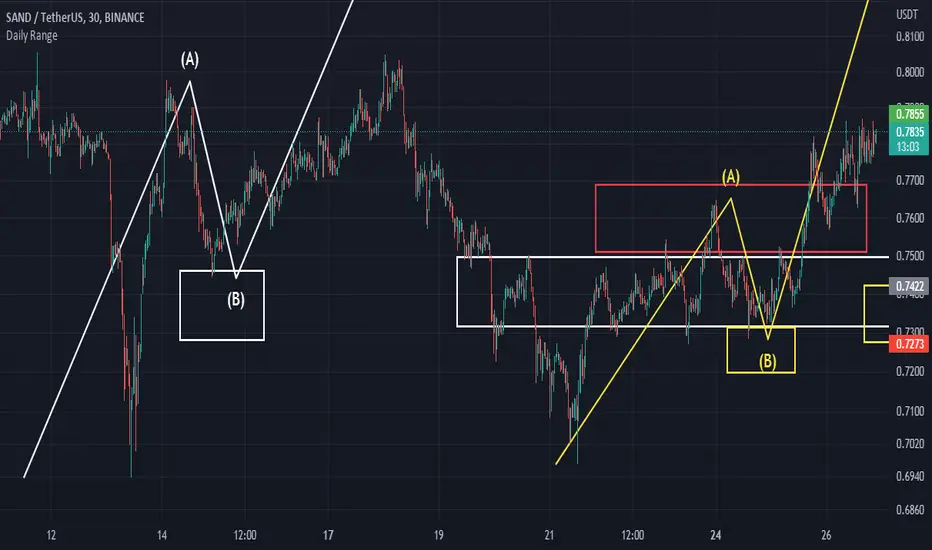
SANDUSDT analysis buying signal crypto If market go as planed to our yellow WCL area this will be good buying setup or we can wait activation of the wcl by formation of smaller bullish smaller sequence
SAND:: Support/Resistance Lines :: 1DA tough trade on the 1D chart because price is floating below the resistance line and far from the support line.
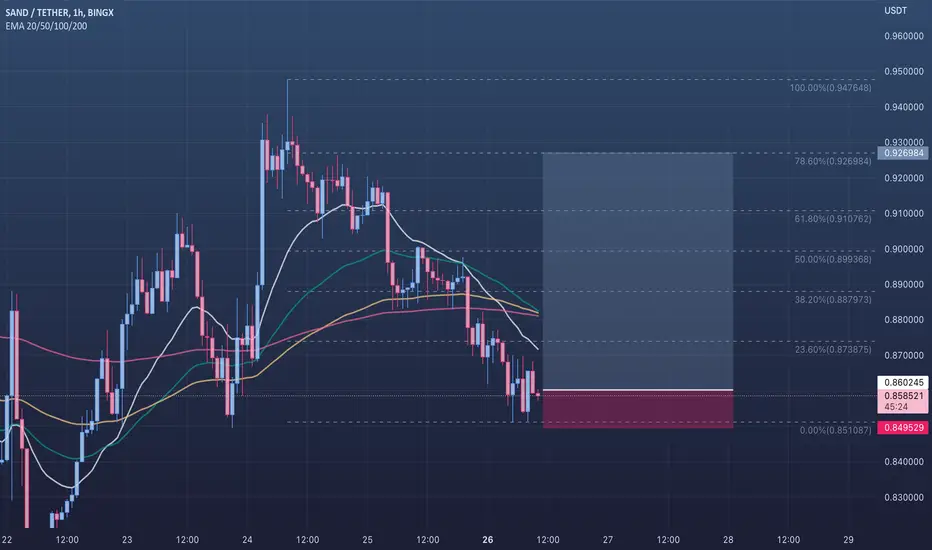
🟢 SANDUSDT - 1H (26.09.2022)🟢 SANDUSDT
TF: 1H
Side: Long
SL: $0.849529
Leverage: 5x
TP 1: $0.873875
TP 2: $0.887973
TP 3: $0.899368
SANDUSDT - Descending Broadening Wedge Pattern!SANDUSDT (4h Chart) Technical analysis
SANDUSDT (4h Chart) Currently trading at $0.947
Buy level: Buy after Breakout
Stop loss: Below $0.844
Target 1: $0.985
Target 2: $1
Target 3: $1.2
Target 4: $1.4
Max Leverage 3x
Always keep Stop loss
Follow Our Tradingview Account for More Technical Analysis Updates, | Like, Share and Comment Your thoughts

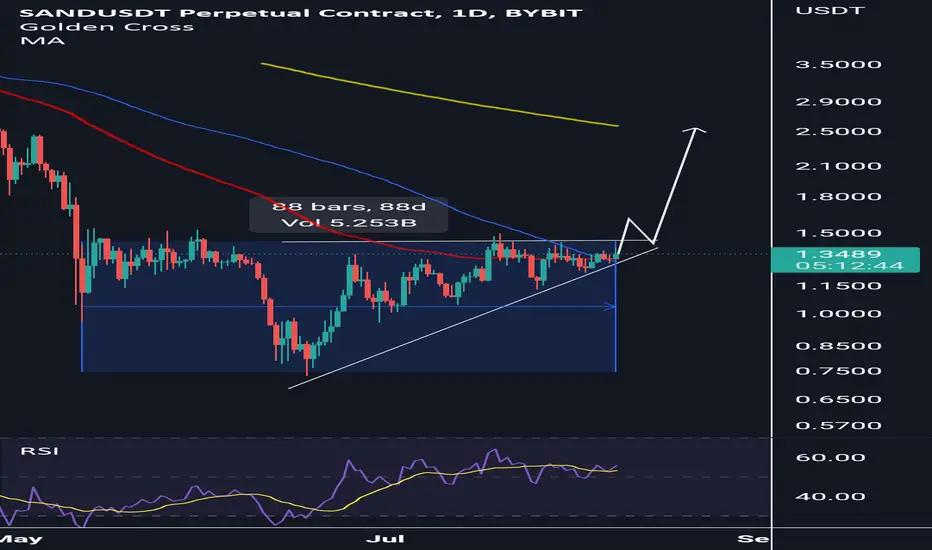
SANDUSD Hello Traders,
After 88 days in accumulation phase forming a triangle SAND seems ready to breakout.
Confirmation on 4H chart.
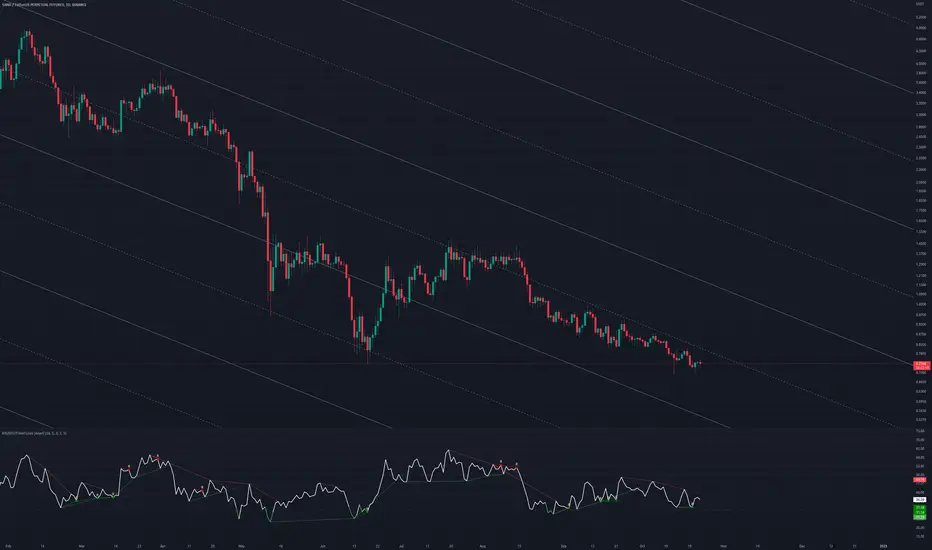
Gann setupwhen third Gann line break we can open short and you can set your targets on other supports or distance of TR

SANDUSDT 1h Retest TradingWe always have to trade on grounds.
There are two points of view from the current position: retesting and descending in the sky blue upward trend line and retesting and descending in the red downward trend line.
The upward view is to test the sky blue upward trend after breaking through the red downward trend.
We can implement a response strategy at the test point.

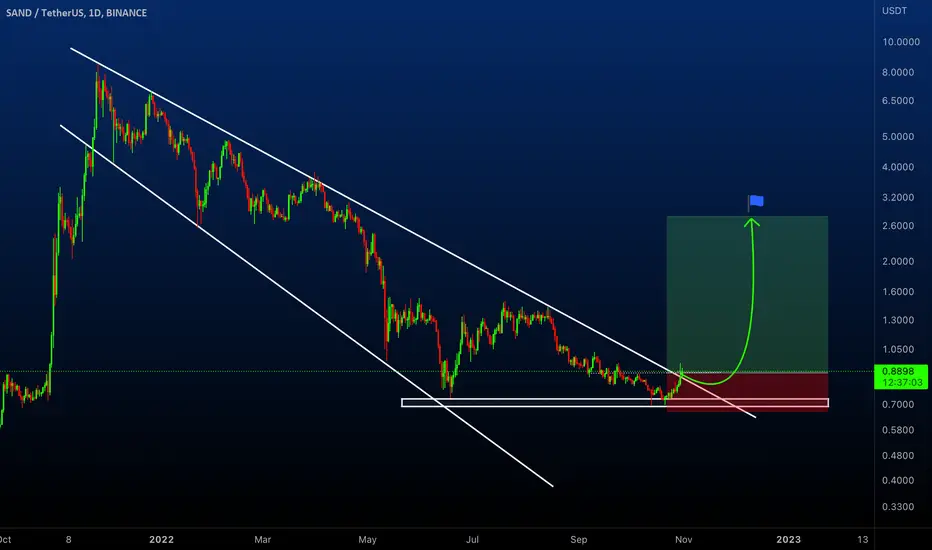
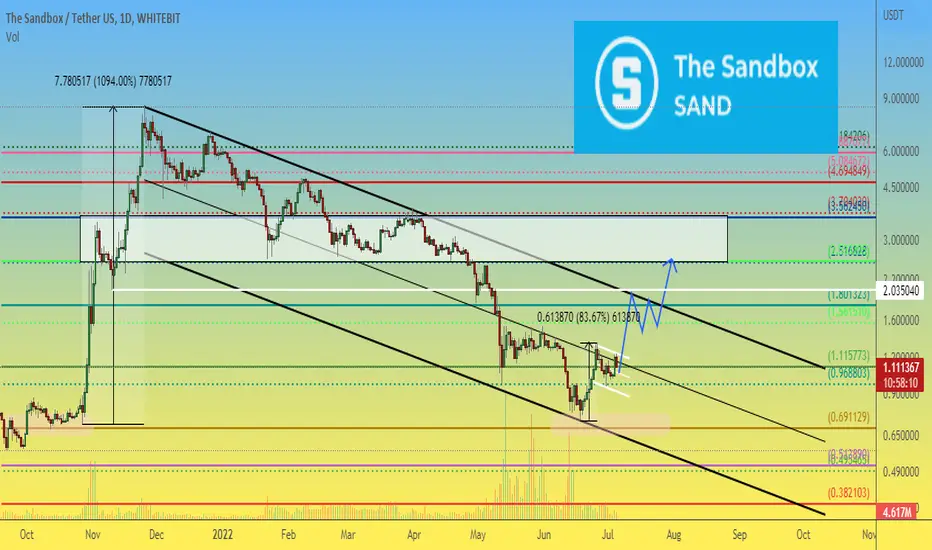
SANDUSDT 1D Is it time to play in The Sandbox again?)During the strong fall of the crypto market in May-June 2022, the SANDUSDT price reached a liquidity level around $0.70
Around this level that the liquidity position was gathered in October 2021 before the upcoming 1100% upward pumping.
In June 2022, the rebound from the bottom was +84%, but the price of SANDUSD, despite two attempts, at this moment could not get a foothold in the upper part of the downtrend channel.
The message of this idea is simple: if you believe that game tokens still have a future in the crypto market, then The Sandbox is worth your attention. At least on the chart we see activity and the struggle of buyers and sellers.
Ideally, wait for the Sand price to fix above $1.10-1.20.
The first target from above is $2
Large positions will begin to sell off no faster than in the liquid zone of $2.50-3.50
_______________________________
Since 2016, we have been analyzing and trading the cryptocurrency market.
We transform our knowledge, trading moods and experience into ideas. Each "like under the idea" boosts the level of our happiness by 0.05%. If we help you to be calmer and richer — help us to be happier :)
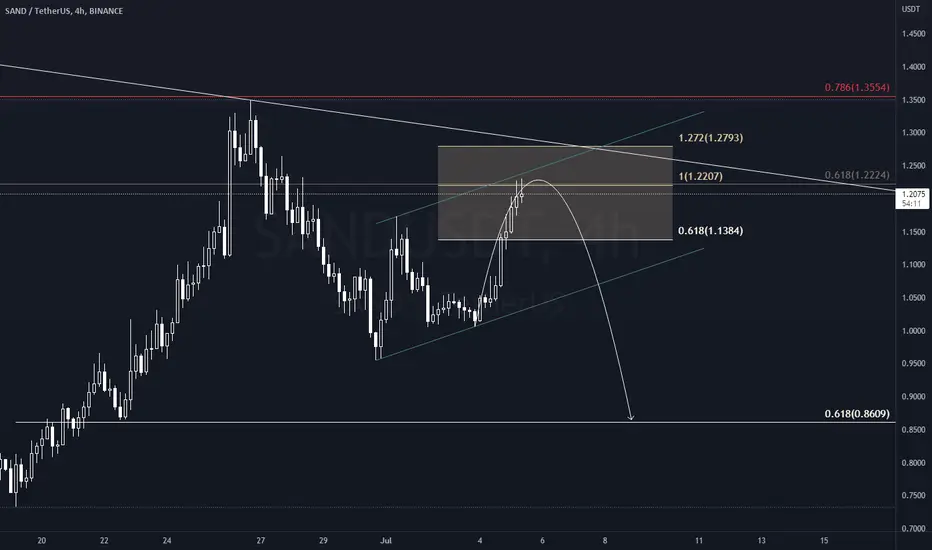
SAND WILL GO MORE LOW ?Here is my opinion about SANDUSDT, i just see a Bearflag overthere, i just open my short position with Entry $1.22, and in my perspective it will go to $0.8609, I put my Stoploss at $1.3554
#SAND/USDT TRADE SETUP Hi guys, This is CryptoMojo, One of the most active trading view authors and fastest-growing communities.
Do consider following me for the latest updates and Long /Short calls on almost every exchange.
I post short mid and long-term trade setups too.
Let’s get to the chart!
SAND also looks bullish here. Long some here and add more up to $1.44
Remember to get in partially don't buy at once. It's important to keep your entry as low as possible. The best way is to buy in parts which will eventually average your entries.
Target:- 20% to 30%
SL:- $1.38
Lev:- 10x
This chart is likely to help you in making better trade decisions, if it did do consider upvoting this chart.
Would also love to know your charts and views in the comment section.
Thank you

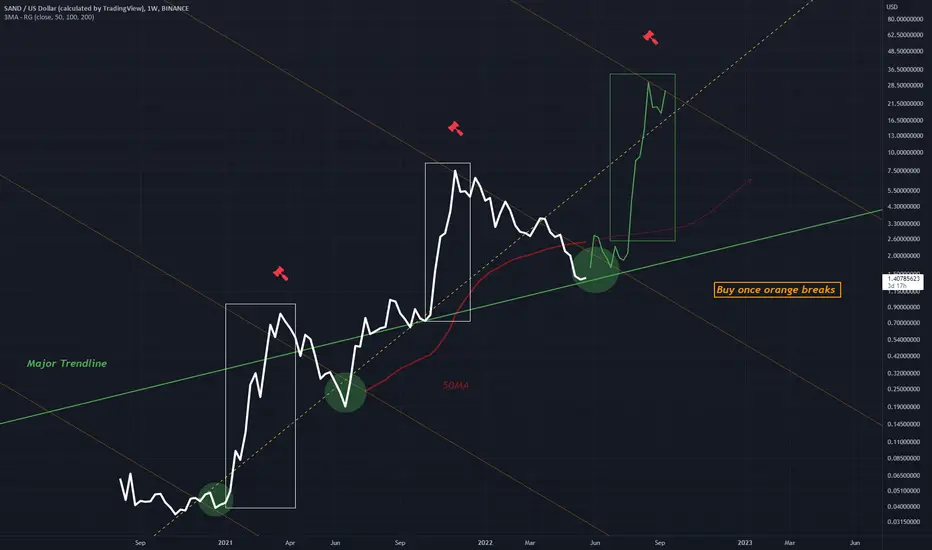
SANDUSD Buy Above Downtrend LineThis chart shows periods of sharp growth followed by a down period
So far the pattern has repeated twice
A third up move is up coming next if the pattern repeats again
This will most likely occur once price breaks the orange downtrend line
Price once upward break out will most likely reclaim the weak yellow uptrend
Weekly Chart