BTC 1H Analysis – Key Triggers Ahead | Day 17💀 Hey , how's it going ? Come over here — Satoshi got something for you !
⏰ We’re analyzing BTC on the 1-hour timeframe timeframe .
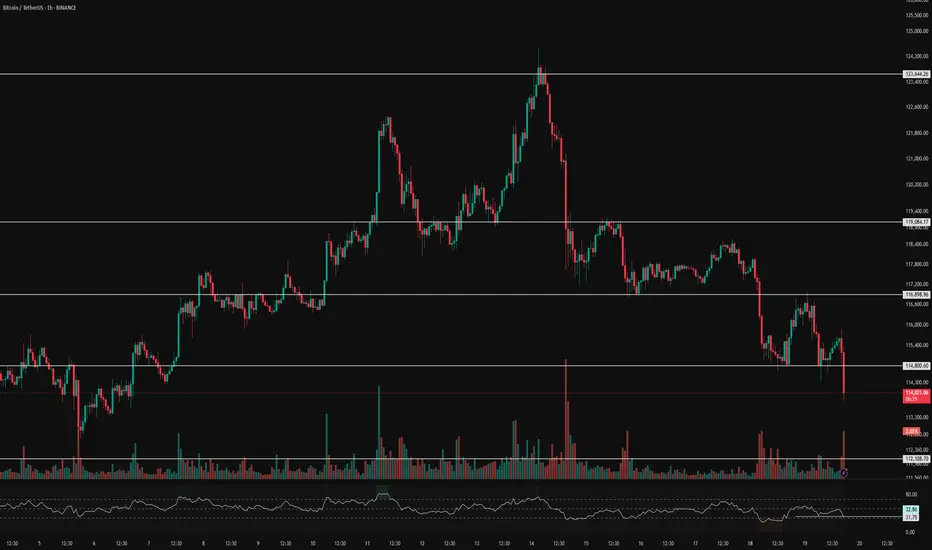
👀 On the 1-hour timeframe, we can see that Bitcoin, after losing the $115,000 support zone, moved toward its next support at $113,000 .
⚙️ Our key RSI zone is 27.89, and if this level is lost, Bitcoin will face more selling pressure. The next key RSI zone is 49.74, and breaking above this level could push Bitcoin higher .
🕯 The size of the red candles has increased, and with each rise in trading volume, selling pressure grows stronger. Step by step, as supports are lost (big money in whale wallets and unrealized positions being released), Bitcoin faces heavier selling pressure .
💵 USD.D on the 1-hour timeframe is moving upward and is facing a strong resistance around 4.5%. If this resistance is broken, Bitcoin will likely come under even more selling pressure .
🔔 Our Bitcoin alert zone is set at $113,000: if this zone is broken, Bitcoin could fall to lower support levels. Our alert zone for a long trade is $115,000, and by observing price action around these two zones, we can identify the best type of trade .
❤️ Disclaimer : This analysis is purely based on my personal opinion and I only trade if the stated triggers are activated .
Saotshiframe
BTC 1H Analysis – Key Triggers Ahead | Day 16💀 Hey , how's it going ? Come over here — Satoshi got something for you !
⏰ We’re analyzing BTC on the 1-hour timeframe timeframe .
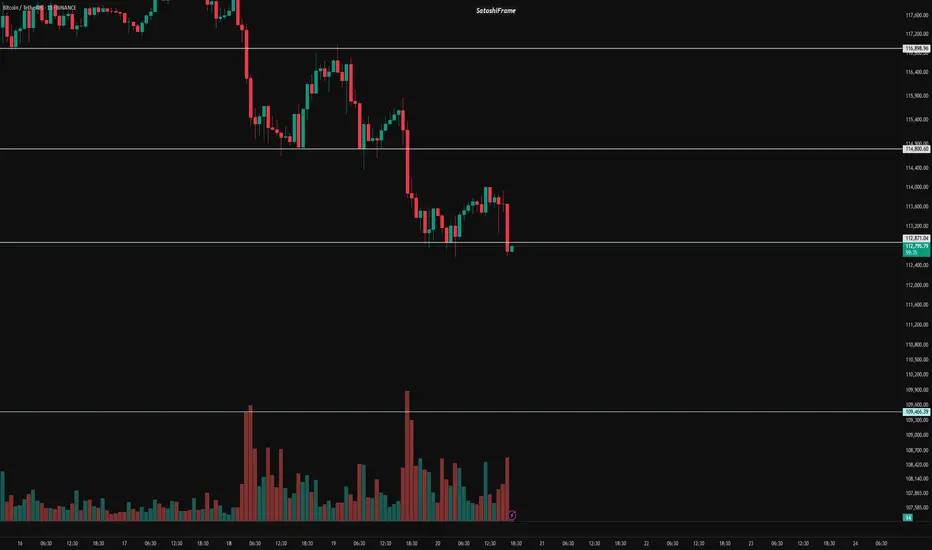
👀 On the 1-hour timeframe for Bitcoin, we can see that after losing the $115,000 support zone, Bitcoin is moving toward lower price levels. With increasing selling pressure, a deeper correction is likely.
⚙️ Our key RSI level is 33. If this level breaks down, short positions will gain more momentum, and the probability of entering the oversold zone will increase.
🕯 Candlestick behavior shows that bearish/red candles are larger in size and volume, initiating each corrective wave strongly. In contrast, bullish candles are smaller in size, higher in number, and have less volume, which reflects the strong dominance of sellers.
💵 USDT dominance (1-hour timeframe) has successfully broken above 4.37%. The next resistance lies at 4.50%. If this level is also broken, it will likely trigger even more selling pressure on Bitcoin.
🔔 Alarm Zone : There is no specific alarm zone right now, but by watching for pullbacks and breakouts in either direction, we can determine when to open new positions.
❤️ Disclaimer : This analysis is purely based on my personal opinion and I only trade if the stated triggers are activated .