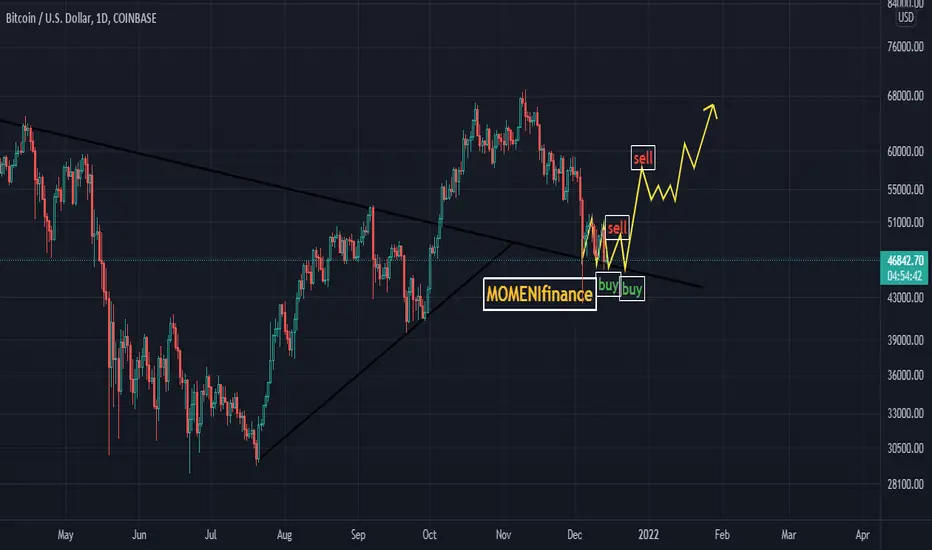
BTCUSDT 1d LongBTC / USD technical analysis
The 100-day moving average lowers the price of bitcoin and gives us a signal to enter the market.
Do you think we should wait for the green market? Please comment
This analysis is only for better awareness and decision making
I hope you find it useful 🙏
MOMENIfinance.
Satoshi
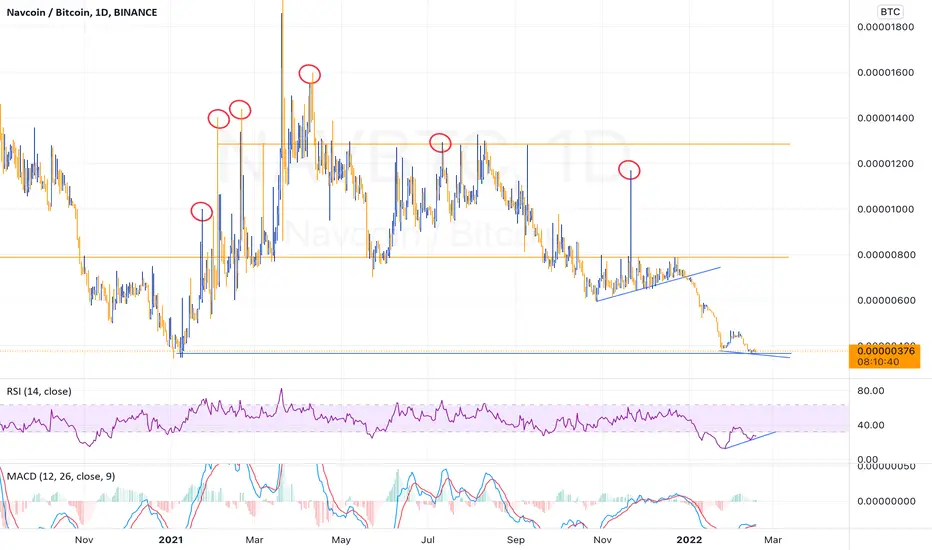
NAV/BTC (A high risk, high reward)NAV is a low cap coin, rank 950 and only has BTC pair. Price is essentially at its all time low, its a privacy coin. Although this looks like a shit coin, a big jump is due according to chart, we can target a 600-900 satoshi jump if it does. Their team is still active on twitter and RSI is showing a bullish divergence. Only buy with small part as the risk comes from the fear as theres potential of it being delisted.
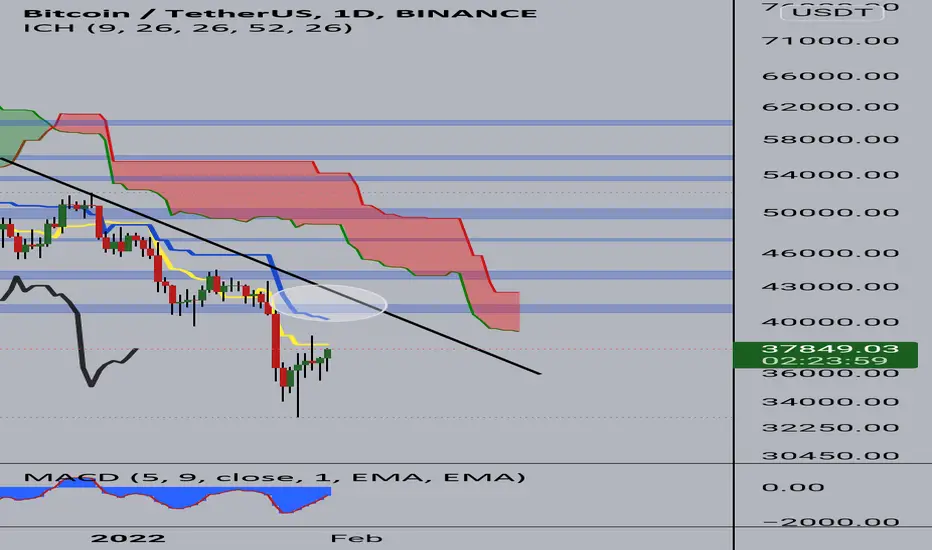
BTC/USDT Daily corrective OTWtake care, there is very important and strong overlap (white area) we have trend , kijon and price level
from 40400$ to 41100$
focus this is Daily chart !
BTCBTC Fresh Prediction For The Upcoming Move
Be Aware It will Drop According to my Entry.
Because you just see a technical analysis, but
it,s more than Technical Analysis.
_Huge Short order on 39k .
_Whales Huge SHORT Order on 39K.
NOT A FINANCIAL ADVICE!
HAPPY TRADING

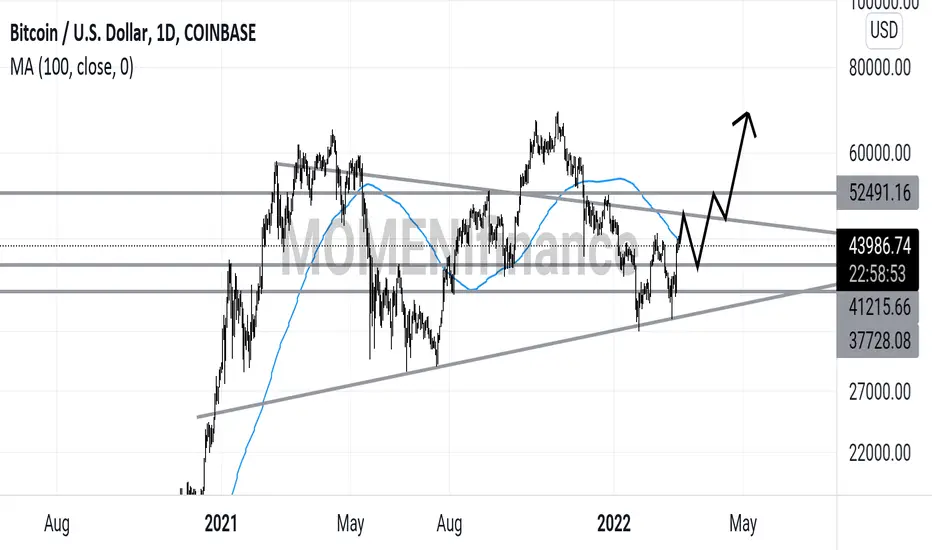
IS THIS THE BOTTOM FOR BITCOIN???Well would you look at that, a Bitcoin analysis.
Opting for the Higher time frames here, from the chart above we have 4 trendlines, all of which have played significant roles in bitcoin achieveing it's current price action.
Looking at the trendline that initiated the bounce on November in the year 2011, bitcoin has found itself at the trendline once again after a tiresome year of sideways movement. You could say this is the bottom.
Now in march year 2020, a sell-off came about due to the news of Covid-19 which was a life event that threw technical analysis out the window and saw us create a new trend support.
Prior to that, Bitcoin took a bounce off the first trend support shown in the chart and went up all the way to our current trend resistance to make a local top of 13.9k before initiating the covid sell-off event, a move which spanned 9months(274days) from local top to global bottom and still managed to close the month just above our Nov. '11 trend support. (Which means it is a strong area of support)
Right now, bitcoin once again has hit that same resistance where the local top was made, and is at the trend support from which the sell off eventually closed its candle but is also on the 9th month of the move (but 275 days instead). Should this monthly candle close without making a sell-off to the covid trendline, i can confidently say this is the bottom and that we would see new highs including a cycle top this year by at least Q2.
But becareful, some alts still havent reached support, so it is possible that this isn't the bottom.
If you agree with this idea, pls make sure to like and leave your thoughts in the comments section.
As always, feedback is appreciated.

DigitalSurf: Bitcoin Could Soon Retest the $40,000 Price PointBased on my current assessment of Bitcoin's mid-macro wave count, I expect price point to retest $40,000 in the next few weeks.


BTC Short Idea - Bearish DivergenceLooking at the daily chart, we see a clear bearish divergence.
We've recently broken the downward trendline, which many believe will be a major break out to new ATH. However, looking at the weekly and monthly charts, I still have a strong bearish outlook to the short-midterm timeframe. 12/24 we see a bearish pin bar when attempting to break above one of the rising trendlines.
I feel the bulls have a short term victory, but looking at the daily MACD, the latest fall from ATH has brought us below the bullish trendline and has left us below the 0 line marker. As this MACD rises to retest this level, I feel there will be a strong resistance and will bring the market crashing back towards the 30K level.
Feel free to comment your ideas, or ask any questions. I have further support for this theory that I did not touch on in this post.
Trade with care. Not financial advice.

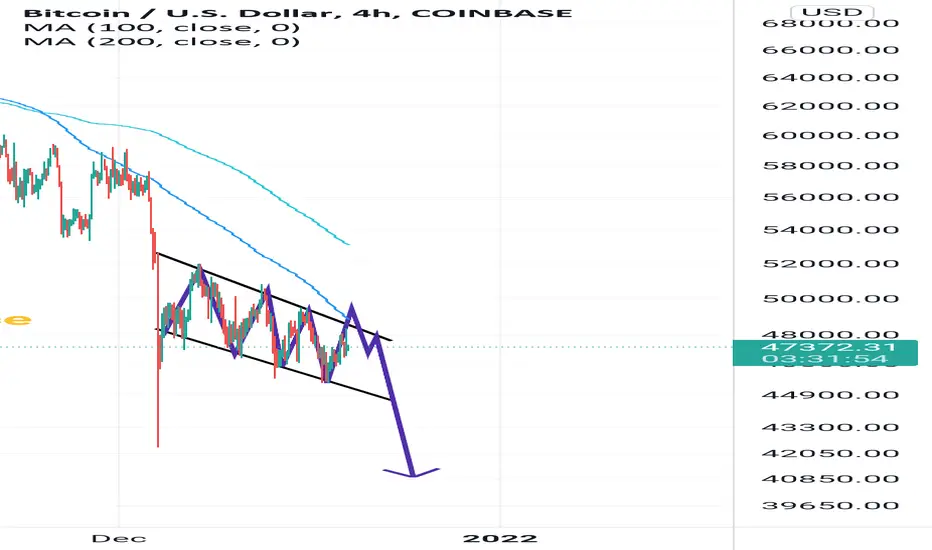
BTCUSDT 4hBTC / USDT Technical Analysis
Moving Average and channel pattern indicate the decline of bitcoin in the medium term
This analysis is only for better awareness and decision making
I hope it is profitable for you 🙏
MOMENIfinance
BTC testing 50Week Ma & 50Week SMA!Update of my last post..
Historically the 50Week Ma (Yellow Line) & 50Week SMA (Pink Line) on Bitcoin have been good indicators when showing support and resistance areas and confirming either long continued uptrends or downtrends (Bull or Bear Markets).
Currently, unlike previous crosses they are running parallel with each other instead of abruptly crossing one another. Interesting to see where we close this week, definitely a fight between the bulls and the bears!

BTCUSD 1dBTC / USD Technical Analysis
Do we have to wait for a price increase? 🤔
Comment on
This analysis is only for better awareness and decision making
I hope it is profitable for you 🙏
MOMENIfinance
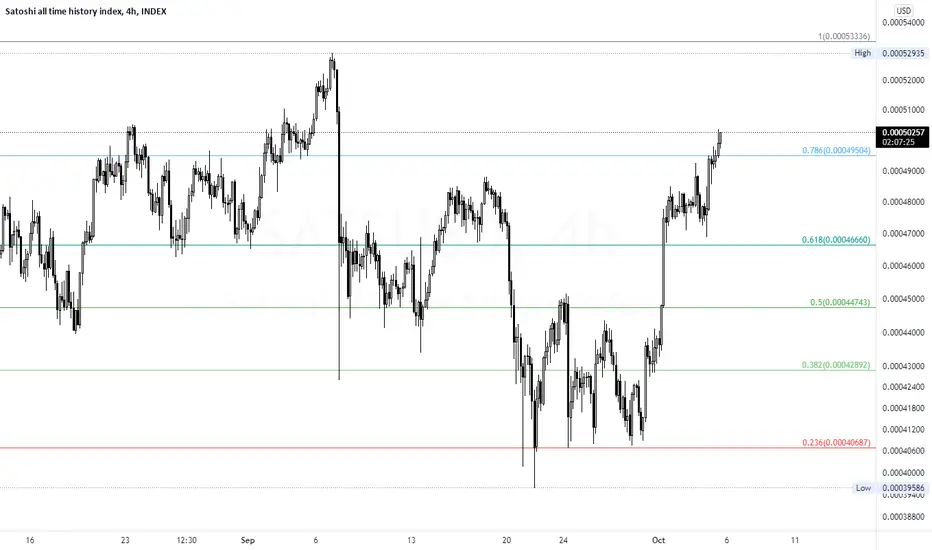
Bitcoin Fibonacci Based on Area - DeadCat Bounce Scenario!Hi guys, Please take a look at my chart. It's pretty basic and let me know how I can improve it. I'm looking to see if Bitcoin can have one last move higher to the mid 50s to complete its "dead-cat bounce scenario." RSI is too oversold and we have majors supports in the 46.5k region. 200 SMA is around the .50 Fibonacci. Thanks.

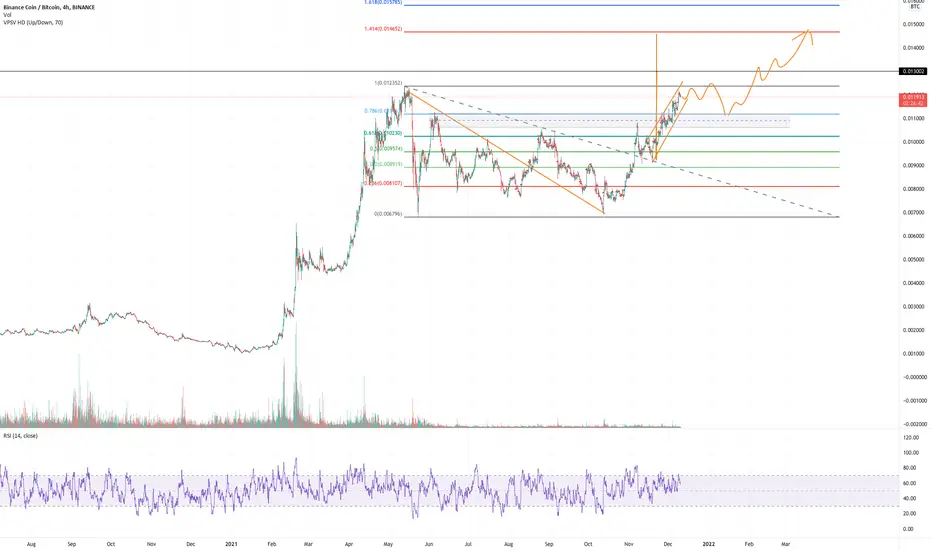
#BNB gonna make a huge move | NEW ATHHello Padawans.
No more long captions for today, I think this chart sense more than 1000 words.
let's see what will happen next.
#NFA
Cheers padawans,
may the force be with you.
Bitcoin Bullish Divergence Before Thanksgiving.Hi traders, Bitcoin is starting to form a bullish divergence on the daily RSI. This is what we look for prior to a potential reversal. MACD is showing signs of reversal. Bitcoin is starting its move out from the descending triangle it's in. In the 2017 Bull Run Cycle Thanksgiving day was VERY Bullish. Thank you, leave a like.

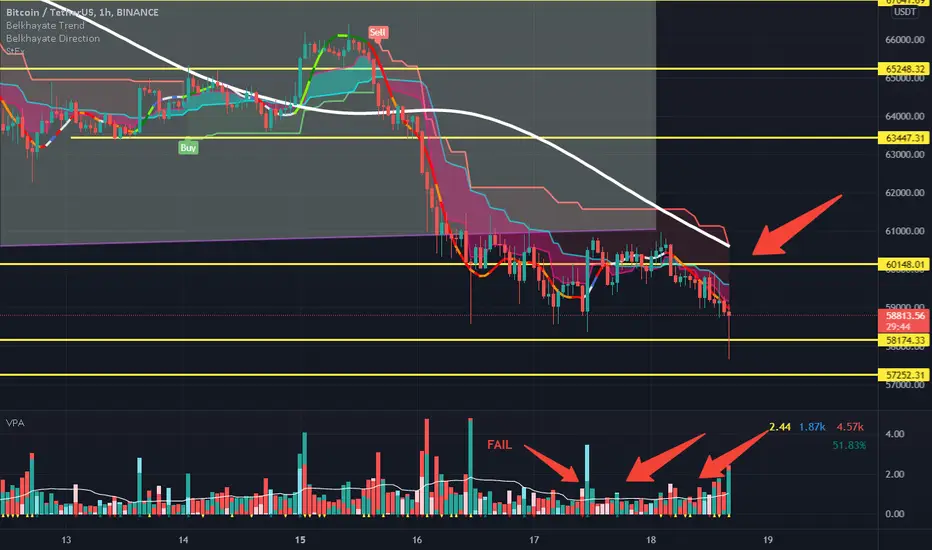
BTC/USDT - Analysis Break $58KMany Sell pressure,
Below HMA 209,
All volume are low,
Direction Bear !!
We still bear !!
Trade safe but never use a stop loss !!
Bots will catch you !!
Use Alert to stop your trades.
Bitcoin Bulls Prepare for Big Bounce From Mid $57K.Bitcoin Bulls look for new ATH near $75K. How long will it last?
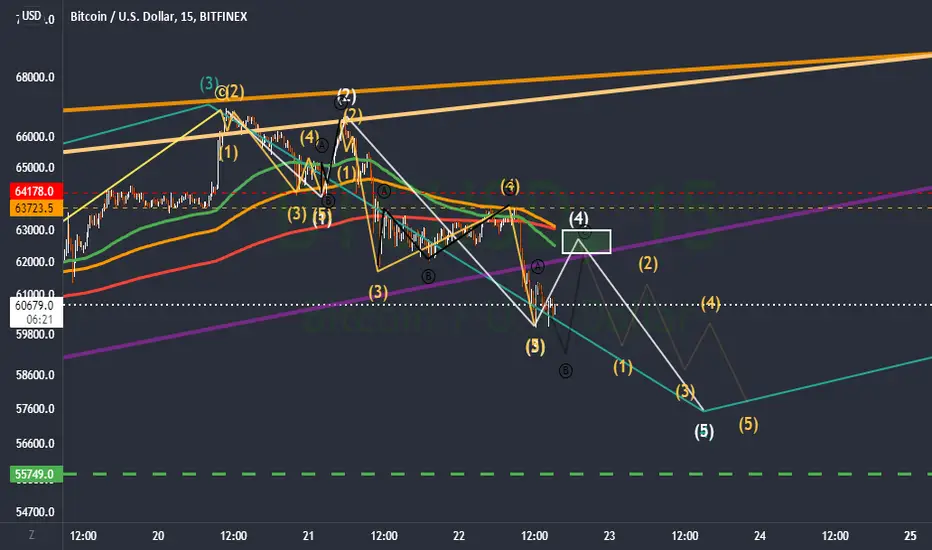
Still not so sure. BUT THIS IS ITBOOOOOOOOOM BITCOIN
They Say i'm screaming bro
SEEEE THAT RISING WEDGE MOFO? YEAH BRO YOU SEE IT BRO
BRO I JUST GOT OFF THE COKE
I Work on Wall street Boe.
I WENT INSANE

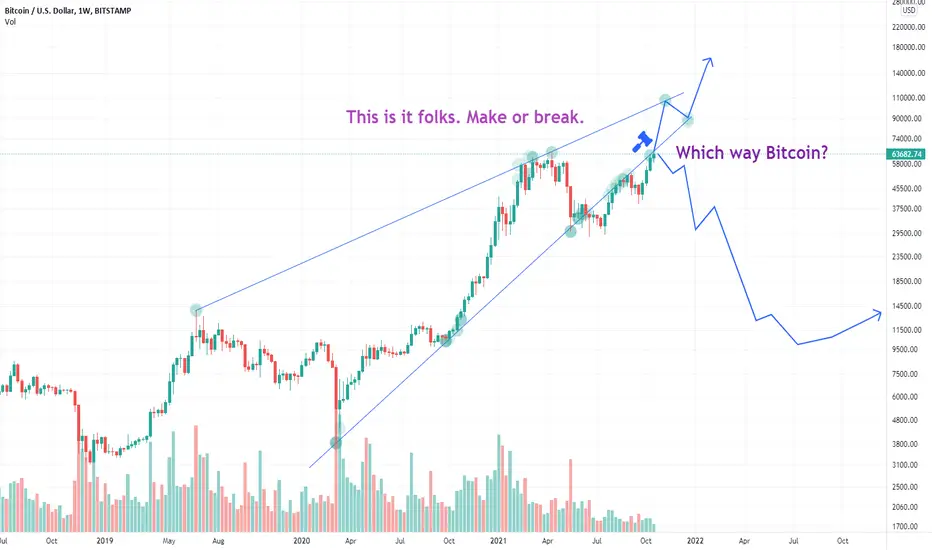
MOST IMPORTANT MOMENT IN BITCOIN HISTORYBOOM! I'm back with it! This ain't no joke anymore..
Keep calling me a clown..
This is TOP TIER TECHNICAL ANALYSIS.
You keep doing your Bibonaccis' and all that... But this is it..
This is why I work on Wall Street.. No other can do this analysis..
THAT RISING WEDGE IS VALID...
It will make the decision..
Game is on brothers.
Like and comment please. Make discussion.
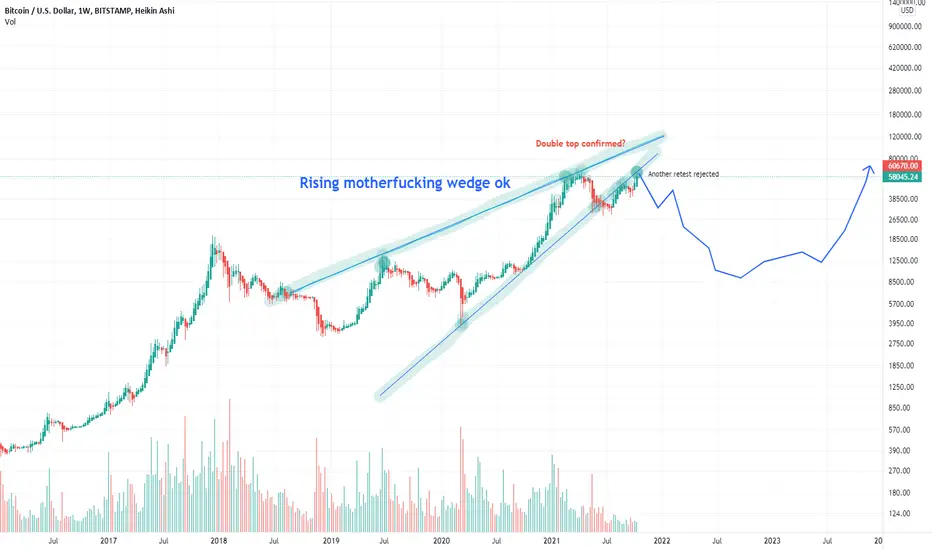
BITCOIN MACRO ANALYSIS (but short?)Are you ready for this conversation? Rising wedge broken and being tested..
Bearish pattern..
See you at 10k suckers!
I'm full cash bread.
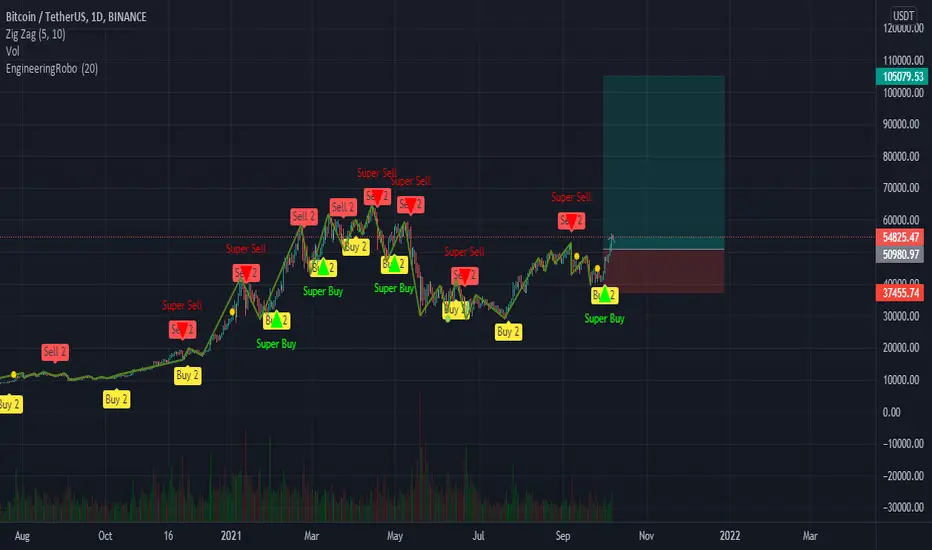
Medium Term btc bullish scenarioI'm extremely bullish on this pair for many fundamental reasons. Technically, we have a super buy scenario on this chart. It would be interesting to follow this trend until we get another super-sell scenario. Please watch closely, it would be exhilarating.
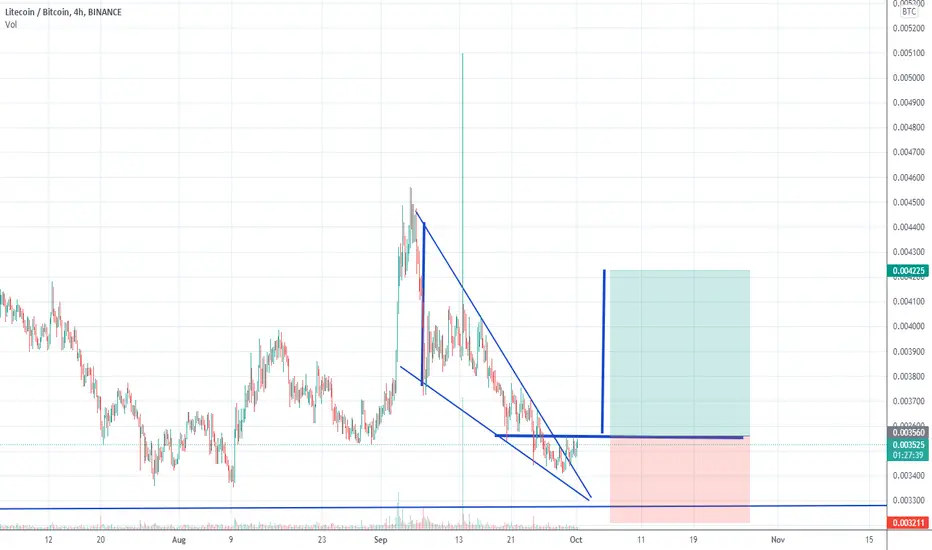
18% UPSIDE for LTC/BTC. ALTCOINS to RUN in 7 DAYS.A falling wedge formation has completed and set to breakout with an 18% target to 0.042 BTC. Trade safe my friends.