BTC 1H Analysis – Key Triggers Ahead | Day 3💀 Hey , how's it going ? Come over here — Satoshi got something for you !
⏰ We’re analyzing BTC on the 1-hour timeframe .
⏱ We’re analyzing Bitcoin on the 1-hour timeframe.
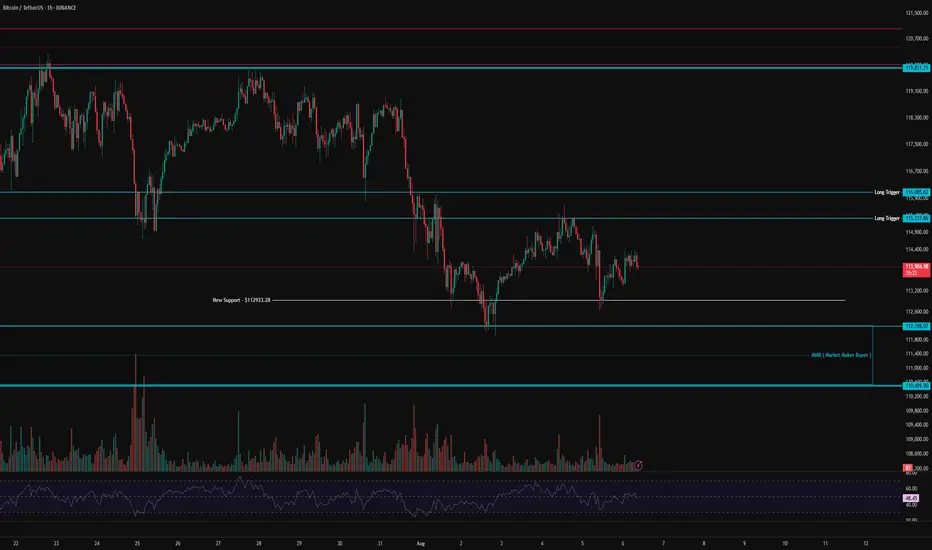
👀 After bouncing from the current $113,000 area, Bitcoin moved upward, indicating the presence of market maker buyers in this zone. A short-term support has formed at $113,000, and yesterday we saw a strong rejection from this level, which helped prevent further selling pressure.
Bitcoin now faces a resistance zone and a potential long entry trigger between $115,317 and $116,085. If long positions increase and short positions get squeezed, this resistance could be broken, potentially fueling a bullish move.
⚙️ On the RSI, our key level is the 50 range. A confirmed hold above this level could signal a higher low forming relative to the previous bottom at $112,933.
🕯 We’re seeing an increase in trading volume, and as the price moves closer to $110,499, there's a noticeable liquidity pull from long positions—more buyers are stepping in around this area.
📈 Our long position trigger lies within the resistance zone mentioned. A confirmed breakout and hold above this level, alongside RSI entering Overbought across multiple timeframes and volume expansion, would give us a solid entry for a long position.
📉 Our short position trigger is below $112,200. A sharp drop with strong selling pressure and RSI entering Oversold would justify a short entry—though I do not recommend taking this trade.
❤️ Disclaimer : This analysis is purely based on my personal opinion and I only trade if the stated triggers are activated .
Satoshiframe
BTC 1H Analysis – Key Triggers Ahead | Day 2💀 Hey , how's it going ? Come over here — Satoshi got something for you !
⏰ We’re analyzing BTC on the 1-hour timeframe .
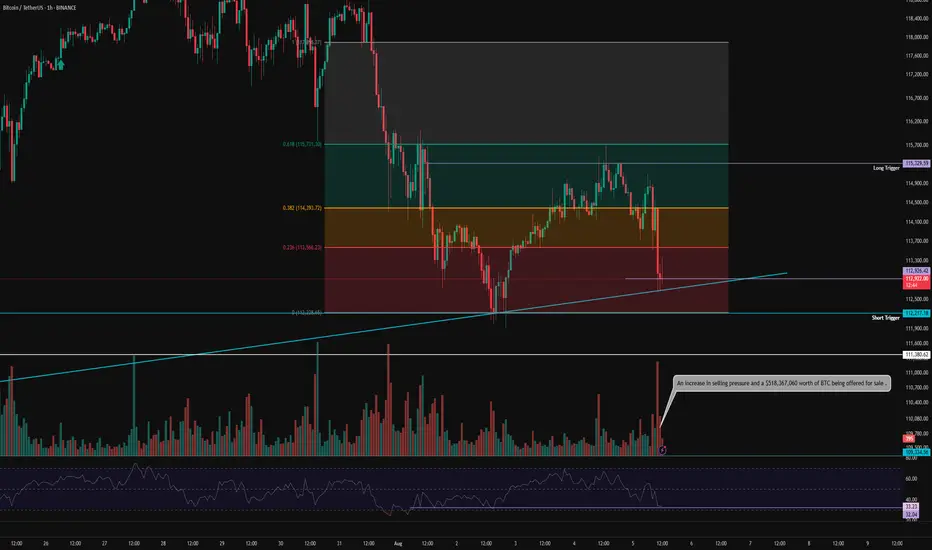
👀 After the strengthening of the US dollar , Bitcoin experienced a drop and formed a short-term support bottom around the $113,000 level . It is currently completing a pullback to the levels of this recent decline .
🎮 Our Fibonacci retracement is drawn from the breakout zone to the $112,200 bottom . Bitcoin broke below the 0.236 level and then found support . The best potential entry trigger, based on Fibonacci, is at the 0.382 level, or around $115,000 . If Bitcoin breaks above this level , it could form a higher high and a higher low in this timeframe .
⚙️ The RSI is showing a support level around 32 , which is currently preventing Bitcoin from entering the oversold zone . However , if this support is lost , Bitcoin could move into oversold territory .
📈 Our long position trigger is at the 0.382 Fibonacci level . A confirmed breakout of this level , combined with RSI overbuying and increased volume , would be our entry signal .
📉 Our short position trigger is around $113,000 . If this support breaks , we may open a short position . However, the main short trigger is at the 0 Fibonacci level ( support at $112,200 ) . If selling pressure increases and RSI enters the oversold zone , we will consider entering a short position with confirmation .
❤️ Disclaimer : This analysis is purely based on my personal opinion and I only trade if the stated triggers are activated .
BTC 1H Analysis – Key Triggers Ahead | Day 4💀 Hey , how's it going ? Come over here — Satoshi got something for you !
⏰ We’re analyzing BTC on the 1-hour timeframe .
👀 After triggering our long entry levels , Bitcoin faced increased buying volume , and the U.S . unemployment claims came in higher than expected, which was interpreted positively for the crypto market .
🔼 With rising buying volume, Bitcoin may continue moving toward higher levels and could even aim for a new local high. Our key support zones are the same trigger levels we've been watching—these are also our ideal long entry points .
⚡️ There is a strong resistance around $117,000, where taker sellers are actively selling their Bitcoin at premium prices. In order to break through this area, we’ll need solid volume inflow from both market makers and retail buyers .
⚙️ There’s no clear RSI support zone at the moment, since on the 1-hour chart RSI is already in the Overbought area and oscillating there .
📈 Long position : Be a bit patient here . Wait for Bitcoin to pull back to key Fibonacci levels , preferably around 0.236 and 0.382, and then bounce back up . Once we break above the pullback, you can consider entering a long trade .
📉 Short position : A short setup could form only if both of our marked trigger levels get stop -hunted, combined with increased selling pressure , support breakouts , and confirmation from bearish candlestick patterns.
That said — we are not looking to short right now, as there are better opportunities to catch strong long entries .
❤️ Disclaimer : This analysis is purely based on my personal opinion and I only trade if the stated triggers are activated .

ETC 4H Analysis : V-Pattern Breakout , $23M Buy & Key Fib LevelsHey , how's it going? Come over here — Satoshi's got something for you !
⏱ We are analyzing Ethereum Classic (ETC) on the 4-hour timeframe .
👀 After breaking above the $19.1 level, Ethereum Classic started a strong and high-momentum bullish move and reached the $25.28 resistance, where it was rejected and entered a deep correction .
A V-pattern support has now formed, and a breakout of this pattern could serve as a signal for the end of the correction .
🎮 We're observing the key Fibonacci zones , drawn from the breakout level and its pullback area .
The 0 level is considered our support base , while the other Fibonacci levels act as resistances and potential long-entry triggers .
The most important upcoming resistance is at $21.16 , which serves as the main trigger for our long position .
We will now monitor whether ETC forms a higher low before reaching this resistance , or reacts to it and then forms a higher low — both scenarios would be valid setups for a long position .
As for the 0.236 Fibonacci level , it's the nearest support, and a pullback to this zone is also possible .
⚙️ The RSI oscillator previously had a key resistance at 57.78 , which has now been broken to the upside , and RSI is currently holding above this level .
🔼 Volume may increase again tomorrow during the New York session .
Today, in the marked candle , $23 million worth of Ethereum Classic was bought , and this market maker buy helped save ETC from a deeper correction .
🖥 Summary :
The breakout of the V-pattern allowed ETC to push upward and form a higher low .
Once the pullback to the identified Fibonacci zone completes , we can open our long position , or alternatively , set a buy stop at that level with a wider stop-loss to manage risk properly .
💡 Disclaimer :))) .

BTC Hourly Analysis – Day 1 | Trend Structure & Key Reactions⏱️ We’re analyzing Bitcoin on the 1-hour timeframe.
👀 After breaking below its support zone at 107,402, Bitcoin experienced a correction along with increasing sell pressure. The price then moved toward the 112,200 support area, where it formed a V-pattern — which has now been broken to the upside.
🎮 We’re using Fibonacci levels to identify key resistance zones and long-entry triggers. A higher low has formed above the 112,217 support and above the 0.382 Fib level, which could serve as a strong confirmation of the breakout .
⚙️ The RSI oscillator on the 1H chart is currently above 50. If buying volume increases, RSI may enter the Overbought zone. The critical level here is 70 — breaking above it can act as a confirmation for a long position .
☄️ A specific Fibonacci-based zone, linked to market maker sellers and supply pressure, was touched, triggering a reaction — around 177 BTC were sold following that touch .
🖥 Summary : As long as Bitcoin stays above its previous high, there’s no immediate concern for long positions. Based on the confirmations above, you may consider entering a long position upon a resistance breakout and taker-seller zone clearance .
📉 No short positions are planned until the 110,000 support level is clearly broken .

Will a Drop Below 4.12 Push BTC to New Highs ?👋 Hello, and welcome to Satoshi Frame .
📊 USDT Dominance , after a sharp move toward 6% , got rejected strongly from that level with a powerful candle .
🔻 Following that , it lost its key support and entered a deep corrective phase .
🚀 During this period, Bitcoin and altcoins experienced a strong upward trend , and 🟠 Bitcoin even recorded a new all-time high .
📉 The key support level for USDT Dominance is at 4.12% .
⚠️ If this level is broken, Bitcoin could potentially reach a new all-time high again .
📐 I’ve drawn my Fibonacci from the point where the support was lost , the structure broke , and the previous uptrend turned into a corrective or bearish trend .
🔽 The breakdown of that key support pushed USDT Dominance down to 4.12% , where we saw strong buying pressure in Bitcoin and altcoins, leading to a sharp upward movement.
🔄 Price then retraced to the 0.382 Fibonacci level (4.61%) , acting as a corrective pullback within the ongoing downtrend.
❌ However , this area triggered a rejection , and now we are witnessing another decline in USDT Dominance.
💡 Disclaimer : This analysis is for educational purposes only and should not be considered financial advice . Always do your own research and manage your risk before making any trading decisions .
